The Ultimate Guide to Hurricane Forecasting

Part 1: Understanding the Basics of Hurricanes
1.1 What is a hurricane?
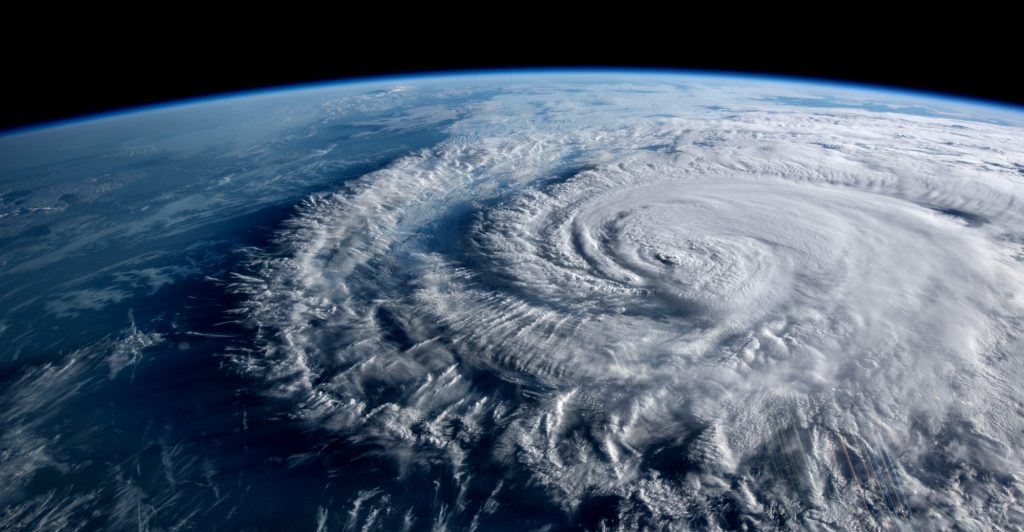
A hurricane is a type of tropical cyclone, which is a rotating, organized system of clouds and thunderstorms that originates over tropical or subtropical waters. Hurricanes are characterized by a low-pressure center, high winds, and heavy rainfall. In the North Atlantic Ocean, Caribbean Sea, and the eastern North Pacific Ocean, these storms are called hurricanes. In other parts of the world, they may be referred to as typhoons or tropical cyclones, depending on their location.
1.2 How do hurricanes form?
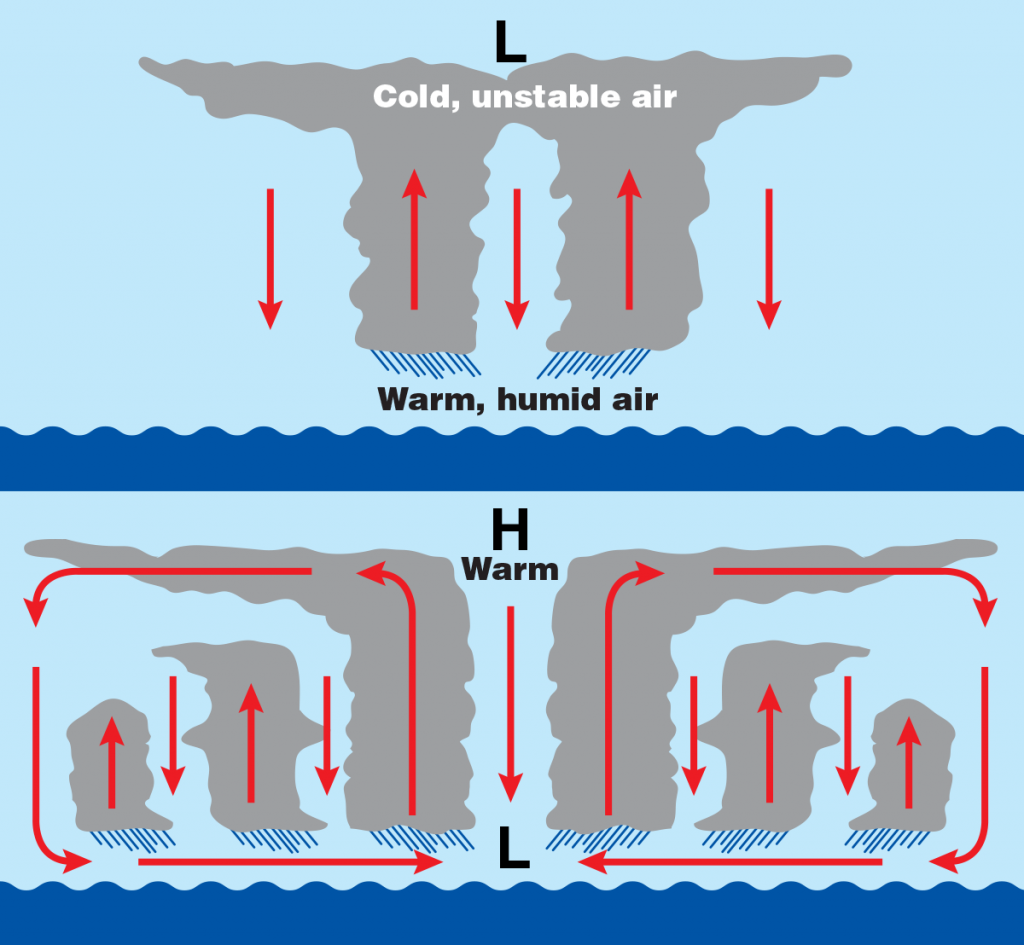
Hurricanes form when specific atmospheric and oceanic conditions are met. The key factors that contribute to hurricane formation include:
a. Warm ocean water (at least 26.5°C or 79.7°F) to a depth of about 50 meters
b. Atmospheric instability, which allows the warm, moist air to rise and form thunderstorms
c. Sufficient Coriolis force, which causes the storm to rotate (this force is minimal near the equator)
d. A pre-existing disturbance, such as a tropical wave or a low-pressure system
e. Low wind shear, which allows the storm to maintain its vertical structure
When these conditions are present, the warm, moist air rises, creating an area of low pressure near the surface. As the air continues to rise, it cools and condenses, forming clouds and thunderstorms. The rotation of the Earth and the Coriolis force cause the storm to spin, and as the system becomes more organized, it can intensify into a tropical depression, tropical storm, or hurricane.
1.3 The life cycle of a hurricane
Hurricanes typically go through four stages of development:
a. Tropical disturbance: An area of low pressure with thunderstorms, but no organized circulation
b. Tropical depression: A low-pressure system with sustained winds of up to 38 mph (61 km/h)
c. Tropical storm: A more organized system with sustained winds between 39 and 73 mph (63 to 118 km/h)
d. Hurricane: A well-defined, rotating storm with sustained winds of 74 mph (119 km/h) or higher
Once a hurricane makes landfall or moves over cooler waters, it begins to weaken and eventually dissipates.
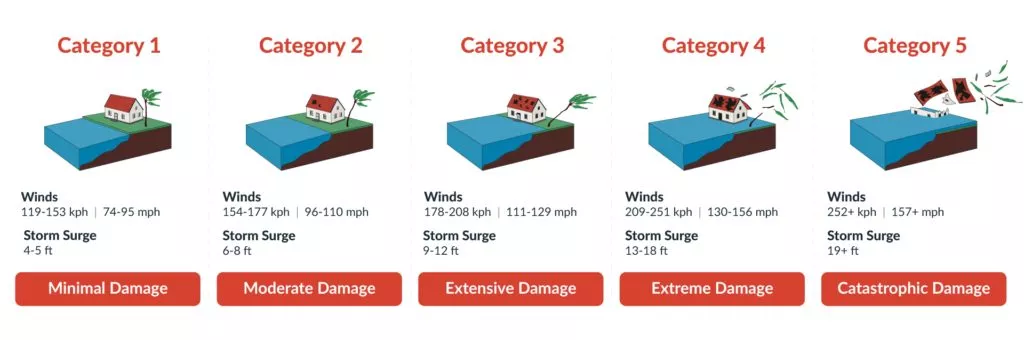
1.4 Categories of hurricane intensity
Hurricanes are classified into five categories based on their maximum sustained wind speeds, using the Saffir-Simpson Hurricane Wind Scale:
- Category 1: 74-95 mph (119-153 km/h)
- Category 2: 96-110 mph (154-177 km/h)
- Category 3: 111-129 mph (178-208 km/h)
- Category 4: 130-156 mph (209-251 km/h)
- Category 5: 157 mph (252 km/h) or higher
It is important to note that the Saffir-Simpson scale only measures wind speed and does not account for the potential damage caused by storm surge, rainfall, or other factors. Lower-category hurricanes can still cause significant damage and loss of life, particularly due to flooding and storm surge.
Part 2: Data Collection and Analysis
2.1 Observing and measuring hurricanes
To accurately forecast hurricanes, scientists rely on various data collection methods to observe and measure the storms’ characteristics and the surrounding environment. The main tools used for this purpose are:
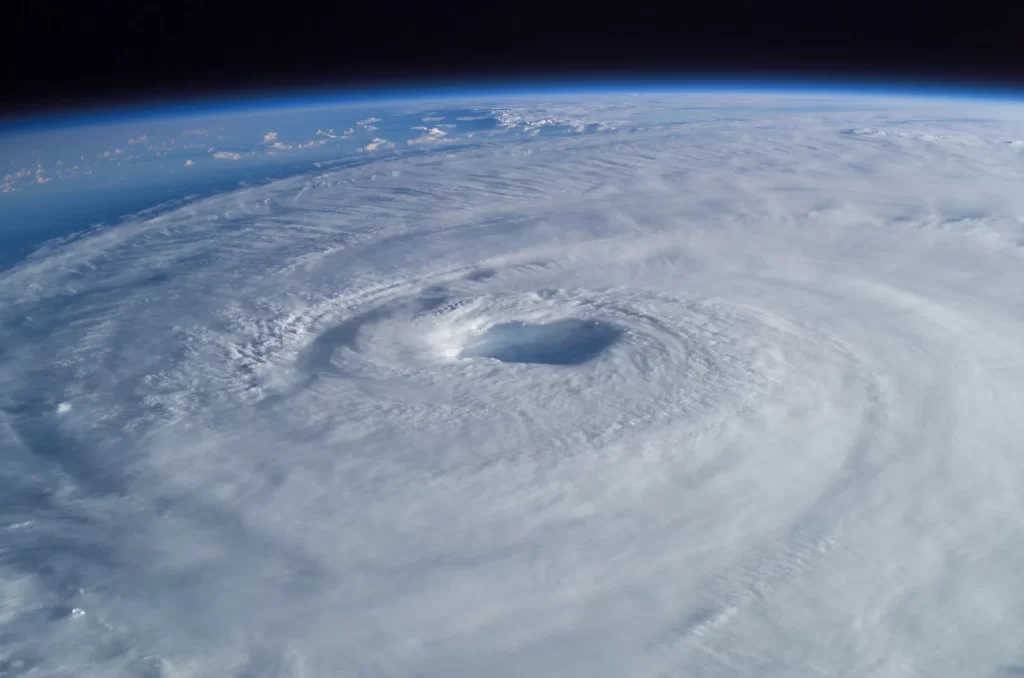
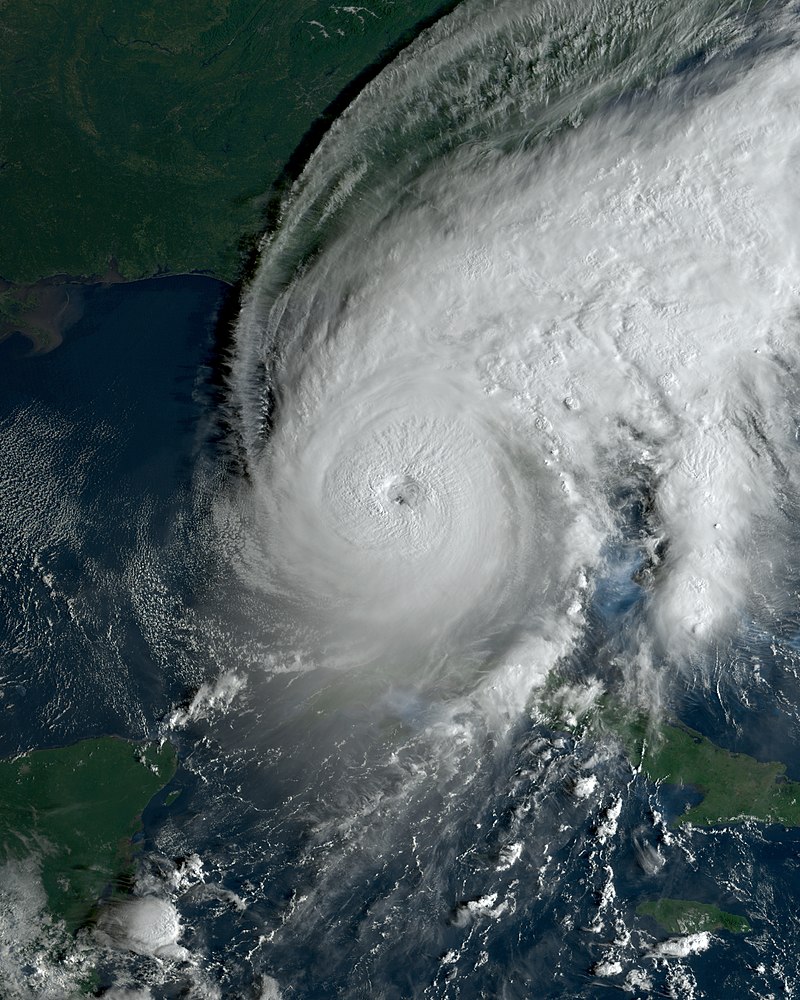
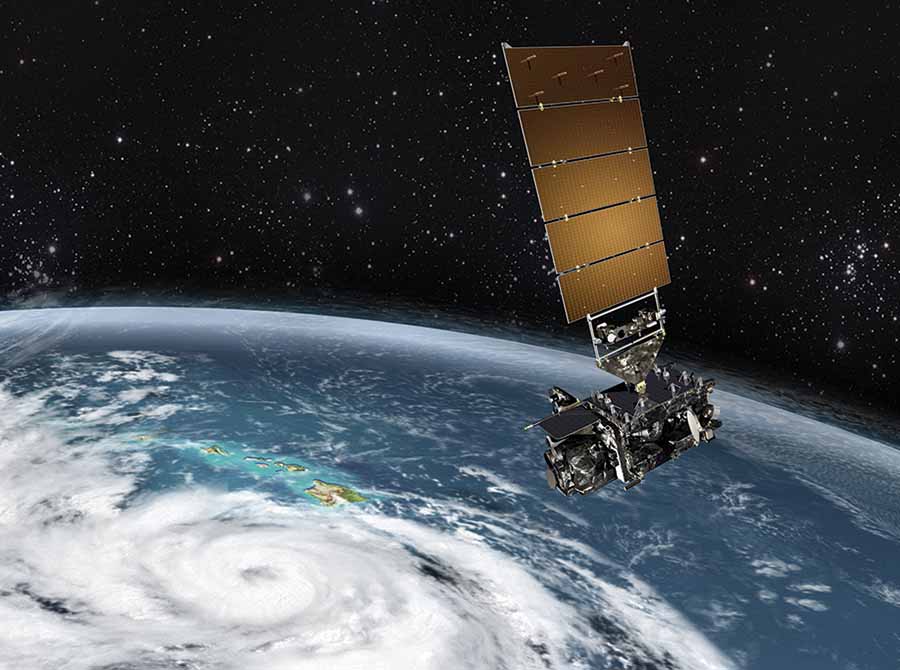
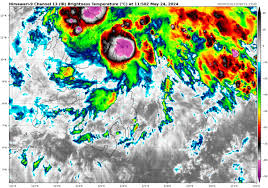
2.1.1 Satellite imagery
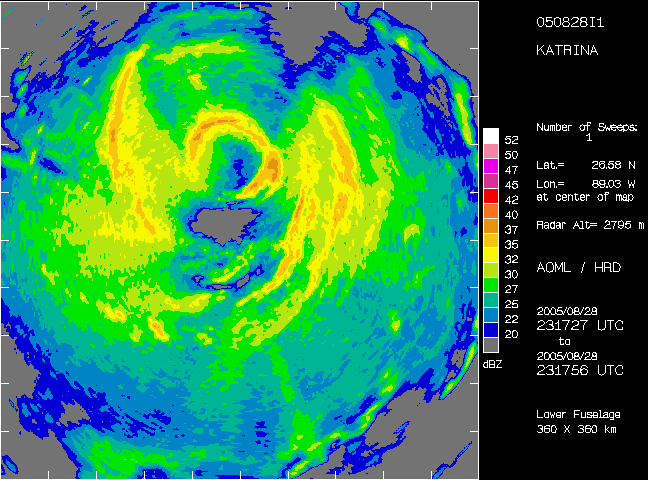
Satellites provide a comprehensive view of hurricanes from space, allowing forecasters to monitor their development, track their movement, and estimate their intensity. Visible and infrared satellite images help identify the storm’s structure, size, and cloud patterns. Microwave imagery can penetrate through clouds, providing information about the storm’s internal structure and rainfall rates.

2.1.2 Aircraft reconnaissance
Specially equipped aircraft, such as the U.S. Air Force Reserve’s Hurricane Hunters, fly directly into hurricanes to collect valuable data. These aircraft measure wind speed, air pressure, temperature, and humidity at various altitudes within and around the storm. They also deploy instruments called dropsondes, which measure atmospheric conditions as they descend to the ocean surface.
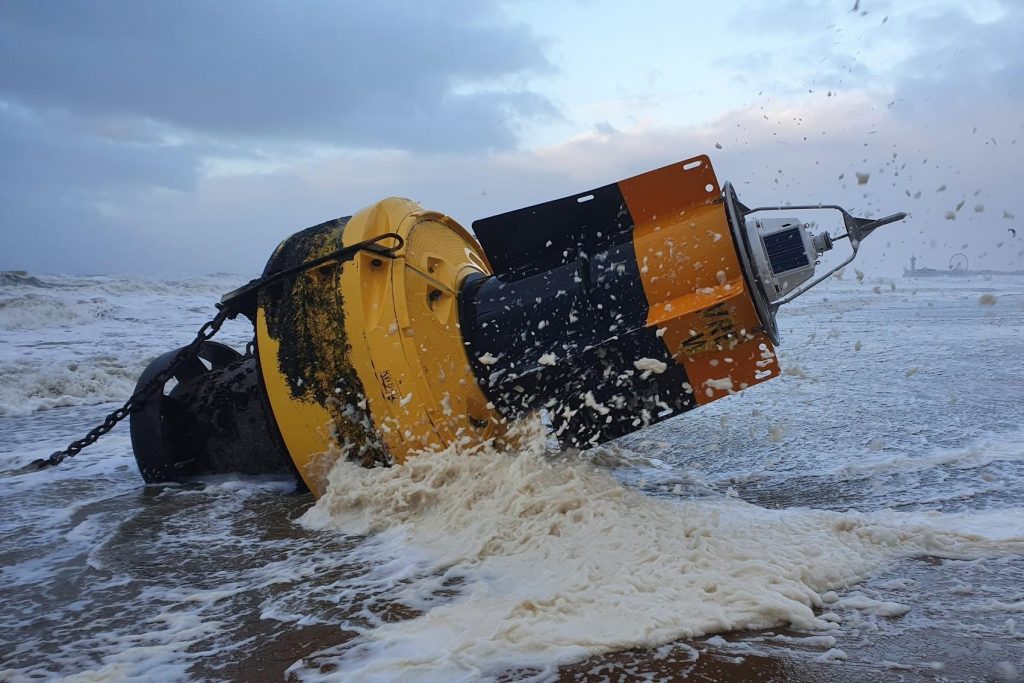
2.1.3 Buoys and weather stations
Buoys and weather stations in the ocean and on land provide essential data about surface conditions, such as wind speed, air pressure, and sea surface temperature. These measurements help forecasters understand the storm’s interaction with its environment and assess its potential for intensification.

2.2 Analyzing atmospheric and oceanic conditions
In addition to directly observing hurricanes, forecasters analyze various atmospheric and oceanic conditions that influence hurricane development and behavior. Some of the key factors considered are:
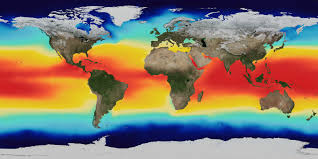
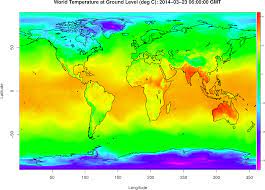
2.2.1 Sea surface temperature
Warm ocean water, typically above 26.5°C (79.7°F), is essential for hurricane formation and intensification. Forecasters monitor sea surface temperatures using satellite data and buoy measurements to identify areas that are conducive to hurricane development.

2.2.2 Wind shear
Wind shear refers to the change in wind speed or direction with height in the atmosphere. High wind shear can disrupt the vertical structure of a hurricane, causing it to weaken or dissipate. Forecasters assess wind shear using satellite data, weather balloon observations, and numerical weather models.

2.2.3 Atmospheric pressure
Hurricanes are characterized by low air pressure at their center. Forecasters monitor changes in atmospheric pressure using barometers on buoys, ships, and land-based weather stations. A rapid drop in pressure often indicates that a storm is intensifying.
2.3 Historical data and trends
Analyzing historical hurricane data and trends is crucial for improving our understanding of these storms and refining forecasting techniques. Scientists study past hurricane seasons, landfall locations, intensities, and tracks to identify patterns and relationships with atmospheric and oceanic conditions. This information helps forecasters develop statistical models and analog forecasts based on similar historical situations. Additionally, examining long-term trends in hurricane activity can provide insights into the potential impacts of climate change on hurricane frequency and intensity.
By collecting and analyzing a wide range of data from multiple sources, forecasters can build a comprehensive picture of a hurricane’s current state and its likely future behavior. This information forms the foundation for the development and application of forecasting models and techniques, which will be discussed in the next part of this guide.
Part 3: Forecasting Models and Techniques
Forecasting hurricanes involves using various models and techniques to predict the track, intensity, and potential impacts of these storms. Meteorologists and researchers rely on a combination of statistical and dynamical models to generate forecasts.
3.1 Statistical models
Statistical models, also known as statistical-dynamical models, use historical data on past hurricanes and their relationships with environmental variables to predict the behavior of current storms. These models consider factors such as sea surface temperature, atmospheric pressure, and wind shear to estimate the likelihood of hurricane formation, intensification, and movement. Some examples of statistical models include:
a. Statistical Hurricane Intensity Prediction Scheme (SHIPS)
b. Logistic Growth Equation Model (LGEM)
c. Rapid Intensification Index (RII)
Statistical models are generally less computationally intensive than dynamical models and can provide quick guidance on hurricane behavior. However, they may not capture the full complexity of hurricane dynamics and can be limited by the quality and quantity of historical data.
3.2 Dynamical models
Dynamical models, also called numerical weather prediction models, use mathematical equations to simulate the physical processes that govern hurricane formation and evolution. These models divide the atmosphere and ocean into grid cells and solve equations that describe the motion of air and water, as well as the transfer of heat and moisture. Dynamical models can be further categorized into two types:

3.2.1 Global models
Global models simulate the entire Earth’s atmosphere and oceans, providing a comprehensive view of the large-scale environmental conditions that influence hurricane behavior. Some examples of global models include:
a. Global Forecast System (GFS)
b. European Centre for Medium-Range Weather Forecasts (ECMWF)
c. Navy Global Environmental Model (NAVGEM)
Global models have a relatively coarse spatial resolution, typically ranging from 10 to 50 kilometers between grid points. They are useful for identifying large-scale patterns and long-term trends but may not capture the finer details of hurricane structure and intensity.
3.2.2 Regional models
Regional models, also known as limited-area models or mesoscale models, focus on a specific region of interest and provide higher-resolution simulations of hurricane behavior. These models use boundary conditions from global models but can resolve smaller-scale features such as hurricane eye structure and rainbands. Some examples of regional models include:
a. Hurricane Weather Research and Forecasting (HWRF) Model
b. Hurricanes in a Multi-scale Ocean-coupled Non-hydrostatic (HMON) Model
c. Advanced Hurricane WRF (AHW) Model
Regional models typically have a spatial resolution of 1 to 10 kilometers, allowing for more detailed predictions of hurricane track, intensity, and structure. However, they are computationally expensive and may have shorter lead times compared to global models.
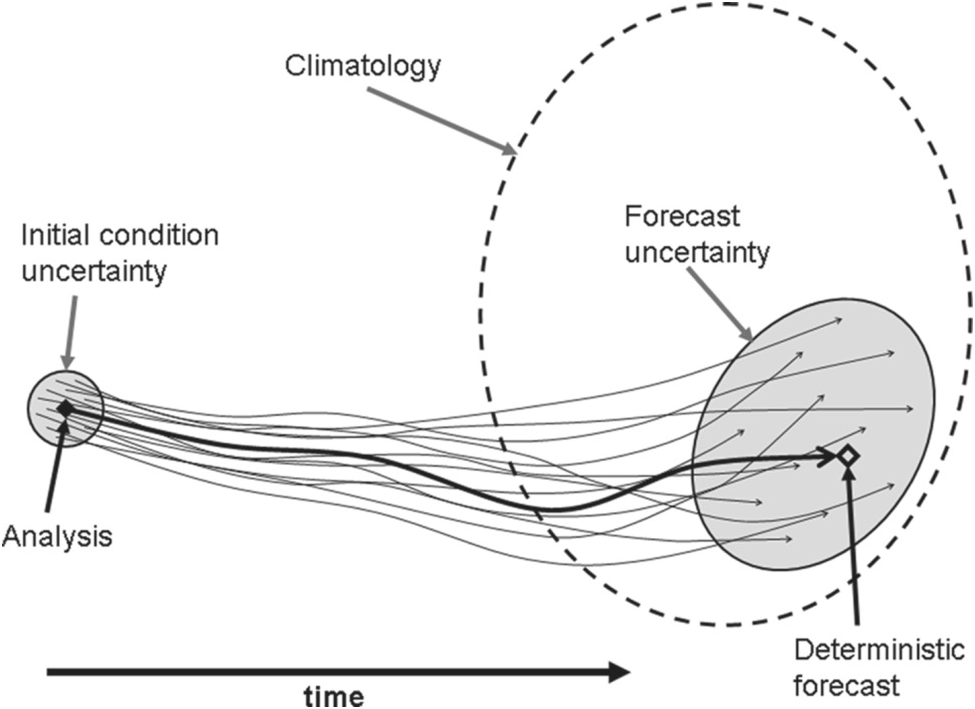
3.3 Ensemble forecasting
Ensemble forecasting involves running multiple simulations of a hurricane using slightly different initial conditions, model physics, or model types. By generating a range of possible outcomes, ensemble forecasting helps quantify the uncertainty in hurricane predictions and provides probabilistic guidance on hurricane track, intensity, and impacts. Ensemble forecasting can be applied to both statistical and dynamical models.

3.4 Interpreting model output
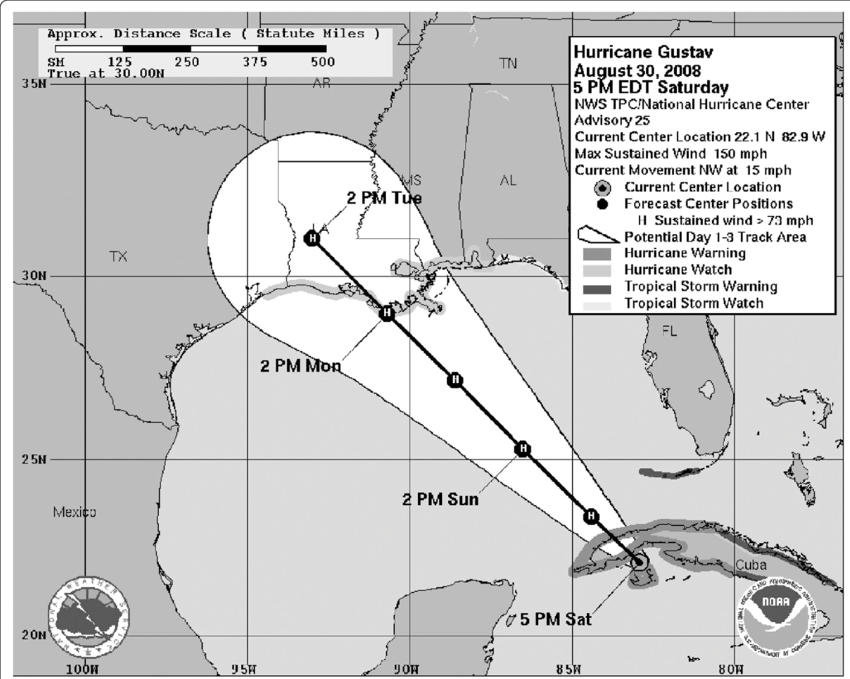
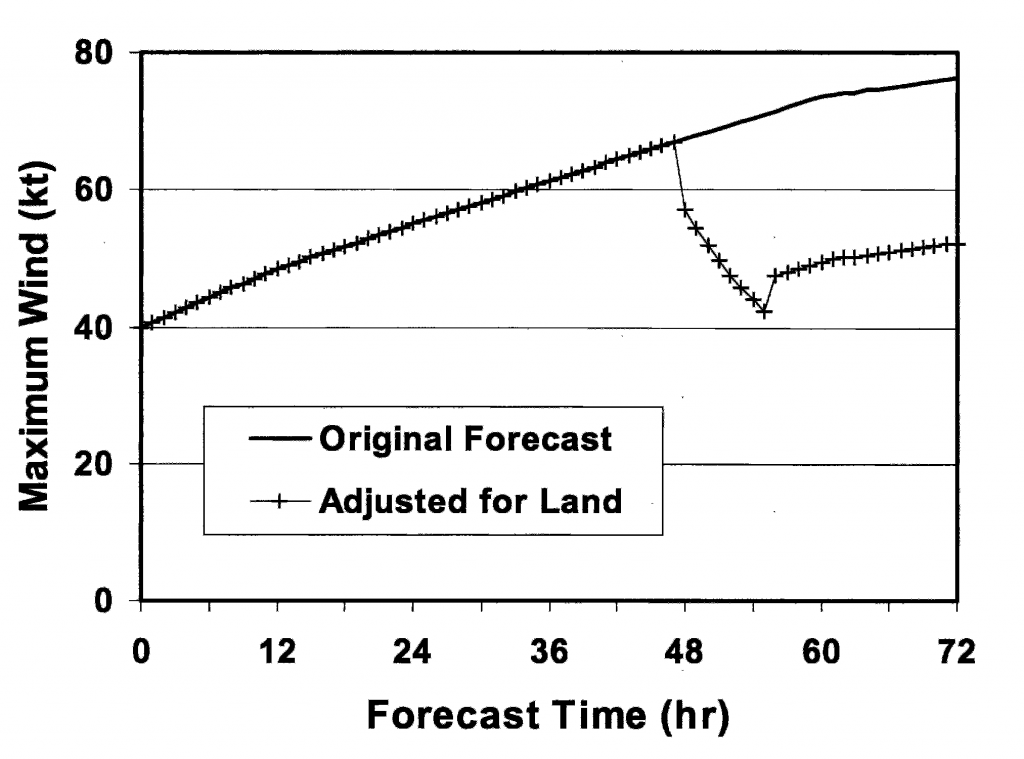
Interpreting the output from hurricane forecasting models requires expertise in meteorology and an understanding of the strengths and limitations of each model. Forecasters analyze various model outputs, such as track plots, intensity graphs, and wind field maps, to assess the likely evolution of a hurricane. They also consider the consistency between different models and the overall pattern of model predictions to generate the official forecast.
Hurricane forecasting checklist:
Sea Surface Temperature (SST):
Look for SSTs of at least 26.5°C (79.7°F) extending to a depth of about 50 meters.
Higher SSTs provide more energy for the storm to develop and intensify.
Atmospheric Instability:
Check for a moist, unstable atmosphere that allows warm air to rise easily.
Look for a deep layer of warm, humid air extending from the surface to the mid-troposphere.
Evaluate the presence of convective available potential energy (CAPE) to support thunderstorm development.
Low Wind Shear:
Analyze the vertical wind shear, which is the change in wind speed or direction with height.
Ideal conditions for hurricane development have wind shear values less than 10 knots (11.5 mph or 18.5 km/h) between the lower and upper troposphere.
High wind shear can disrupt the storm’s circulation and prevent it from intensifying.
Moisture Content:
Assess the presence of a moist environment, particularly in the mid-troposphere (around 5 km or 3 miles altitude).
High relative humidity (greater than 70%) in this layer is conducive to hurricane development.
Pre-existing Disturbance:
Identify any pre-existing disturbances, such as tropical waves, low-pressure systems, or remnants of previous storms.
These disturbances can act as seed areas for hurricane development if other conditions are favorable.
Official resources:
NOAA GOES Image Viewer: https://www.star.nesdis.noaa.gov/GOES/index.php
NASA GOES Satellite Imagery: https://www.nasa.gov/mission_pages/goes/main/index.html
CIRA GOES Imagery: http://rammb.cira.colostate.edu/ramsdis/online/goes-16.asp
Observations:
NOAA National Data Buoy Center: https://www.ndbc.noaa.gov/
NOAA Aircraft Operations Center: https://www.omao.noaa.gov/learn/aircraft-operations
NOAA Hurricane Hunters: https://www.aoml.noaa.gov/hrd/about_hrd/HRD-P3_program.html
Forecasting:
NOAA National Hurricane Center: https://www.nhc.noaa.gov/
NOAA Environmental Modeling Center: https://www.emc.ncep.noaa.gov/
NOAA Hurricane Weather Research and Forecasting (HWRF) Model: https://www.emc.ncep.noaa.gov/gc_wmb/vxt/HWRF/
Advisories:
NOAA National Hurricane Center Advisories: https://www.nhc.noaa.gov/cyclones/
NOAA National Weather Service: https://www.weather.gov/
FEMA (Federal Emergency Management Agency): https://www.fema.gov/
Flood Maps:
FEMA Flood Map Service Center: https://msc.fema.gov/portal/home
NOAA National Hurricane Center Storm Surge Inundation Maps: https://www.nhc.noaa.gov/surge/inundation/
USGS (United States Geological Survey) Flood Event Viewer: https://stn.wim.usgs.gov/FEV/
Forecast model links:
1. Tropical Tidbits: https://www.tropicaltidbits.com/ – Provides a wide range of model data, satellite imagery, and analysis tools
2. Mike’s Weather Page: https://spaghettimodels.com/ – Offers a collection of spaghetti models, forecast discussions, and other tools
3. Crown Weather Services: https://crownweather.com/ – Includes detailed forecast discussions, model data, and a focus on the Atlantic basin
4. Cyclocane: https://www.cyclocane.com/ – Features an interactive map with various model tracks and satellite imagery
5. Hurricane Track: https://hurricanetrack.com/ – Provides a mix of professional analysis, model data, and user-friendly explanations
6. Severe Weather Europe: https://www.severe-weather.eu/tropical-weather/ – Covers tropical weather worldwide, with a focus on European interests
7. Force Thirteen: https://www.force-13.com/ – Offers live coverage, model analysis, and a community-driven approach to hurricane tracking
8. Instant Weather Maps: https://www.instantweathermaps.com/ – Provides a variety of weather maps, including tropical cyclone data and model outputs
9. Windy: https://www.windy.com/ – An interactive weather visualization platform with various forecast models and hurricane tracking features
10. NOAA’s Atlantic Oceanographic and Meteorological Laboratory (AOML): https://www.aoml.noaa.gov/hrd/graphics_sub_pages/models.html – While part of an official agency, AOML provides a comprehensive collection of model data and graphics