The Future of Weather Forecasting: How AI is Revolutionizing Meteorology

One of the key ways AI is being used in weather forecasting is through machine learning algorithms. These algorithms can analyze vast amounts of historical weather data, including temperature, humidity, wind speed, and precipitation, to identify patterns and make predictions about future weather events. By continuously learning from new data, these algorithms can improve their accuracy over time, leading to more reliable forecasts.

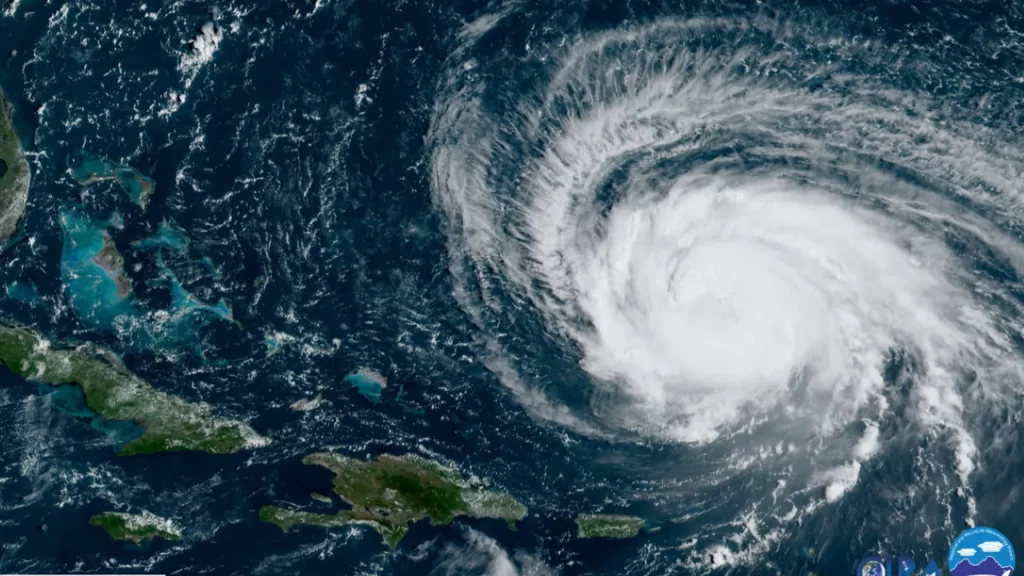
Another area where AI is making a significant impact is in the interpretation of weather satellite imagery. Traditional methods of analyzing satellite data can be time-consuming and prone to human error. However, AI-powered systems can quickly and accurately identify weather patterns and anomalies in satellite images, providing meteorologists with valuable insights into developing weather systems.

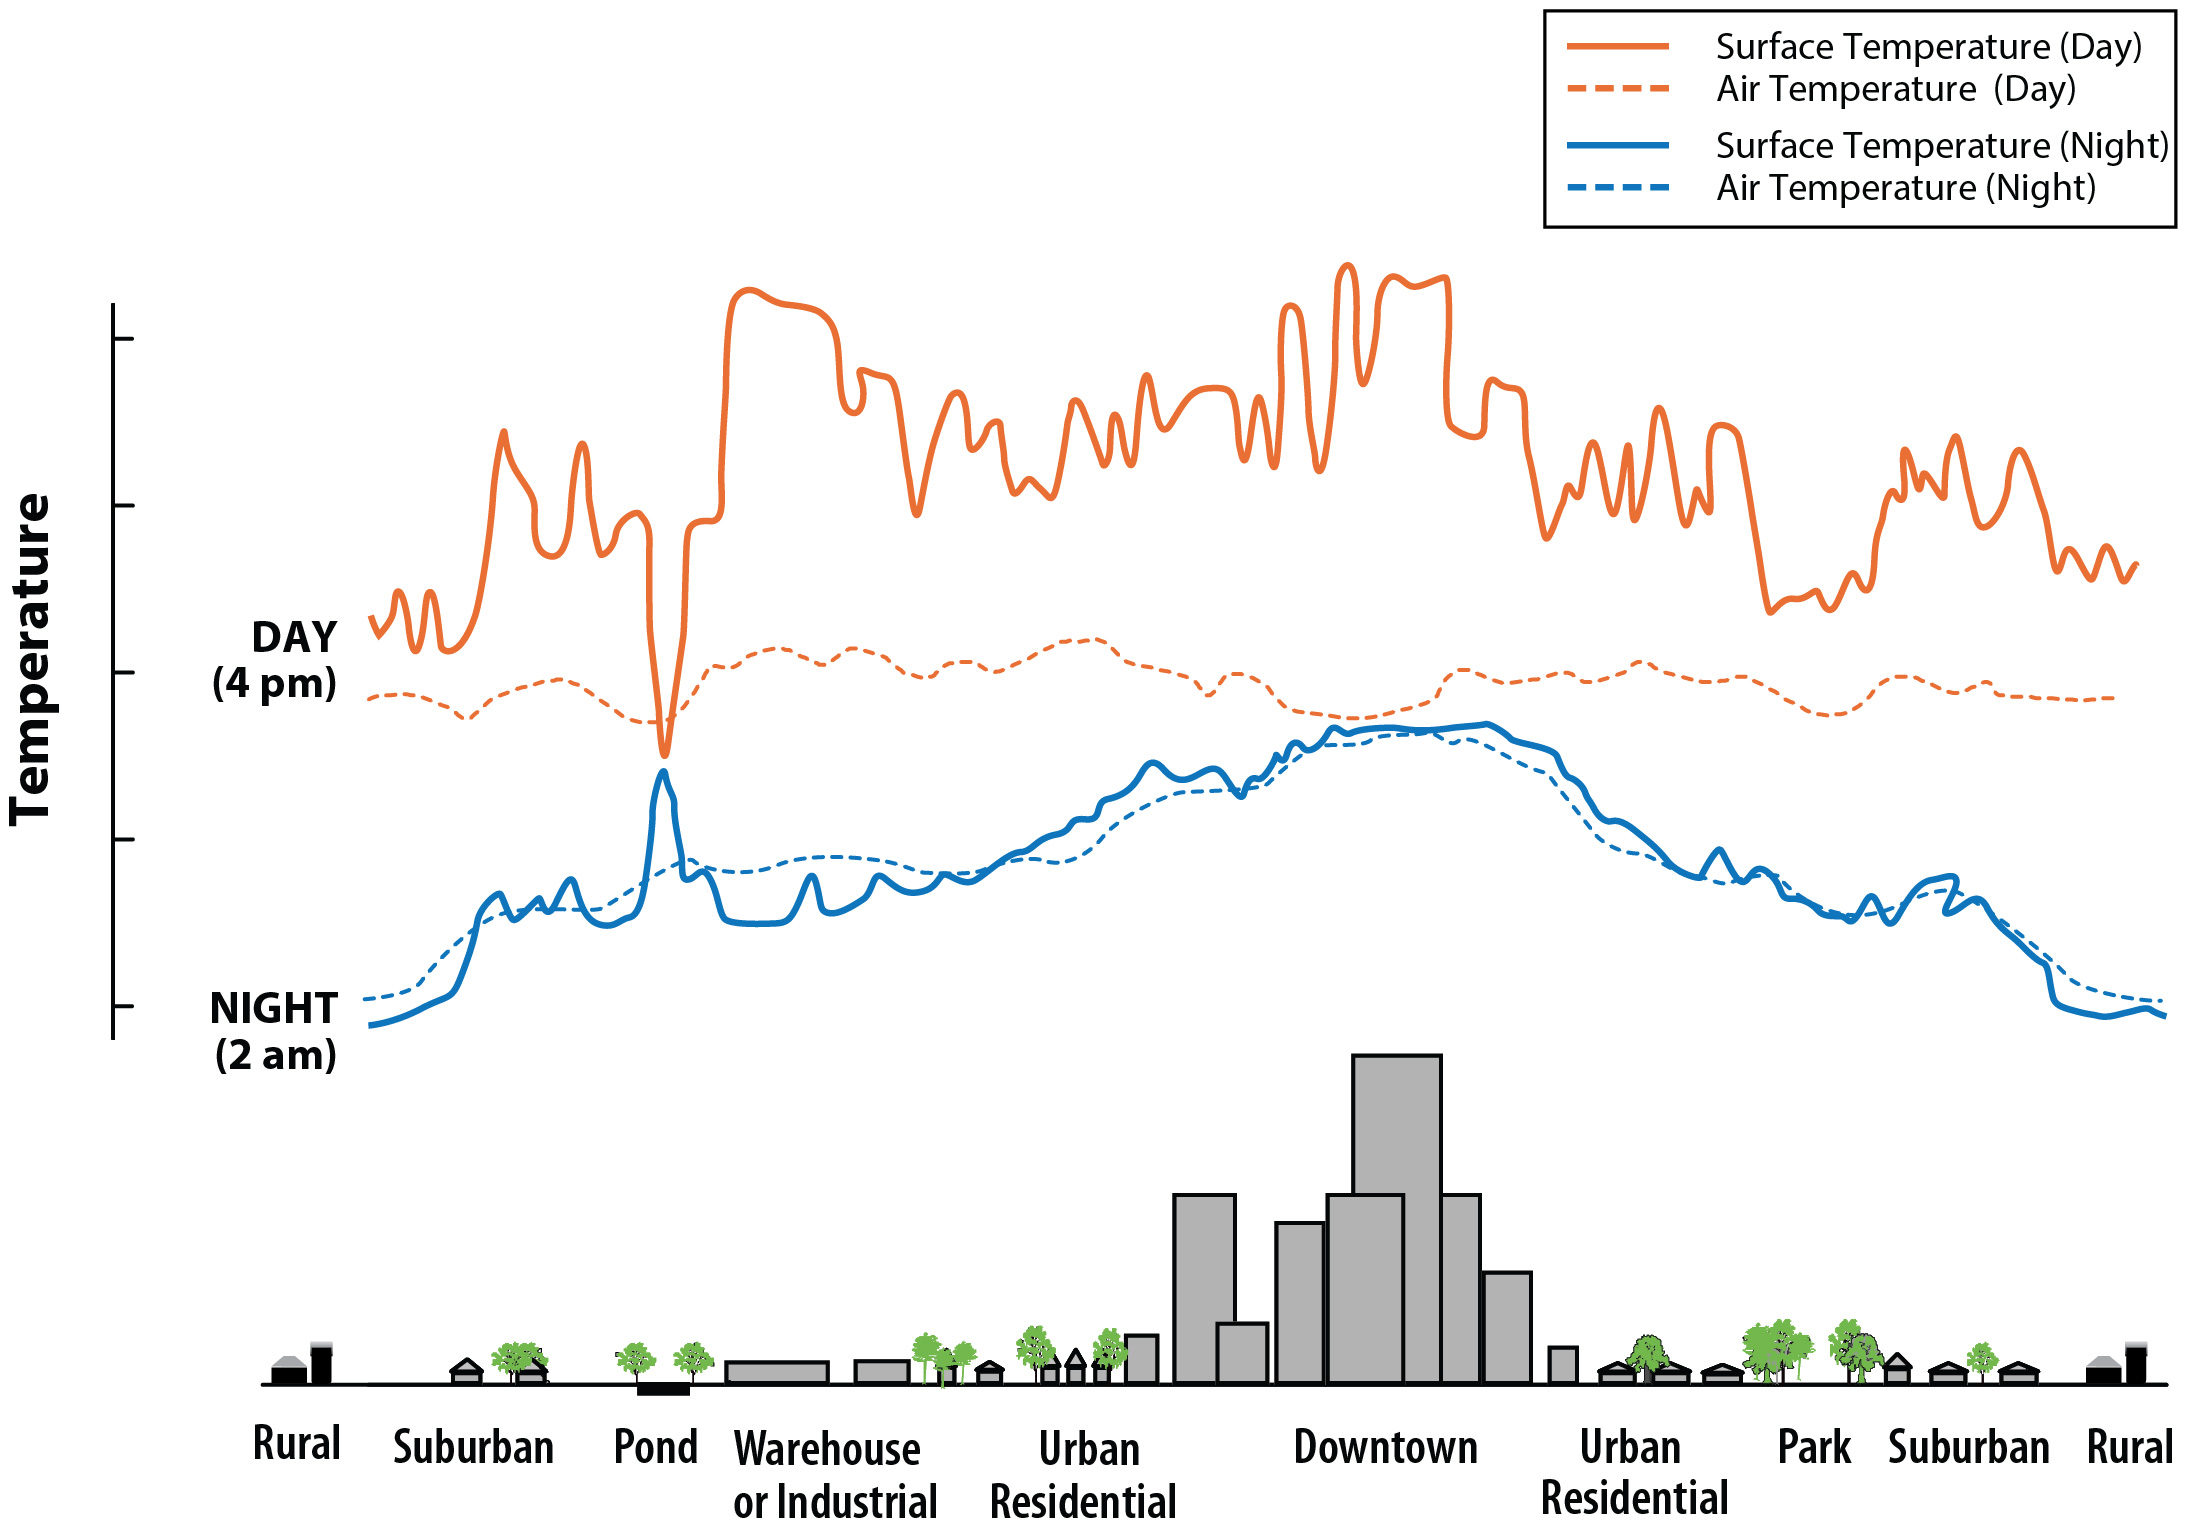
AI is also being used to improve the resolution and accuracy of weather models. By incorporating machine learning techniques, researchers can create more detailed and precise models that can simulate weather conditions down to the neighborhood level. This level of granularity can be particularly useful for predicting the impact of severe weather events, such as hurricanes and tornadoes, on specific communities.

In addition to improving the accuracy of weather forecasts, AI is also helping to make them more accessible and user-friendly. Many weather apps and websites now use AI-powered chatbots and virtual assistants to provide personalized weather information and alerts based on a user’s location and preferences. This can help individuals and businesses make more informed decisions about their daily activities and operations.

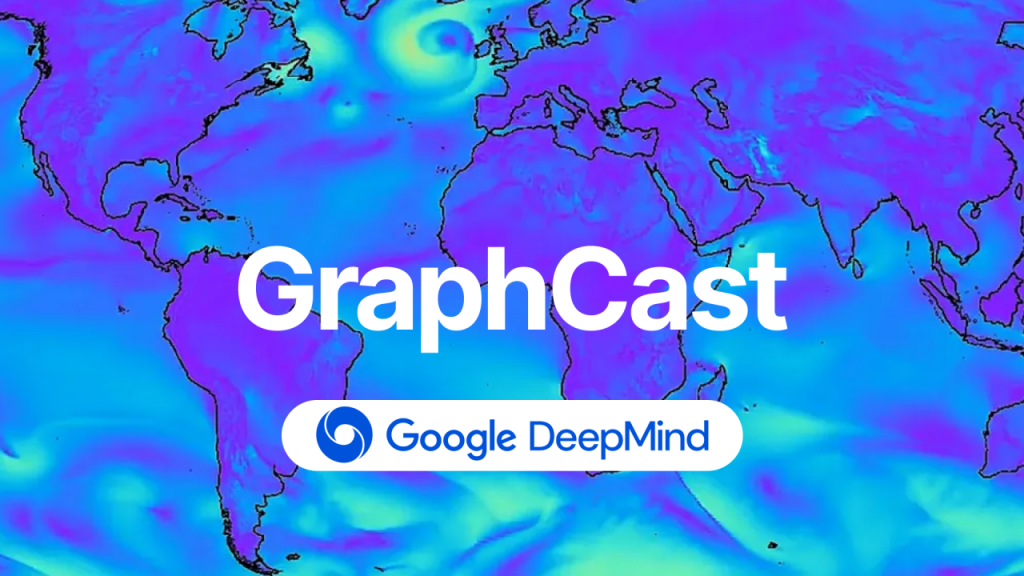
Title: The Future Potential of AI in Weather Forecasting: Building on Google’s GraphCast

Google’s GraphCast represents a significant advancement in the field of weather forecasting, utilizing artificial intelligence (AI) and Graph Neural Networks (GNNs) to deliver highly accurate 10-day weather predictions in a fraction of the time required by traditional methods. This groundbreaking technology not only improves the accuracy and efficiency of weather forecasts but also demonstrates the potential for AI to revolutionize the field of meteorology.

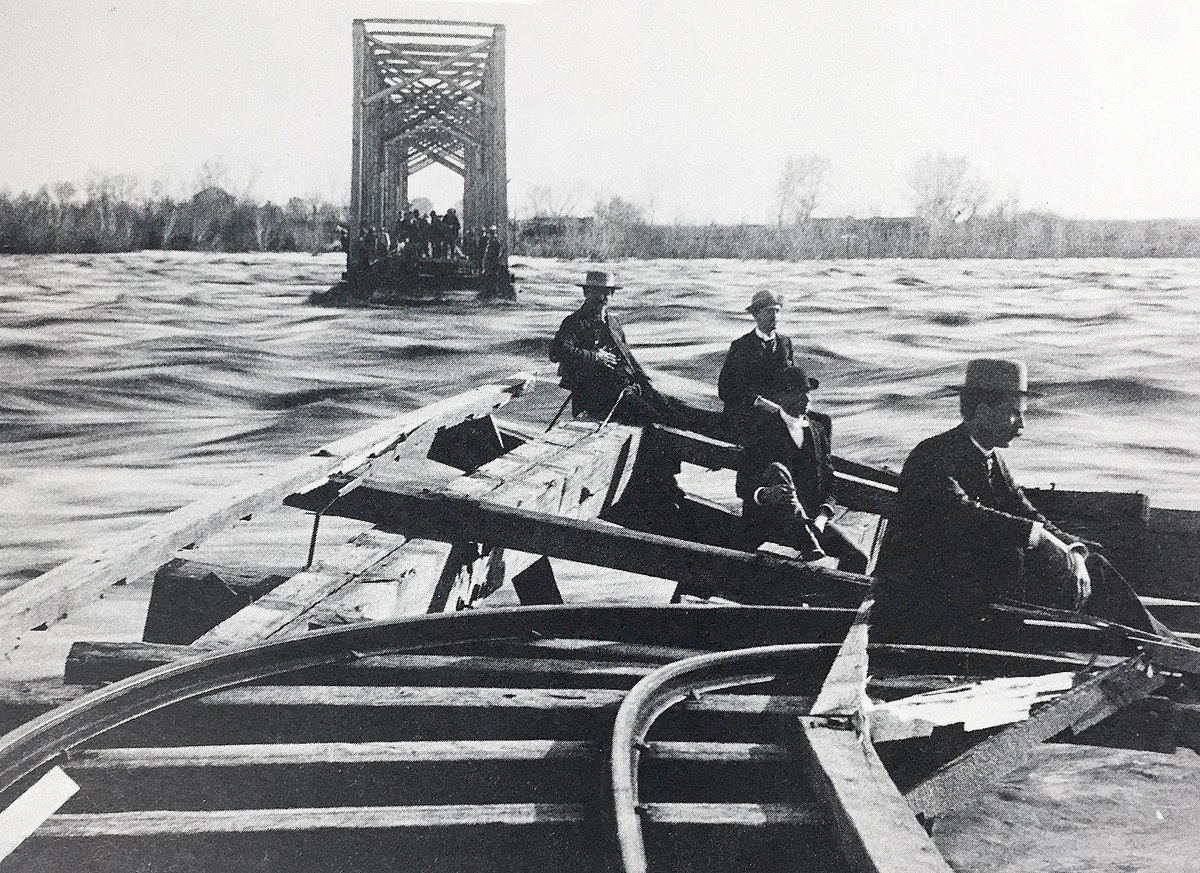
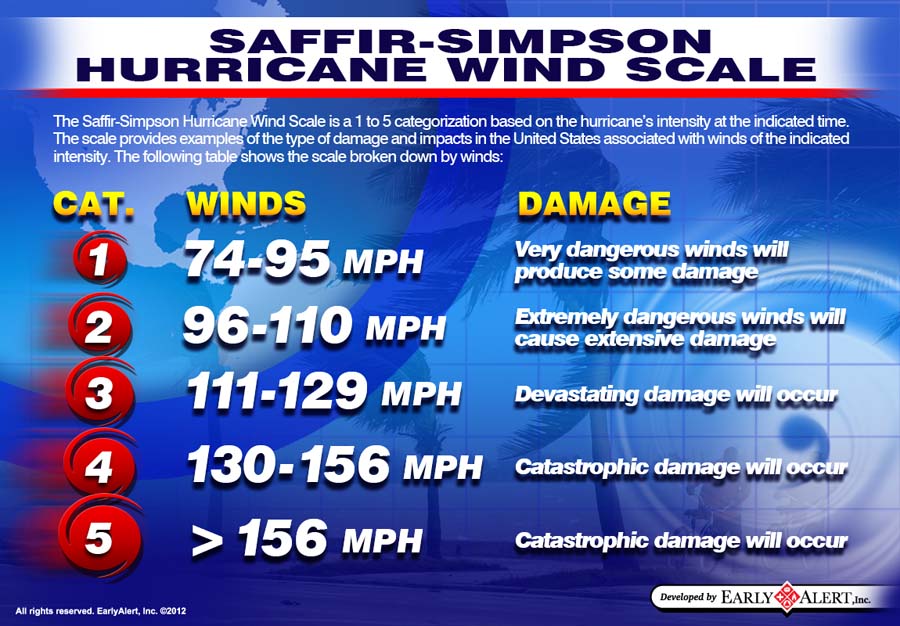
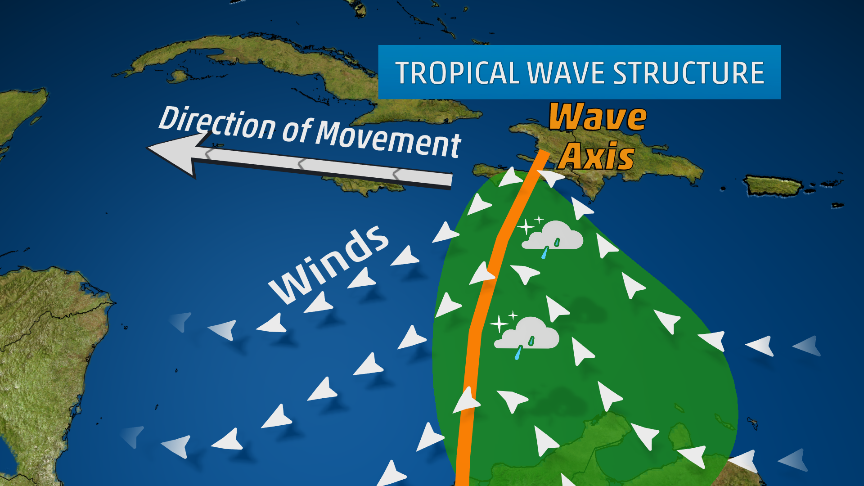
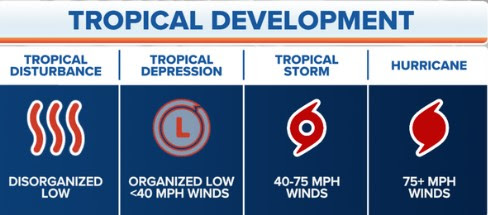
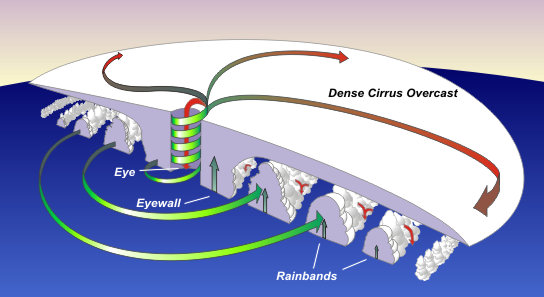
One of the most promising aspects of GraphCast is its ability to identify and predict extreme weather events, such as cyclones, atmospheric rivers, and heat waves, with greater accuracy and lead time than traditional forecasting models. This early warning capability could prove invaluable in saving lives and minimizing the impact of severe weather on communities. As AI continues to advance, it is likely that models like GraphCast will become even more adept at detecting and predicting these extreme events, allowing for better preparedness and response.

Looking to the future, the potential applications of AI in weather forecasting are vast. By building upon the foundation laid by GraphCast, researchers and meteorologists could develop even more sophisticated models that incorporate additional data sources, such as satellite imagery, radar, and weather station observations. These enhanced models could provide even greater accuracy and granularity in weather predictions, allowing for more localized and personalized forecasts. Additionally, AI could be used to develop long-term climate models, helping scientists better understand and predict the impacts of climate change on weather patterns and extreme events. As the world continues to grapple with the challenges posed by a changing climate, the insights provided by AI-powered weather and climate models will become increasingly critical in informing policy decisions and guiding adaptation and mitigation efforts.

Despite the many benefits of AI in weather forecasting, there are also some challenges and limitations to consider. One concern is the potential for AI systems to perpetuate biases or errors in historical weather data, leading to inaccurate predictions. Another challenge is the need for large amounts of high-quality data to train and validate AI models, which can be difficult and expensive to obtain.

Despite these challenges, the future of weather forecasting looks bright thanks to the continued advancement of AI technologies. As more data becomes available and AI algorithms become more sophisticated, we can expect to see even more accurate and detailed weather forecasts in the years to come. This will not only help us better prepare for and respond to severe weather events but also enable us to make more informed decisions about everything from agriculture to transportation to energy production.

Arizona’s Monsoon Season: A Dramatic Dance of Dust, Wind and Lightning

For Arizonans, the word “monsoon” evokes a sense of excitement and anticipation. Far from the relentless downpours associated with monsoons in other parts of the world, Arizona’s monsoon season is a unique period of dramatic weather shifts, characterized by powerful thunderstorms, dust storms (haboobs), and bursts of heavy rain.

The Science Behind the Spectacle:

Arizona’s monsoon typically runs from June 15th to September 30th. It’s driven by a shift in wind patterns. During the summer, the intense heating of the land creates a low-pressure zone over the southwestern United States. This draws in moist air from the Gulf of California and the Pacific Ocean, setting the stage for the monsoon’s dramatic displays.

The Haboob: A Wall of Dust

One of the most iconic features of the Arizona monsoon is the haboob, a massive wall of dust that can rise thousands of feet into the air. These impressive, yet intimidating, formations are created when strong thunderstorm downdrafts pick up loose desert soil, creating a rolling wave of dust that can engulf entire cities. While visually stunning, haboobs can significantly reduce visibility, posing hazards for drivers and those with respiratory issues.

Arizona’s monsoon storms can generate intense downdrafts, known as microbursts or downbursts. These sudden bursts of wind can reach speeds of over 100 mph, causing significant damage and posing a hazard to aviation. Microbursts are often associated with lightning activity, as the downdrafts are triggered by the cooling effect of rain and melting hail within the thunderstorm.

Thunderstorms and Flash Floods:

The influx of moist air fuels the development of towering cumulonimbus clouds, leading to localized thunderstorms. These storms can bring intense bursts of rain, lightning, and even hail. While the rain is often welcome in the arid landscape, the intensity can quickly overwhelm the desert terrain, leading to flash floods in washes, canyons, and urban areas.

Benefits and Challenges:

The monsoon plays a crucial role in Arizona’s ecosystem. The rainfall replenishes reservoirs, nourishes vegetation, and provides relief from the scorching summer heat. However, the intense storms can also cause damage to property, disrupt travel, and pose safety risks.

The Great Flood of 1891:

One of the most catastrophic monsoon events in Arizona’s history occurred in February 1891. An unusually intense winter storm brought torrential rainfall to the Salt River Valley, causing the Salt River to overflow its banks. The resulting floodwaters inundated Phoenix and surrounding areas, destroying homes, businesses, and infrastructure. The event highlighted the vulnerability of desert communities to flash flooding and prompted the construction of dams and flood control systems.

The Labor Day Storm of 1970:

On Labor Day weekend in 1970, a powerful monsoon storm unleashed its fury on central Arizona. The storm dumped record rainfall, causing widespread flash floods and significant damage. The Mogollon Rim region was particularly hard hit, with floodwaters carving new canyons and leaving a lasting impact on the landscape. This event served as a stark reminder of the destructive force of flash floods, especially in mountainous areas.

July 1990: A severe microburst struck Phoenix, causing widespread damage and downing hundreds of power lines. Wind speeds were estimated to reach 100 mph.

Hurricane Nora Remnants (1997):

While Arizona is far from hurricane alley, the remnants of tropical storms can occasionally bring heavy rainfall to the state. In 1997, the remnants of Hurricane Nora tracked across Arizona, causing widespread flooding and damage. Yuma experienced record rainfall, leading to significant flooding along the Gila River. This event highlighted the potential for tropical storms to impact Arizona’s monsoon season.

The 2014 Scottsdale Haboob:

A massive dust storm, or haboob, engulfed Scottsdale and surrounding areas in July 2014. The towering wall of dust, estimated to be over 5,000 feet tall, reduced visibility to near zero and caused widespread power outages. The event showcased the dramatic impact of haboobs on urban areas and served as a reminder of the importance of dust storm safety measures.

Preparing for the Monsoon:

Arizonans are accustomed to living with the monsoon’s unpredictable nature. It’s essential to stay informed about weather forecasts, be aware of potential hazards, and take precautions such as:

  • Staying indoors during dust storms and heavy rain.
  • Avoiding low-lying areas prone to flash floods.
  • Securing loose objects around your property.
  • Having an emergency kit prepared.

How Hurricanes Form: The Genesis of a Cyclone

The birth of a hurricane is a fascinating process, often starting from inconspicuous beginnings that evolve into powerful storms capable of wreaking havoc. Let’s delve into the early stages of hurricane development, where seemingly innocuous atmospheric disturbances transform into organized systems with the potential for destruction.

Tropical Wave: The Seed of a Storm

The journey often begins with a tropical wave, an elongated area of low pressure that originates over the warm waters of the tropics, often off the west coast of Africa. These waves, propelled by easterly trade winds, travel westward across the Atlantic Ocean, carrying showers and thunderstorms within their midst. While most tropical waves dissipate harmlessly, some possess the ingredients necessary to evolve into something more ominous.

  • Warm Ocean Waters: Hurricanes draw their energy from warm ocean waters, typically with surface temperatures of at least 80°F (26.5°C). This heat provides the fuel for the storm’s development and intensification.
  • Coriolis Effect: The Earth’s rotation creates a force known as the Coriolis effect, which causes winds to deflect to the right in the Northern Hemisphere and to the left in the Southern Hemisphere. This deflection plays a crucial role in the cyclonic rotation of hurricanes.
  • Low Vertical Wind Shear: Vertical wind shear refers to the change in wind speed and direction with height. Low wind shear allows the storm to develop and maintain its vertical structure, while high wind shear can disrupt the storm’s organization.
  • Pre-existing Disturbance: A pre-existing weather disturbance, such as a tropical wave or a cluster of thunderstorms, provides the initial seed for hurricane formation.

Evolution from Disturbance to Depression:

If a tropical wave encounters these favorable conditions, it can begin to organize and intensify. As thunderstorms cluster around the area of low pressure, a tropical disturbance forms. If the circulation becomes more defined and wind speeds reach up to 38 mph (62 kph), it is classified as a tropical depression.

The Critical Transition to Tropical Storm:

The transition from a tropical depression to a tropical storm marks a significant step in the storm’s development. As the wind speeds increase to 39-73 mph (63-118 kph), the storm becomes more organized and develops a distinct cyclonic circulation. At this stage, it receives a name and is officially recognized as a tropical storm, posing a potential threat to land areas within its path.

Stages of Hurricane Development:

  1. Tropical Disturbance: A cluster of thunderstorms with a weak circulation forms over warm ocean waters.
  2. Tropical Depression: The circulation becomes more organized, and wind speeds reach up to 38 mph (62 kph).
  3. Tropical Storm: Wind speeds increase to 39-73 mph (63-118 kph), and the storm receives a name.
  4. Hurricane: Wind speeds reach 74 mph (119 kph) or higher, and the storm exhibits a well-defined eye surrounded by a ring of intense thunderstorms known as the eyewall.

Eye and Eyewall Dynamics:

The eye of the hurricane is a relatively calm area of low pressure surrounded by the eyewall, the region of highest winds and heaviest rainfall. Air rises rapidly in the eyewall, releasing latent heat and fueling the storm’s intensity. The eye forms as a result of the balance between the inward-flowing air and the upward-rising air in the eyewall.

Factors Influencing Intensity:

Several factors influence hurricane intensity, including:

  • Sea surface temperatures: Warmer waters provide more energy for the storm to intensify.
  • Ocean heat content: The depth of warm water also plays a role, as deeper warm layers provide more sustained energy for the hurricane.
  • Atmospheric moisture: Higher moisture content in the atmosphere can fuel stronger thunderstorms and contribute to intensification.
  • Upper-level atmospheric conditions: Favorable upper-level winds can help vent the storm and promote further intensification.

Understanding Hurricane Categories and Associated Damage

Hurricane categories, based on the Saffir-Simpson Hurricane Wind Scale, classify these storms based on their maximum sustained wind speeds and the potential damage they can inflict. This scale helps communicate the severity of a hurricane and guide preparedness efforts.

Category 1 (74-95 mph):

  • Damage: Primarily to trees and foliage, with some damage to roofs, siding, and unanchored mobile homes. Power outages are likely.
  • Historical Examples: Hurricane Gaston (2004), Hurricane Humberto (2019)

Category 2 (96-110 mph):

  • Damage: Extensive damage to trees and foliage, with significant damage to roofs, siding, and mobile homes. Power outages can last for days or weeks.
  • Historical Examples: Hurricane Frances (2004), Hurricane Zeta (2020)

Category 3 (111-129 mph):

  • Damage: Devastating damage to trees and foliage, with major damage to roofs, siding, and mobile homes. Structural damage to small buildings is possible. Power and water outages can last for extended periods.
  • Historical Examples: Hurricane Katrina (2005), Hurricane Irma (2017)

Category 4 (130-156 mph):

  • Damage: Catastrophic damage to trees and foliage, with severe damage to well-built homes. Roofs can be completely torn off, and exterior walls can collapse. Power outages can last for weeks or even months. Extensive coastal flooding and inland flooding are expected.
  • Historical Examples: Hurricane Harvey (2017), Hurricane Maria (2017)

Category 5 (157 mph or higher):

  • Damage: The most catastrophic damage, with complete roof failure and wall collapse on many residential and industrial buildings. Most trees will be snapped or uprooted. Power outages can last for months, and areas may be uninhabitable for extended periods.
  • Historical Examples: Hurricane Andrew (1992), Hurricane Michael (2018)

Understanding El Niño and La Niña: Impacts on  Global Weather Patterns

El Niño and La Niña, naturally occurring climate patterns originating in the tropical Pacific Ocean, have far-reaching effects on weather patterns worldwide. These phenomena, collectively known as the El Niño-Southern Oscillation (ENSO), influence temperature, precipitation, and atmospheric circulation, leading to a cascade of impacts on ecosystems, agriculture, and human societies.

The Science Behind ENSO:

Under normal conditions, trade winds blow westward across the tropical Pacific, pushing warm surface waters towards Indonesia and Australia. This allows cooler water to upwell along the coast of South America. However, during El Niño events, these trade winds weaken or even reverse, causing warm water to spread eastward towards the central and eastern Pacific. Conversely, during La Niña, trade winds strengthen, intensifying the upwelling of cool water in the eastern Pacific and pushing warm water westward.

Impacts of El Niño:

  • Warmer Global Temperatures: El Niño events are typically associated with a rise in global average temperatures, as the release of heat from the tropical Pacific warms the atmosphere.
  • Altered Precipitation Patterns: El Niño can cause increased rainfall in the southern United States and parts of South America, while leading to drier conditions in Indonesia, Australia, and Southeast Asia.
  • Increased Hurricane Activity: The warmer waters in the central and eastern Pacific during El Niño can fuel hurricane formation in the eastern Pacific basin and reduce hurricane activity in the Atlantic basin.

Predicting and Monitoring ENSO:

Impacts of La Niña:

  • Cooler Global Temperatures: La Niña events tend to have a cooling effect on global temperatures, as the upwelling of cool water in the eastern Pacific influences atmospheric circulation.
  • Droughts and Floods: La Niña can exacerbate drought conditions in the southwestern United States and South America, while leading to increased rainfall and flooding in Australia, Indonesia, and Southeast Asia.
  • Active Hurricane Seasons: La Niña often corresponds with increased hurricane activity in the Atlantic basin due to reduced wind shear and favorable atmospheric conditions.

Scientists use a variety of tools, including sea surface temperature measurements, satellite observations, and computer models, to monitor and predict El Niño and La Niña events. While ENSO is a natural cycle, understanding and predicting its phases is crucial for preparing for potential impacts on agriculture, water resources, and disaster management.

Impacts on Society and the Environment:

El Niño and La Niña can have significant socioeconomic and environmental consequences. Droughts and floods can impact agricultural yields, leading to food insecurity and economic losses. Changes in ocean temperatures can disrupt marine ecosystems, affecting fish populations and coastal communities.

Specific Examples of El Niño and La Niña Impacts on Countries:

El Niño Impacts:

  • Peru and Ecuador: El Niño can bring heavy rainfall and flooding to these coastal nations, causing landslides, infrastructure damage, and disruptions to fishing industries due to warmer ocean temperatures. The 1997-98 El Niño event led to devastating floods and economic losses in both countries.
  • Indonesia and Australia: El Niño often results in drier conditions and increased risk of wildfires in these regions. The 2015-16 El Niño contributed to severe droughts and widespread forest fires in Indonesia, causing significant air pollution and economic damage.
  • Southern United States: El Niño can lead to wetter winters in California and the southern US, alleviating drought conditions but also increasing the risk of flooding and mudslides.

La Niña Impacts:

  • East Africa (Kenya, Somalia, Ethiopia): La Niña typically exacerbates drought conditions in East Africa, leading to crop failures, food insecurity, and water scarcity. The 2010-11 La Niña event contributed to a severe famine in Somalia.
  • Australia: La Niña often brings above-average rainfall and increased flooding to eastern Australia. The 2010-11 La Niña event resulted in widespread flooding in Queensland, causing significant damage to infrastructure and agriculture.
  • Southeast Asia (Thailand, Vietnam, Philippines): La Niña can lead to increased rainfall and flooding in Southeast Asia, impacting rice production and increasing the risk of landslides and other natural disasters.

El Niño’s Influence:

  • Hurricanes: El Niño typically suppresses hurricane activity in the Atlantic basin. The increased wind shear in the upper atmosphere during El Niño disrupts the formation and intensification of hurricanes. This means fewer hurricanes make landfall along the US East Coast and Gulf Coast during El Niño years.
  • Tornadoes: The relationship between El Niño and tornadoes in the US is complex and varies regionally. Some studies suggest El Niño can lead to increased tornado activity in the Gulf Coast states during winter and spring, while potentially reducing tornado occurrences in the Great Plains during spring.

La Niña’s Influence:

  • Hurricanes: La Niña often creates favorable conditions for hurricane development in the Atlantic basin. The reduced wind shear and warmer sea surface temperatures provide the necessary ingredients for hurricane formation and intensification. This can lead to more frequent and stronger hurricanes impacting the US East Coast and Gulf Coast during La Niña years.
  • Tornadoes: La Niña can influence tornado activity in the US, particularly in the spring months. The stronger jet stream and increased wind shear associated with La Niña can create a more conducive environment for tornado formation in the Great Plains and Midwest.

The Urban Heat Island Effect: How Cities Influence Local Weather

Cities, with their sprawling concrete landscapes and minimal vegetation, create unique microclimates known as urban heat islands (UHIs). This phenomenon describes the significantly warmer temperatures experienced within urban areas compared to surrounding rural environments. The temperature difference can range from a few degrees to a staggering 22°F (12°C) warmer at night, impacting not only comfort but also energy consumption, air quality, and public health.

Causes of the Urban Heat Island Effect:

  • Reduced Albedo: Dark surfaces like asphalt and concrete absorb more solar radiation than reflective surfaces like vegetation and water, leading to higher surface temperatures.
  • Lack of Evapotranspiration: Plants release water vapor through transpiration, which cools the surrounding air. Urban areas with limited vegetation lack this natural cooling mechanism.
  • Waste Heat Generation: Vehicles, air conditioners, and industrial activities release heat into the urban environment, further elevating temperatures.
  • Building Geometry: Tall buildings and narrow streets create canyons that trap heat and limit air circulation.

Consequences of Urban Heat Islands:

  • Increased Energy Consumption: Higher temperatures lead to greater demand for air conditioning, raising energy consumption and greenhouse gas emissions.
  • Air Quality Impacts: UHIs can exacerbate air pollution by trapping pollutants and promoting the formation of smog. This can lead to respiratory problems and other health issues.
  • Heat-Related Illness: Elevated temperatures increase the risk of heatstroke, heat exhaustion, and other heat-related illnesses, particularly for vulnerable populations like the elderly and young children.
  • Water Quality Impacts: Warmer stormwater runoff can negatively impact aquatic ecosystems by lowering oxygen levels and increasing pollutant concentrations.

Mitigating the Urban Heat Island Effect:

  • Increasing Urban Green Spaces: Planting trees and vegetation can provide shade, promote evapotranspiration, and lower surface temperatures.
  • Cool Roofs and Pavements: Using reflective materials for roofs and pavements can increase albedo and reduce heat absorption.
  • Green Infrastructure: Implementing green roofs, rain gardens, and other green infrastructure elements can manage stormwater runoff and reduce the UHI effect.
  • Urban Design Strategies: Optimizing building placement and street orientation can improve air circulation and reduce heat trapping.
  • New York City: Studies have shown that nighttime temperatures in New York City can be up to 22°F (12°C) warmer than surrounding rural areas due to the UHI effect. This has significant impacts on energy consumption and public health, especially during heatwaves.
  • Phoenix, Arizona: Phoenix experiences one of the most intense UHI effects in the United States. The vast expanse of asphalt and concrete, combined with the desert climate, leads to extreme heat during the day and limited nighttime cooling.
  • Tokyo, Japan: Tokyo has implemented various strategies to mitigate the UHI effect, such as planting trees, installing green roofs, and promoting reflective pavements. These efforts have resulted in measurable reductions in urban temperatures.