As a hurricane expert, I have studied countless storms that have formed over the years, each with its unique characteristics and impacts. While most hurricanes follow a relatively predictable pattern, there have been a few that stand out as particularly unusual or bizarre. In this article, we will explore some of the weirdest hurricanes of all time, using only factual information.
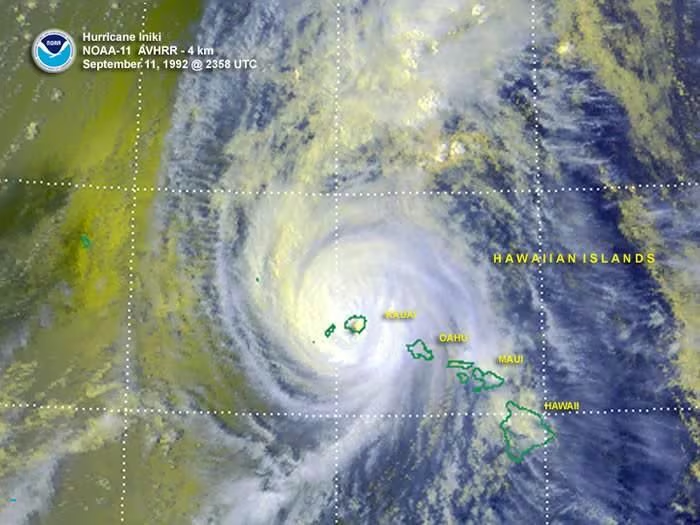
1.Hurricane Iniki (1992) – The “Jurassic Park” Hurricane
Hurricane Iniki was a powerful Category 4 storm that struck the Hawaiian island of Kauai in September 1992. What made this hurricane particularly strange was its timing. Iniki hit during the filming of the movie “Jurassic Park,” which was taking place on the island. The cast and crew had to be evacuated, and the storm caused significant damage to the film sets. Director Steven Spielberg even incorporated footage of the hurricane’s aftermath into the movie.
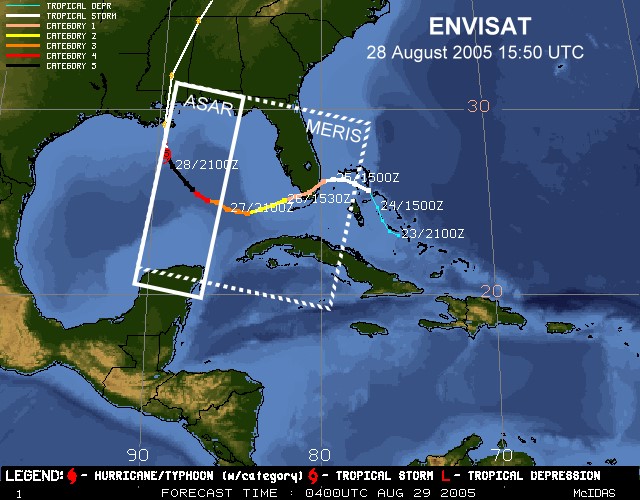
2. Hurricane Katrina (2005) – The Storm That Changed Course
Hurricane Katrina is infamous for the devastation it caused in New Orleans and along the Gulf Coast. However, what many people don’t know is that Katrina took a highly unusual path. The storm initially made landfall in Florida as a Category 1 hurricane before entering the Gulf of Mexico. It then rapidly intensified into a Category 5 storm and made a second landfall in Louisiana. This double landfall and rapid intensification were highly unusual and caught many people off guard.
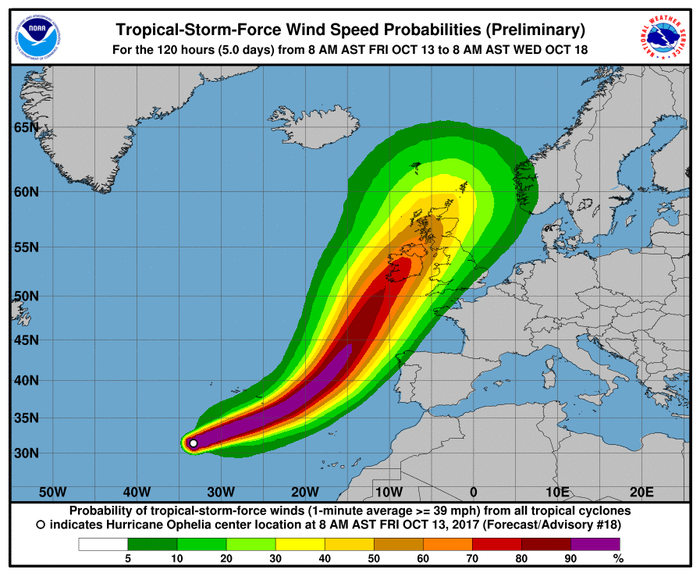
3. Hurricane Ophelia (2017) – The Hurricane That Reached Europe
Hurricane Ophelia was a rare storm that formed in the eastern Atlantic Ocean in October 2017. What made Ophelia particularly strange was its track. The storm moved northeastward, away from the United States, and eventually reached Europe as a powerful extratropical cyclone. Ophelia brought strong winds and heavy rain to Ireland and the United Kingdom, causing widespread damage and power outages. It was the easternmost Atlantic hurricane on record.
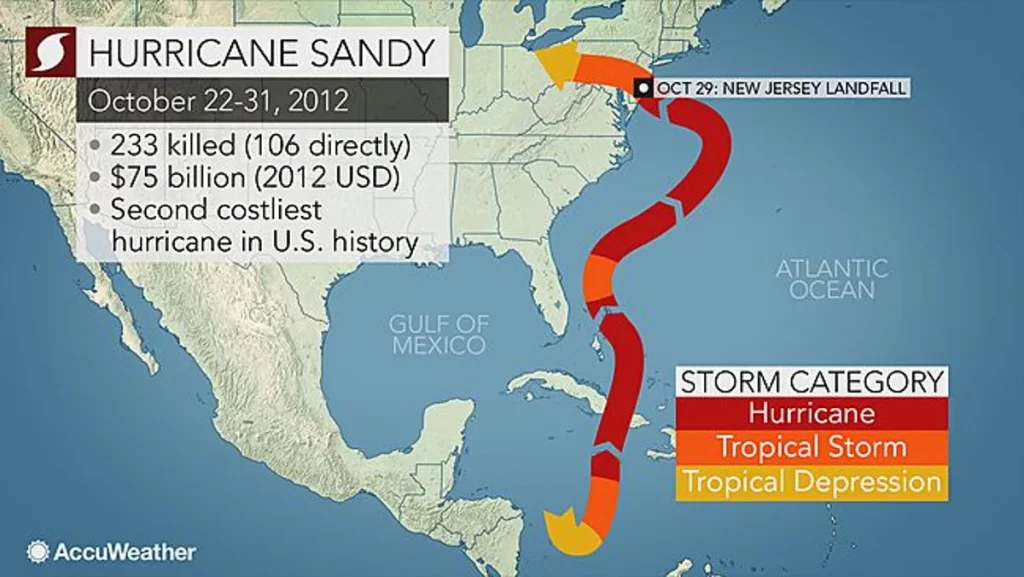
4. Hurricane Sandy (2012) – The “Superstorm”
Hurricane Sandy was a massive storm that caused significant damage along the East Coast of the United States in October 2012. What made Sandy unique was its size and structure. The storm was a hybrid of a hurricane and a nor’easter, with a diameter of over 1,000 miles. Sandy’s unusual structure allowed it to maintain its strength as it moved northward, eventually making landfall in New Jersey as a post-tropical cyclone. The storm’s impact was felt as far inland as the Great Lakes region.
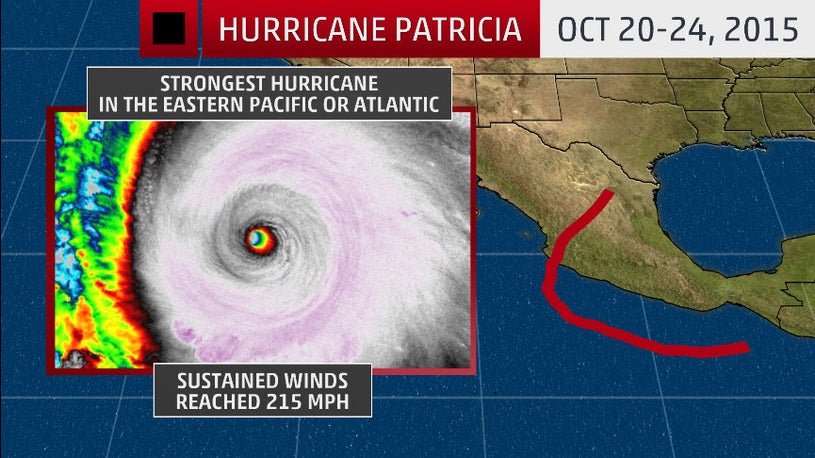
5. Hurricane Patricia (2015) – The Strongest Hurricane in the Western Hemisphere
Hurricane Patricia was a powerful storm that formed in the eastern Pacific Ocean in October 2015. What made Patricia remarkable was its rapid intensification and incredible strength. In just 24 hours, Patricia’s winds increased from 85 mph to 200 mph, making it the strongest hurricane ever recorded in the Western Hemisphere. Fortunately, Patricia weakened significantly before making landfall in Mexico, but it still caused significant damage.
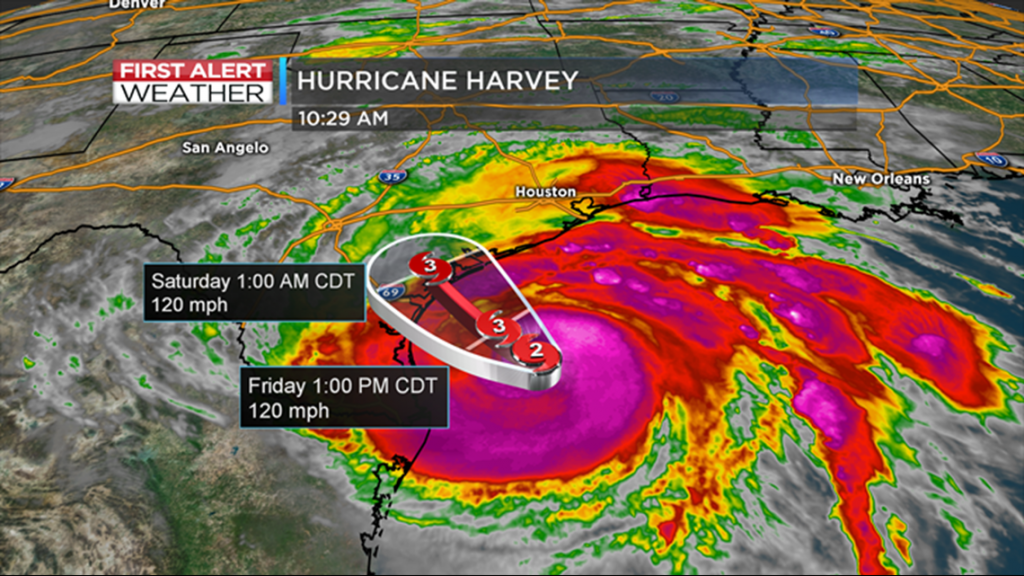
6. Hurricane Harvey (2017) – The Storm That Wouldn’t Leave
Hurricane Harvey was a slow-moving storm that caused catastrophic flooding in Texas in August 2017. What made Harvey unusual was its duration and the amount of rainfall it produced. The storm stalled over Houston for several days, dumping over 50 inches of rain in some areas. Harvey’s slow movement and the resulting flooding were highly unusual and led to one of the costliest natural disasters in U.S. history.
7. Hurricane Wilma (2005) – The Rapid Intensifier
Hurricane Wilma was a powerful storm that formed in the Caribbean Sea in October 2005. What made Wilma remarkable was the speed at which it intensified. In just 24 hours, Wilma’s winds increased from 75 mph to 185 mph, making it the most rapid intensification of a hurricane ever recorded in the Atlantic basin. Wilma went on to cause significant damage in Mexico and Florida, leaving a lasting impact on the regions it hit.
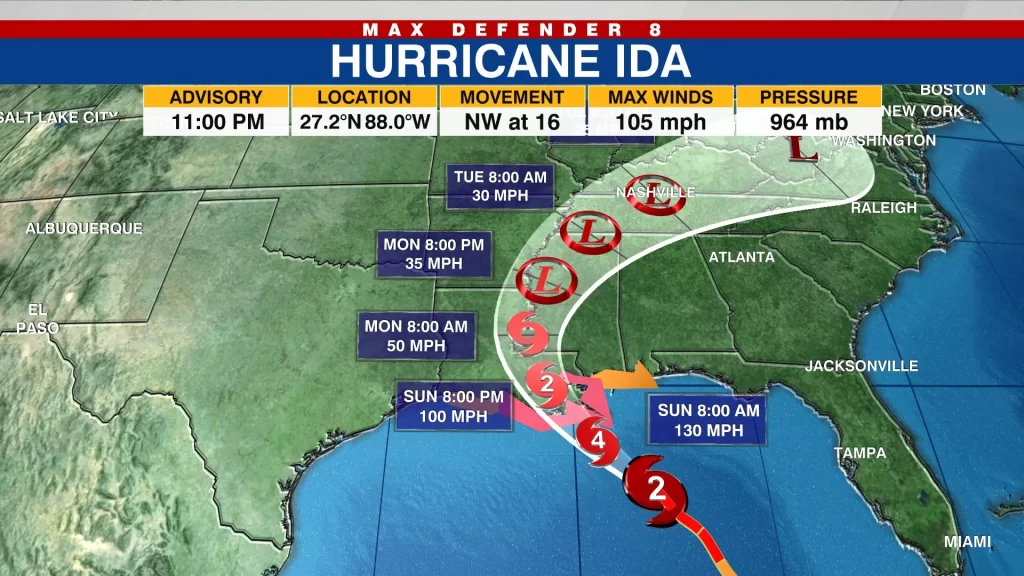
8. Hurricane Ida (2021) – The Storm That Defied Expectations
Hurricane Ida was a powerful Category 4 storm that made landfall in Louisiana in August 2021. What made Ida unusual was its rapid intensification just before landfall and its devastating impact on the Northeast United States. Despite weakening after landfall, Ida’s remnants caused catastrophic flooding and tornadoes in New Jersey, New York, and Pennsylvania, catching many residents off guard. The storm’s far-reaching effects and unusual post-landfall behavior made it a storm that defied expectations.

9. Hurricane Epsilon (2020) – The Late-Season Oddity
Hurricane Epsilon was a rare late-season storm that formed in the Atlantic Ocean in October 2020. What made Epsilon unique was its location and strength. The storm developed in an area of the Atlantic where hurricanes rarely form so late in the year and reached Category 3 intensity, making it one of the strongest late-season hurricanes on record. Epsilon’s unusual formation and strength were a reminder that hurricanes can still pose a threat even as the season winds down.
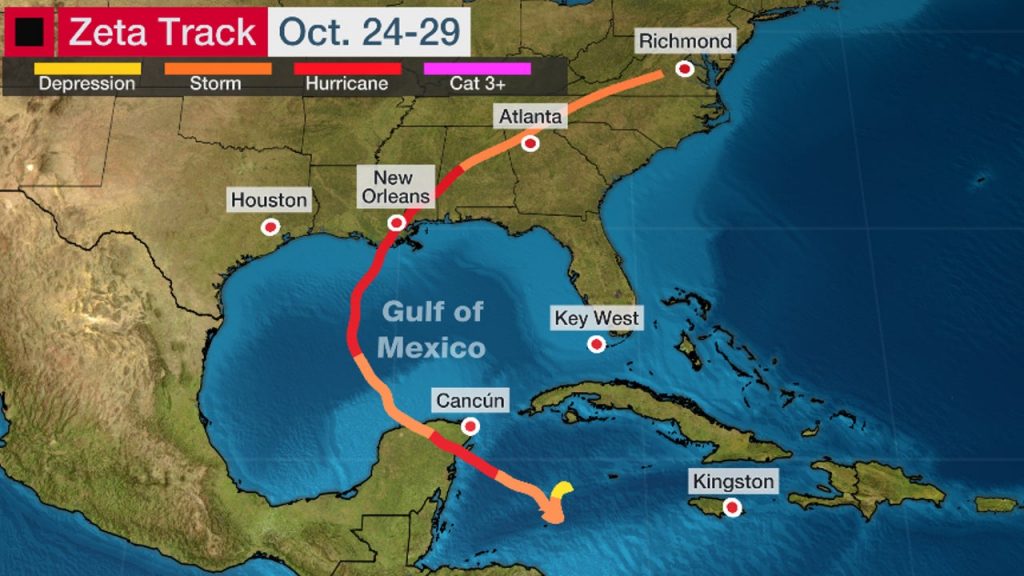
10. Hurricane Zeta (2020) – The Halloween Hurricane
Hurricane Zeta was another late-season storm that made landfall in Louisiana in October 2020. What made Zeta particularly eerie was its timing. The storm hit on October 28th, just days before Halloween, earning it the nickname “The Halloween Hurricane.” Zeta caused widespread power outages and damage across the Southeast United States, adding an extra layer of spookiness to an already unusual storm.