Hurricanes vs. Hypercanes: Could Climate Change Spawn 500 MPH Monsters?

As the Earth’s climate continues to change and global temperatures rise, scientists are grappling with the potential consequences for extreme weather events, particularly hurricanes. One alarming theory that has gained attention in recent years is the concept of “hypercanes” – hypothetical super-storms that could dwarf even the most powerful hurricanes on record. But what exactly are hypercanes, and could climate change really spawn these 500 mph monsters? In this article, we’ll take a deep dive into the science behind this controversial idea.

What are Hypercanes? The term “hypercane” was coined by Kerry Emanuel, a professor of atmospheric science at MIT, in a 1994 paper titled “The Maximum Intensity of Hurricanes.” Emanuel’s theory proposed that under certain extreme conditions, a hurricane could theoretically achieve wind speeds of up to 500 mph (800 km/h) – far beyond the most intense storms ever recorded.

These hypothetical hypercanes would require ocean temperatures of around 50°C (122°F) – about 15°C warmer than the hottest ocean temperatures ever measured in the real world. At these extreme temperatures, according to Emanuel’s models, the heat energy from the ocean would be so immense that it could drive a storm of almost unimaginable intensity.

The Science Behind the Theory: Emanuel’s hypercane theory is based on the fundamental physics of how hurricanes form and intensify. Hurricanes are essentially giant heat engines, powered by the transfer of heat from the warm ocean surface to the cooler upper atmosphere. As warm, moist air rises from the ocean, it releases latent heat as it condenses into clouds and rain. This heat warms the surrounding air, causing it to rise further and driving the storm’s circulation.

The maximum potential intensity of a hurricane is determined by the temperature difference between the ocean surface and the upper atmosphere. The greater this difference, the more energy is available to fuel the storm. In Emanuel’s hypercane scenario, the extreme ocean temperatures would create an enormous temperature differential, providing a virtually unlimited supply of energy to the storm.

Criticisms and Limitations: While the hypercane theory is grounded in basic physical principles, many experts have questioned whether such storms could actually form in the real world. There are several key limitations and criticisms of the idea:

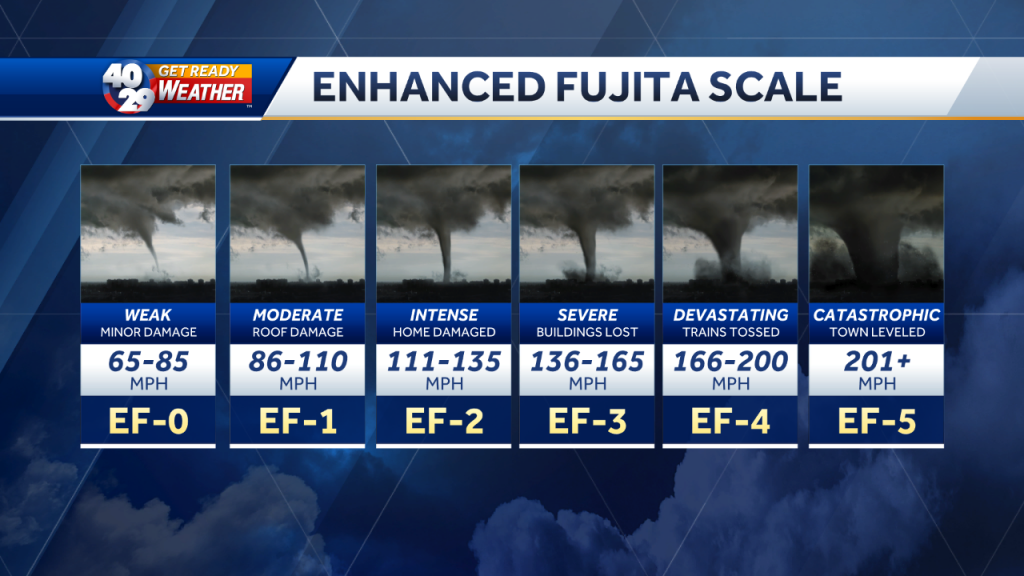
  1. Lack of real-world evidence: To date, there is no direct evidence that hypercanes have ever occurred on Earth. The most intense hurricane on record, Hurricane Patricia in 2015, had maximum sustained winds of 215 mph – less than half the theoretical wind speed of a hypercane.
  2. Ocean temperature limits: The 50°C ocean temperatures required for hypercanes are far beyond anything observed in the modern world. Even under the most extreme global warming scenarios, it’s unclear whether such temperatures are physically possible.
  3. Atmospheric constraints: Even if 50°C oceans could exist, there are questions about whether the atmosphere could actually support the extreme wind speeds of a hypercane. At such high velocities, friction and turbulence within the storm could potentially limit its intensity.
  4. Negative feedbacks: Some models suggest that hypercanes might actually be self-limiting. The extreme winds would churn up deeper, cooler water from below the surface, potentially cutting off the storm’s heat supply and causing it to weaken.

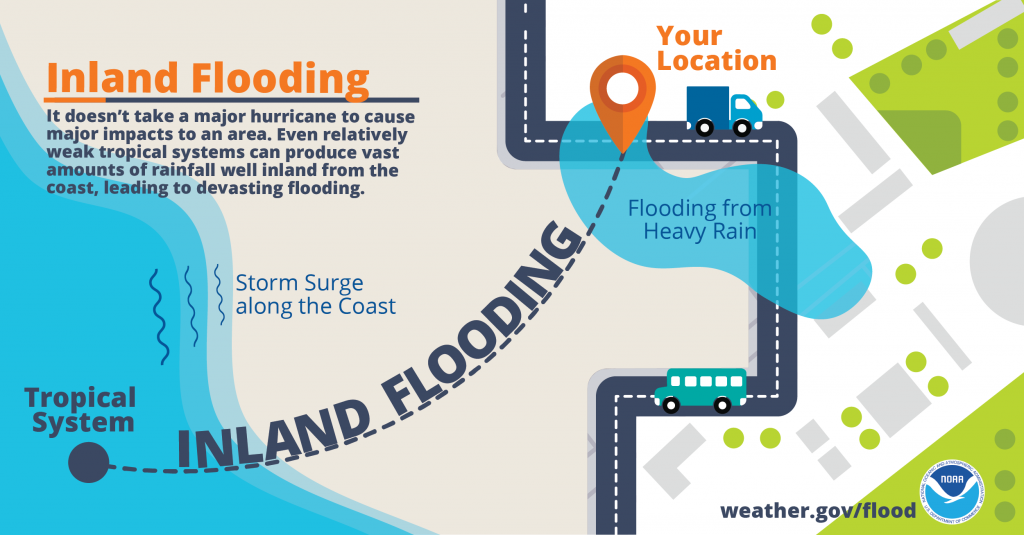
Could Climate Change Spawn Hypercanes? While the idea of climate change spawning 500 mph hypercanes remains highly speculative, there is growing evidence that global warming is indeed affecting hurricane behavior. Warmer ocean temperatures are providing more energy to fuel storm intensification, and there are indications that climate change may be causing hurricanes to intensify more rapidly, retain their strength for longer, and deliver more extreme rainfall.

However, the leap from these observed trends to the kind of world-altering super-storms envisioned by the hypercane theory is a vast one. Most hurricane experts believe that while climate change is likely to make hurricanes somewhat more intense and destructive in the coming decades, the chances of 500 mph storms appearing remain remote.

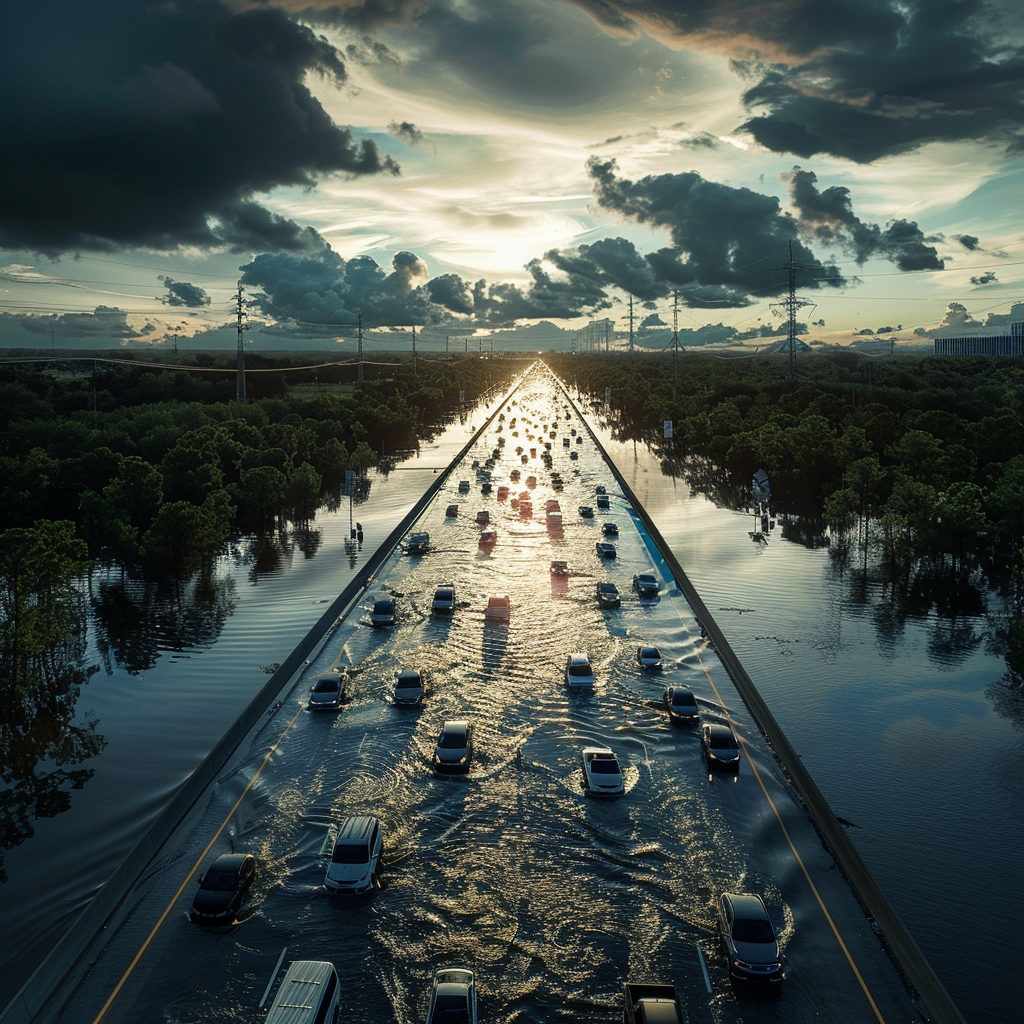
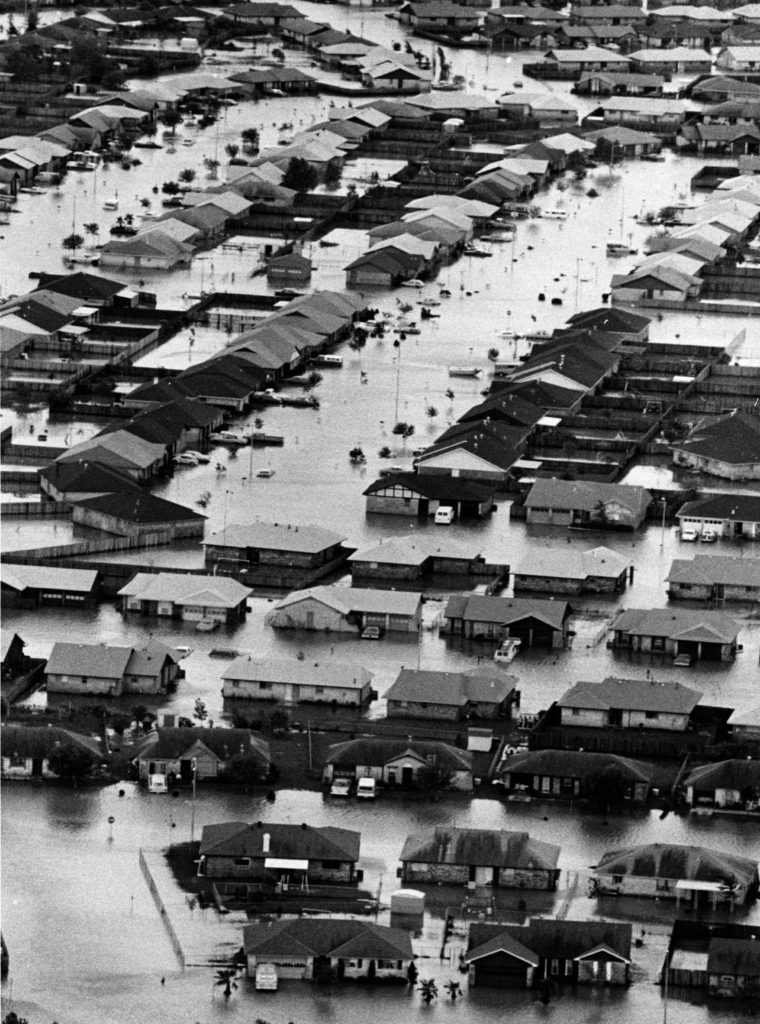
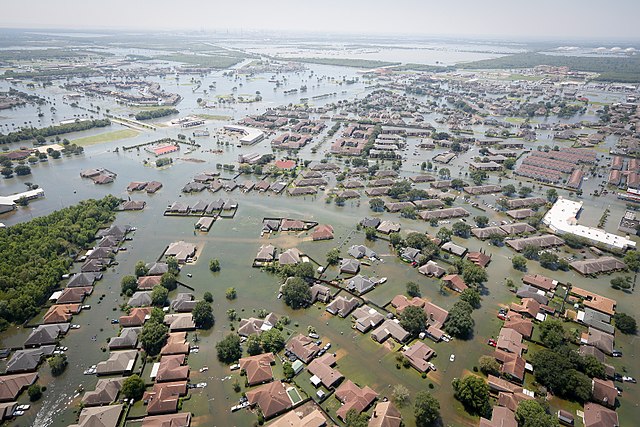
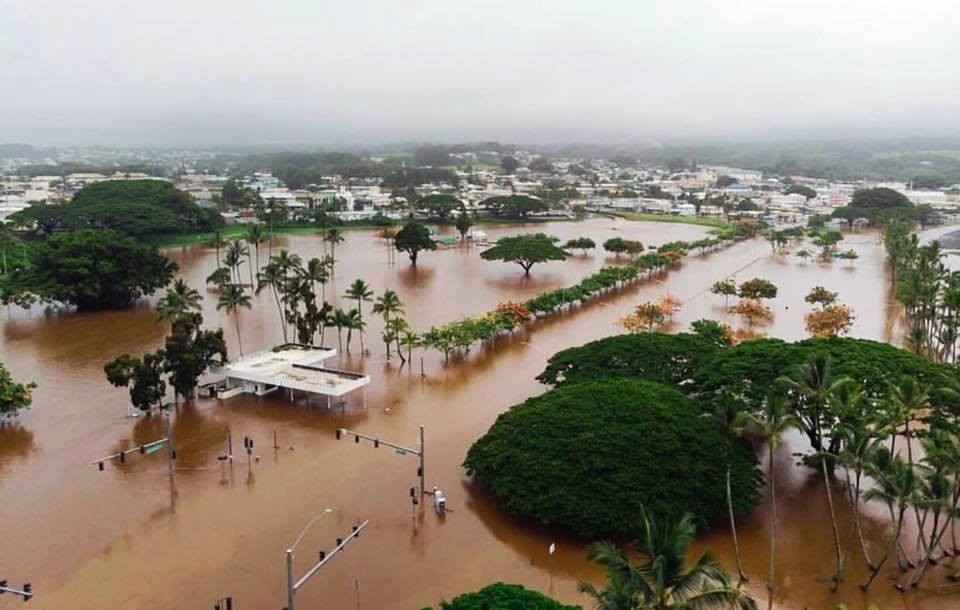
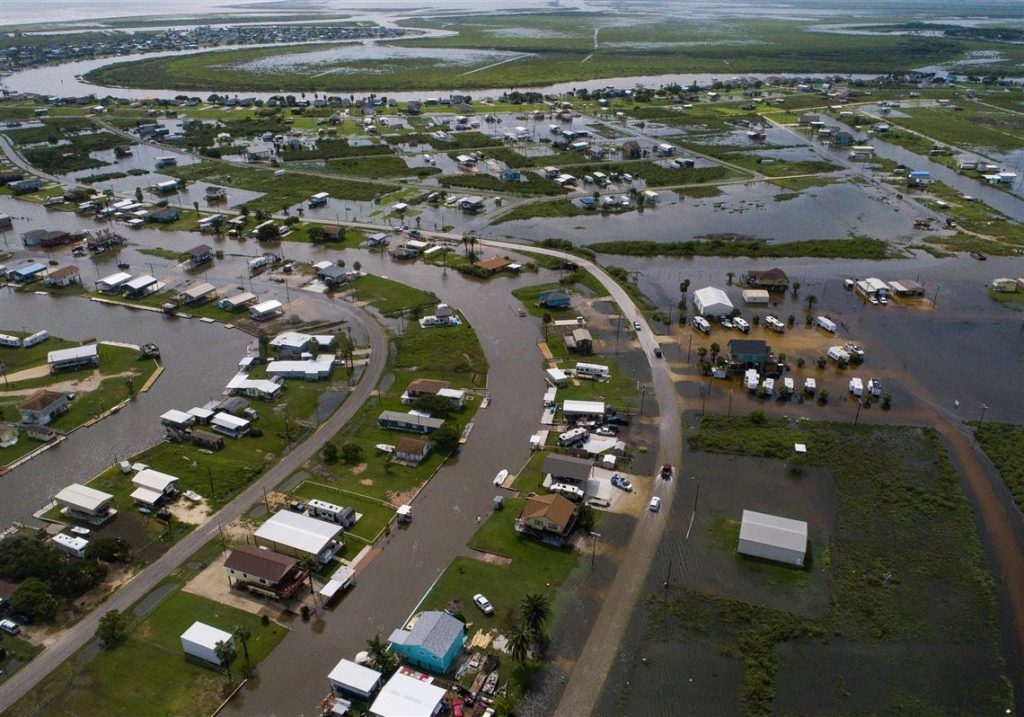
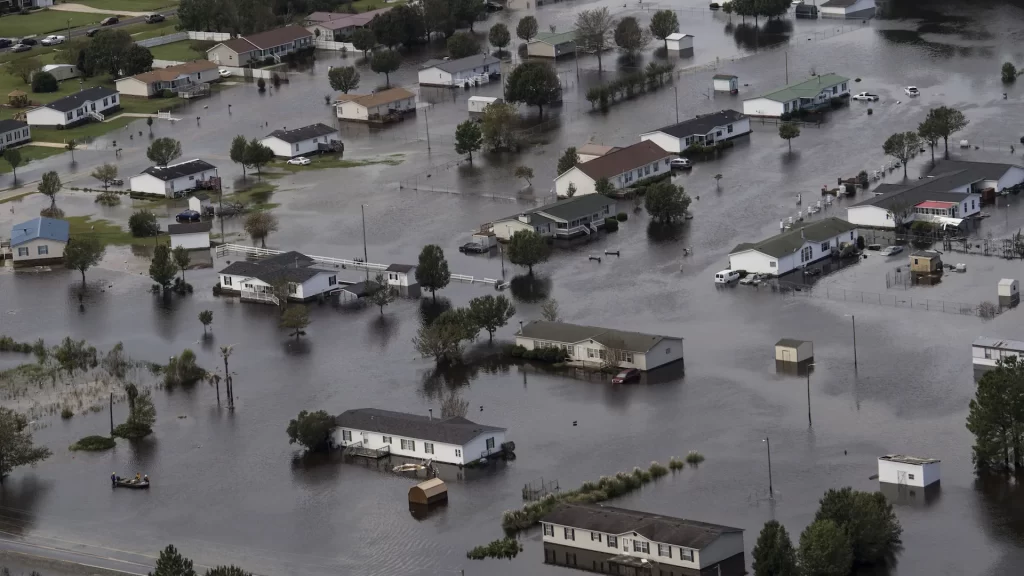
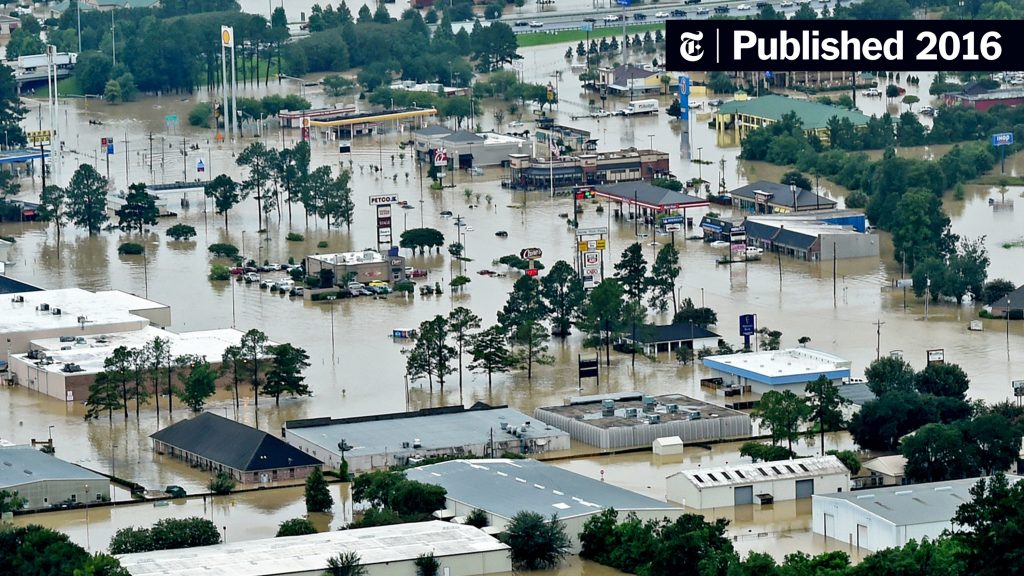
That said, even relatively modest increases in hurricane intensity could have major consequences for coastal communities around the world. A storm doesn’t need to be a hypercane to cause catastrophic damage, as recent hurricanes like Harvey, Maria, and Dorian have tragically demonstrated.

Global Temperature Increase: Over the past century, the Earth’s average surface temperature has risen by approximately 1.0°C (1.8°F), according to the Intergovernmental Panel on Climate Change (IPCC). This warming trend has accelerated in recent decades, with the warmest years on record all occurring within the last two decades. The IPCC projects that global temperatures could rise by an additional 1.5 to 4.0°C (2.7 to 7.2°F) by the end of this century, depending on future greenhouse gas emissions.

Local Temperature Variations: While the Earth is warming on average, the magnitude of temperature changes varies significantly by region. Some areas, particularly in the Arctic, are warming much faster than the global average. This phenomenon, known as Arctic amplification, is caused by a variety of factors, including the loss of reflective sea ice and snow cover, which exposes darker ocean and land surfaces that absorb more heat.

Other regions, such as the Antarctic Peninsula and parts of the Middle East, are also experiencing more rapid warming than the global average. In contrast, some areas, like the Southern Ocean around Antarctica, have shown slower warming trends, in part due to the ocean’s ability to absorb and distribute heat.

Feedback Loops and Amplification: One of the major concerns about climate change is the potential for various feedback loops to amplify warming. Feedback loops occur when the effects of warming trigger changes that further enhance warming, creating a self-reinforcing cycle. Some key examples include:

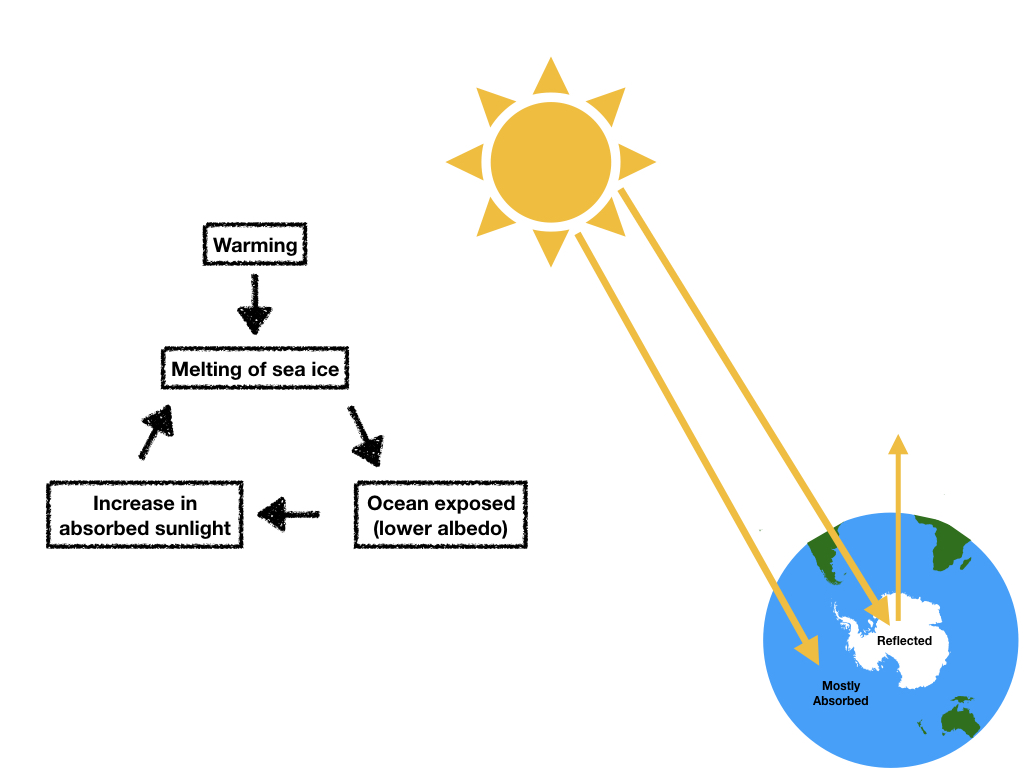
1.Ice-Albedo Feedback: As Arctic sea ice and glaciers melt, they expose darker surfaces (ocean water and land) that absorb more sunlight, leading to further warming and more melting.

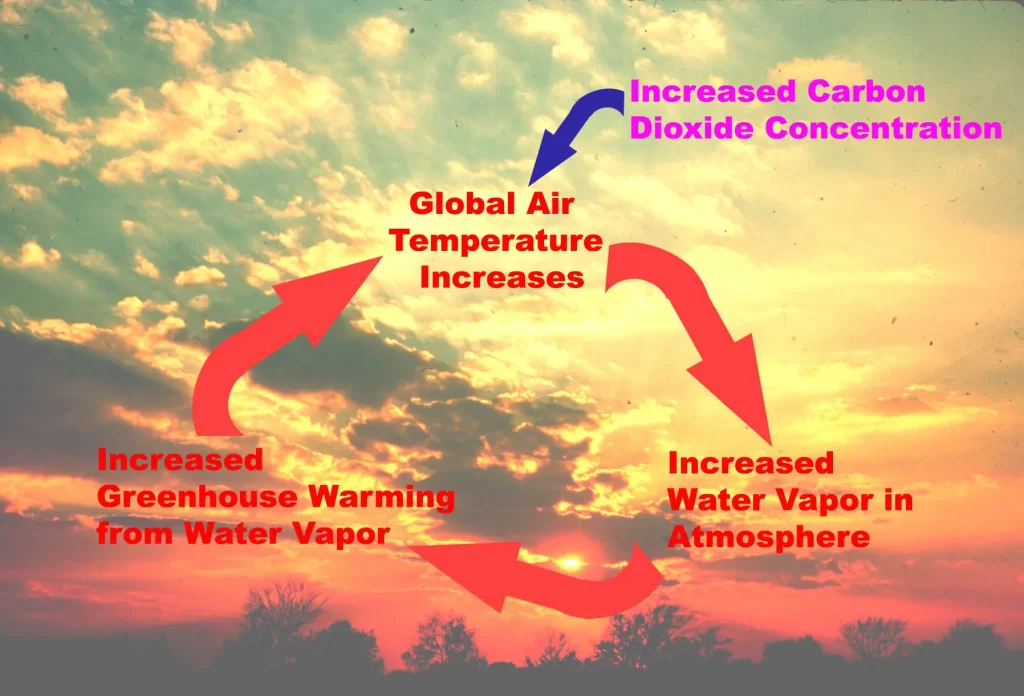
    2. Water Vapor Feedback: Warmer air can hold more moisture. As global temperatures rise, the atmosphere can absorb more water vapor, which is itself a potent greenhouse gas, leading to further warming.

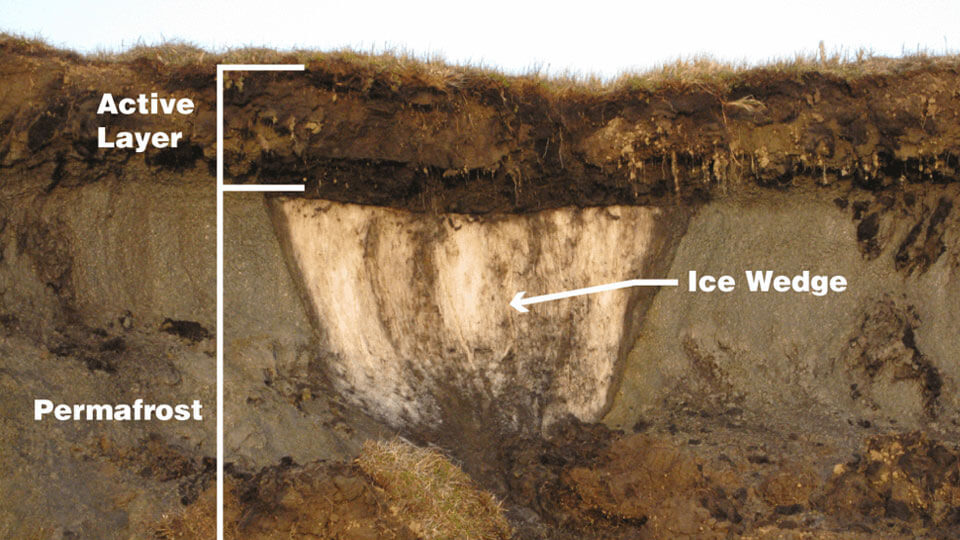
      3. Permafrost Thaw: As temperatures rise, vast areas of frozen ground (permafrost) in the Arctic are beginning to thaw. This thawing releases methane, a powerful greenhouse gas, and carbon dioxide from long-frozen organic matter, further amplifying warming.

        These feedback loops, among others, have the potential to accelerate warming beyond the direct effects of greenhouse gas emissions alone, underscoring the urgency of reducing emissions to limit temperature rise.

        Sea Surface Temperatures: The temperature of the ocean surface plays a crucial role in the Earth’s climate system, and it has a direct impact on hurricane intensity. Over 90% of the excess heat trapped by greenhouse gases is absorbed by the oceans, leading to rising sea surface temperatures (SSTs).

        Since 1901, global average SSTs have increased by approximately 0.7°C (1.3°F), with most of this warming occurring in the last 50 years. However, like air temperatures, the magnitude of SST changes varies by region. Some ocean basins, such as the tropical Atlantic and parts of the Indian Ocean, have warmed more rapidly than the global average.

        Rising SSTs have a direct influence on hurricane potential intensity (the theoretical maximum strength a storm can achieve under given environmental conditions). Warmer SSTs provide more energy to fuel hurricane development and intensification. Studies have shown that the maximum intensity of tropical cyclones has increased by about 8% globally since 1979, with the most pronounced changes in the North Atlantic and Indian Oceans.

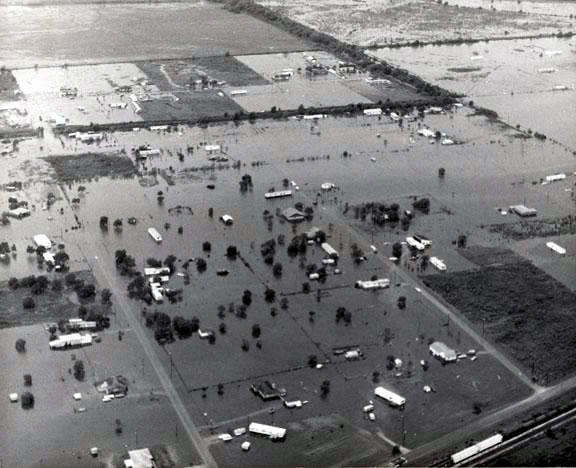
        In addition to their direct effects on hurricanes, warmer SSTs also contribute to sea level rise through thermal expansion (as water warms, it expands in volume). This sea level rise exacerbates coastal flooding and storm surge impacts during hurricanes, even if the storms themselves do not change in intensity.

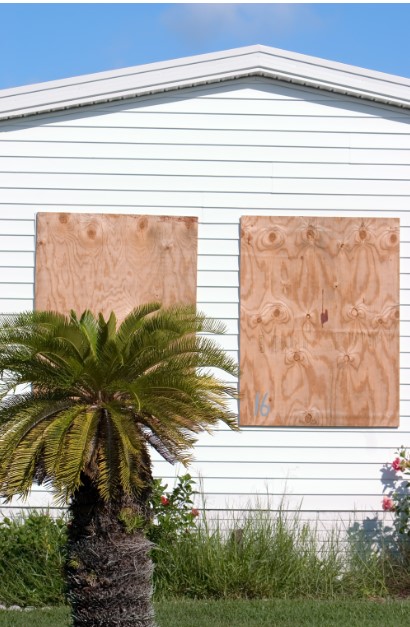
        Preparing for an Uncertain Future: As the world continues to grapple with the realities of climate change, preparing for the potential of more extreme hurricanes is becoming an increasingly urgent priority. While the specter of 500 mph hypercanes remains largely in the realm of theoretical speculation, the risks posed by even moderately more intense storms are all too real.

        Coastal cities and communities will need to invest in more resilient infrastructure, improved early warning systems, and more effective evacuation plans to cope with the hurricanes of the future. At the same time, the world must continue to work towards reducing greenhouse gas emissions and mitigating the root causes of climate change.

        The 5 Greatest Floods in US History

        Throughout the history of the United States, several devastating floods have occurred due to record-breaking 24-hour rainfall totals. These events have caused immense damage to infrastructure, homes, and tragically, human lives. In this article, we will explore the five most significant 24-hour rainfall events and the resulting floods in US history.

        1.Alvin, Texas – July 25-26, 1979 On July 25 and 26, 1979, the small town of Alvin, Texas, experienced an astonishing 43 inches of rain within a 24-hour period, setting the record for the highest 24-hour rainfall total in US history. This unprecedented rainfall was caused by the remnants of Tropical Storm Claudette, which stalled over the area, unleashing a relentless deluge. The resulting flood inundated the town, causing widespread damage to homes, businesses, and infrastructure. The Chocolate Bayou, a typically tranquil stream, transformed into a raging torrent, sweeping away everything in its path. Miraculously, no lives were lost during this event, but the economic impact was substantial, with damages estimated at over $100 million (adjusted for inflation).

        2. Tropical Storm Claudette, Texas – July 1979 In addition to the record-breaking rainfall in Alvin, Tropical Storm Claudette also caused severe flooding in other parts of Texas in July 1979. An area near Alvin recorded 42 inches of rain within a 24-hour period, making it the second-highest 24-hour rainfall total in US history. The storm’s slow movement and abundant moisture supply contributed to the extreme rainfall, which led to extensive flooding and damage throughout the affected regions.

        3. Thrall, Texas – September 9-10, 1921 On September 9 and 10, 1921, the small town of Thrall, Texas, experienced a staggering 38.2 inches of rain within a 24-hour period. The intense rainfall was the result of a slow-moving tropical disturbance that had formed in the Gulf of Mexico. As the system moved inland, it unleashed torrential rains, causing the San Gabriel River and its tributaries to swell rapidly. The ensuing flood destroyed homes, farms, and bridges, leaving the town in ruins. The loss of life was significant, with at least 215 people perishing in the floodwaters. The Thrall flood remains one of the deadliest in Texas history.

        4. Yankeetown, Florida – September 5-6, 1950 In early September 1950, the small fishing village of Yankeetown, Florida, bore the brunt of a powerful hurricane that had formed in the Gulf of Mexico. As the storm made landfall, it unleashed a staggering 38.7 inches of rain within a 24-hour period. The resulting flood inundated the low-lying areas of the town, destroying homes and businesses. The storm surge, combined with the heavy rainfall, caused the Withlacoochee River to rise rapidly, submerging vast swaths of land. Fortunately, due to the small population of Yankeetown, the loss of life was minimal, but the economic impact was significant, with damages estimated at over $50 million (adjusted for inflation).

        5. Smethport, Pennsylvania – July 17-18, 1942 Moving to the northeastern United States, the small borough of Smethport, Pennsylvania, holds the record for the fifth-highest 24-hour rainfall total in US history. On July 17 and 18, 1942, an astounding 34.5 inches of rain fell upon the area, causing catastrophic flooding along the Allegheny River and its tributaries. The deluge was the result of a stationary front that had become situated over the region, drawing moisture from the Atlantic Ocean and producing relentless rainfall. The flood claimed the lives of 30 people and caused extensive damage to the town and surrounding areas. The event also triggered numerous landslides, further compounding the destruction.

        In recent years, the United States has experienced several significant rainfall events that have led to devastating floods. These events serve as reminders that extreme weather can strike at any time, and communities must remain vigilant and prepared. In this article, we will examine some of the most notable 24-hour rainfall floods that have occurred in the US within the last decade.

        1.Hurricane Harvey, Texas – August 2017 In August 2017, Hurricane Harvey made landfall in Texas, bringing with it an unprecedented amount of rainfall. The storm stalled over the Houston metropolitan area, dumping a staggering 60.58 inches of rain in Nederland, Texas, over a five-day period. The maximum 24-hour rainfall total recorded during the event was 25.6 inches in Pearland, Texas. The resulting floods inundated hundreds of thousands of homes, displaced over 30,000 people, and caused an estimated $125 billion in damages, making it one of the costliest natural disasters in US history.

        2. Hurricane Lane, Hawaii – August 2018 In August 2018, Hurricane Lane brought record-breaking rainfall to the Hawaiian Islands. The storm’s slow movement and proximity to the islands resulted in prolonged periods of heavy rainfall. The 24-hour rainfall total reached 31.85 inches at Mountain View on the Big Island, setting a new record for the state. The excessive rainfall caused severe flooding, landslides, and road closures across the islands, with damages estimated at over $250 million.

        3. Tropical Storm Imelda, Texas – September 2019 Tropical Storm Imelda made landfall in Texas in September 2019, bringing torrential rainfall to the region. The storm’s slow movement allowed for the accumulation of extreme rainfall totals, with some areas receiving over 40 inches of rain. The maximum 24-hour rainfall total recorded during the event was 21.51 inches near Sargent, Texas. The resulting floods caused widespread damage to homes, businesses, and infrastructure, with estimated damages exceeding $5 billion.

        4. Hurricane Florence, North Carolina – September 2018 In September 2018, Hurricane Florence made landfall in North Carolina, bringing with it record-breaking rainfall. The storm’s slow movement and prolonged impact resulted in rainfall totals exceeding 30 inches in some areas. The maximum 24-hour rainfall total recorded during the event was 23.63 inches in Elizabethtown, North Carolina. The floods caused by Hurricane Florence led to widespread damage, with over 50 deaths and an estimated $24 billion in damages.

        5. Louisiana Floods – August 2016 In August 2016, a slow-moving low-pressure system brought heavy rainfall to southern Louisiana, resulting in catastrophic flooding. The maximum 24-hour rainfall total recorded during the event was 21.86 inches in Watson, Louisiana. The floods affected over 100,000 homes, displaced thousands of residents, and caused an estimated $10-15 billion in damages.

        Graphcast: A Breakthrough AI Model for Highly Accurate and Efficient Global Weather Forecasting

        Weather forecasting is one of the most complex and important scientific challenges facing humanity today. Accurate predictions of weather conditions days in advance can help save lives, optimize industries, and inform critical decision making. However, traditional numerical weather prediction (NWP) approaches rely on complex physics-based simulations that require immense computing power and deep expertise to develop and run.

        Now, a groundbreaking new AI model called Graphcast, developed by researchers at Google, is poised to revolutionize global weather forecasting. By leveraging advanced machine learning techniques and decades of historical weather data, Graphcast can generate highly accurate 10-day global forecasts with unprecedented computational efficiency. A paper published in the journal Science details how Graphcast outperforms the current industry gold-standard weather simulation in accuracy while requiring orders of magnitude less computing power and time.

        How Graphcast Works


        At its core, Graphcast is a deep learning model based on graph neural networks (GNNs), an architecture well-suited for processing the spatially structured data of global weather systems. The model was trained on over 40 years of historical weather data from the ERA5 reanalysis dataset compiled by the European Centre for Medium-Range Weather Forecasts (ECMWF). This dataset combines historical observations from satellites, radar, weather stations and other sources with NWP techniques to reconstruct a comprehensive record of past global weather conditions.

        From this vast trove of training data, Graphcast learned the complex web of cause-and-effect relationships governing the evolution of weather systems over time. The resulting model can ingest just the weather conditions at the present time and 6 hours prior, and roll forward highly accurate predictions in 6-hour increments out to 10 days in the future.

        Graphcast makes predictions at a high spatial resolution of 28km x 28km grids spanning the entire globe – over 1 million data points. At each grid point, it forecasts five key surface variables like temperature and wind speed, as well as six atmospheric variables at 37 different altitudes. Despite this level of detail and complexity, Graphcast can generate a full 10-day global forecast in under 1 minute using a single TPU v4 machine. In contrast, the ECMWF’s HRES model, widely considered the best in the world, requires hours of computation from a supercomputer with hundreds of nodes to produce a forecast of similar length.

        Unprecedented Accuracy When evaluated against the HRES model in comprehensive tests, Graphcast delivered more accurate predictions for over 90% of the 1380 weather variables and forecast timespans analyzed. Focusing on just the troposphere, the critical 6-20km band of atmosphere closest to the Earth’s surface, Graphcast beat HRES for 99.7% of variables tested.

        This leap in predictive accuracy can have profound real-world impacts. In one striking example, Graphcast locked onto an accurate forecast track for Hurricane Lee’s Nova Scotia landfall a full 9 days in advance during a live trial in September 2022. HRES predictions vacillated until converging on the correct track only 6 days out. Earlier and more accurate hurricane path forecasts enabled by Graphcast could give affected populations more time to prepare and evacuate.

        Graphcast also shows promise in predicting other extreme weather events beyond what it was specifically trained for. By applying a cyclone tracking algorithm to its outputs, researchers found Graphcast maintained higher accuracy than HRES in projecting cyclone paths as the forecast window lengthened. The model can characterize atmospheric rivers to help predict flood risks, and it can flag upcoming heat waves sooner by identifying when temperatures will exceed historical maximums for a given time and place.

        Efficiency and Accessibility Perhaps just as significant as Graphcast’s accuracy gains is the dramatic reduction in computational cost and complexity it demonstrates compared to physics-based simulations. The ability to produce world-class forecasts on a single machine in under a minute opens up new possibilities for making weather prediction more accessible and useful for a wider range of applications.

        To accelerate this progress, the Graphcast model code has been open-sourced, enabling researchers and forecasters worldwide to experiment with and build upon it. ECMWF is already running a live trial of Graphcast forecasts. The code could be adapted to focus on specific weather phenomena or optimized for regional prediction needs.

        Graphcast joins other cutting-edge weather models developed by Google researchers, including a nowcasting system for short-term forecasts and MetNet-3 for improved 24-hour regional predictions already deployed across the U.S. and Europe. Together, these AI-powered tools promise to democratize access to faster, more accurate, and more useful weather forecasts for billions worldwide.

        Looking Ahead As climate change continues to disrupt historical weather patterns, adaptable AI prediction systems like Graphcast will become increasingly vital. The model will continue to evolve and improve as more and higher-quality weather observations become available to train it.

        Beyond its practical utility for weather forecasting, Graphcast demonstrates the immense potential for AI and machine learning to help us better understand and predict the workings of complex natural systems. With further research and development, these technologies could become integral for climate modeling, ecological monitoring, disaster response, and more.

        By enabling us to anticipate future conditions with greater foresight and confidence, AI-powered predictive tools like Graphcast can empower scientists, policymakers, and society at large to make better decisions in the face of growing environmental risks and challenges. While we may not be able to control the weather, breakthroughs like Graphcast bring us one step closer to being able to plan for whatever it may bring.

        Weather in Art and Literature: How Artists Have Captured the Elements

        Throughout history, artists and writers have been captivated by the power and beauty of the weather. From the gentle brush of a summer breeze to the fury of a raging storm, the elements have served as a source of inspiration for countless works of art and literature. In this article, we will explore how artists have captured the essence of weather in their creations and how it has shaped our perception of the natural world.

        In the realm of visual arts, weather has been a recurring theme for centuries. One of the earliest examples can be found in the works of the Dutch Golden Age painters of the 17th century. Artists like Jacob van Ruisdael and Aelbert Cuyp were renowned for their landscapes that depicted the changing skies and atmospheric conditions of the Netherlands. Ruisdael’s “The Windmill at Wijk bij Duurstede” (1670) showcases a dramatic sky with billowing clouds and a windmill silhouetted against the light, capturing the essence of the Dutch countryside.

        The Romantic era of the late 18th and early 19th centuries saw a surge in the representation of weather in art. Painters like J.M.W. Turner and Caspar David Friedrich were drawn to the sublime and awe-inspiring aspects of nature, often depicting turbulent seas, misty mountains, and stormy skies. Turner’s “Snow Storm: Steam-Boat off a Harbour’s Mouth” (1842) is a prime example of his mastery in conveying the raw power of the elements. The painting depicts a steamboat struggling against the fury of the wind and waves, with the sky and sea merging into a vortex of energy.

        In “Tornado over the Wilderness” (1831), American painter Thomas Cole captures the terrifying majesty of a twister tearing through a desolate landscape. The canvas is dominated by the swirling vortex of the tornado, its funnel cloud descending from a dark and ominous sky. The twisted forms of trees and debris caught in the wind’s fury emphasize the destructive power of the storm, while a distant bolt of lightning illuminates the scene with an eerie, otherworldly glow. Cole’s painting serves as a reminder of nature’s untameable force and the insignificance of man in the face of such awesome might, a theme that resonated deeply with the Romantic sensibilities of the time.

        In “Cottage Destroyed by Lightning” (1777), English artist Joseph Wright of Derby captures the devastating aftermath of a lightning strike on a rural cottage. The painting is dominated by the shattered ruins of the building, its roof and walls collapsed and smoldering in the wake of the powerful bolt. The dark, turbulent sky above is illuminated by a jagged streak of lightning, casting an eerie, unsettling light across the scene. Wright’s use of dramatic chiaroscuro and his attention to the details of the destruction emphasize the raw, destructive power of nature and the fragility of human life in the face of such overwhelming force.

        American painter Martin Johnson Heade’s “Thunderstorm on Narragansett Bay” (1868) depicts a dramatic moment during a powerful coastal storm. The canvas is divided between the dark, roiling clouds above and the choppy, wind-whipped waters below, with a distant shoreline barely visible through the haze. A brilliant flash of lightning illuminates the sky, its jagged bolt reflected in the turbulent waves and casting a stark, almost supernatural light across the scene. Heade’s precise, detailed brushwork and his skillful rendering of the atmospheric effects of the storm create a sense of both awe and unease, capturing the sublime beauty and terror of nature’s fury.

        “The Tornado” (1927) by American painter John Steuart Curry. Although Curry was active in the early 20th century, this painting depicts a scene from the previous century. The canvas shows a massive, swirling tornado tearing through a rural landscape, with a farmhouse and barn being ripped apart by the powerful winds. The twister’s funnel cloud is rendered in shades of black and gray, conveying a sense of menace and destruction. In the foreground, a group of figures can be seen seeking shelter, their bodies bent against the force of the wind.

        Impressionist painters of the late 19th century were also fascinated by the fleeting effects of light and weather on the landscape. Claude Monet, one of the most prominent figures of the movement, dedicated numerous series to capturing the changing light and atmosphere at different times of the day and in various weather conditions. His “Haystacks” series (1890-1891) depicts the same subject under different light and weather conditions, showcasing how the perception of color and form shifts with the changing elements.

        Giorgione’s “The Tempest” (c. 1506-1508) is a masterpiece of Renaissance art that captures the intense drama of a powerful thunderstorm. In this enigmatic painting, a dark and foreboding sky looms over a lush landscape, punctuated by streaks of lightning that illuminate the scene with an eerie glow. The figures in the foreground, a nude woman nursing a child and a soldier standing nearby, appear small and vulnerable against the backdrop of the raging storm, highlighting the awesome power of nature. Giorgione’s use of chiaroscuro, the interplay of light and shadow, adds to the sense of mystery and unease that pervades the painting, inviting the viewer to contemplate the deeper meanings behind this haunting image.

        In Rembrandt van Rijn’s “The Storm on the Sea of Galilee” (1633), the Dutch master depicts the biblical story of Jesus calming the storm, capturing the terror and chaos of the moment with his signature mastery of light and shadow. The painting shows the disciples’ boat being tossed about by the turbulent waves, their faces contorted in fear as they struggle against the raging wind and water. Rembrandt’s use of dramatic contrasts, with the dark sky and sea juxtaposed against the bright highlights on the figures and boat, heightens the sense of danger and desperation. The composition draws the viewer’s eye to the figure of Christ, who stands calmly amidst the chaos, his hand raised in a gesture of command, demonstrating his divine power over the elements.

        English Romantic painter J.M.W. Turner’s “Snowstorm: Hannibal and his Army Crossing the Alps” (1812) is a powerful example of the artist’s fascination with the sublime forces of nature. The painting depicts the legendary Carthaginian general Hannibal leading his army across the treacherous Alps, battling against a fierce blizzard that threatens to engulf them. Turner’s swirling brushstrokes and pale, almost monochromatic color scheme convey the disorienting fury of the snowstorm, with the tiny figures of Hannibal and his soldiers nearly lost amidst the maelstrom. The painting serves as a testament to the awesome power of nature and the insignificance of human endeavors in the face of such overwhelming might, a central theme of the Romantic movement that Turner helped to define.

        In the 20th century, artists continued to explore the theme of weather in their works. American painter Georgia O’Keeffe, known for her abstract depictions of nature, often incorporated elements of the sky and clouds in her paintings. Her “Sky Above Clouds IV” (1965) presents a vast expanse of clouds viewed from above, inviting the viewer to contemplate the immensity and beauty of the atmosphere.

        Photography has also played a significant role in capturing the essence of weather. Ansel Adams, one of the most influential photographers of the 20th century, was renowned for his black and white landscapes that often featured dramatic skies and atmospheric conditions. His photograph “Clearing Winter Storm, Yosemite National Park” (1944) depicts the aftermath of a storm, with mist rising from the valley and sunlight breaking through the clouds, creating a sense of tranquility and renewal.

        In literature, weather has been used as a powerful tool to set the mood, reflect the emotions of characters, and symbolize deeper themes. Shakespeare frequently employed weather as a metaphor in his plays, with storms and tempests often representing the inner turmoil of his protagonists. In “King Lear,” the raging storm on the heath mirrors the madness and despair of the titular character, while in “The Tempest,” the storm that opens the play serves as a catalyst for the events that unfold.

        The Romantic poets of the 19th century, such as William Wordsworth and Percy Bysshe Shelley, often drew inspiration from the natural world and the changing seasons. Wordsworth’s “I Wandered Lonely as a Cloud” (1807) captures the joy and wonder of stumbling upon a field of daffodils on a breezy spring day, while Shelley’s “Ode to the West Wind” (1819) invokes the power of the wind as a force of change and renewal.

        In the 20th century, modernist writers like Virginia Woolf and James Joyce used weather to create atmosphere and reflect the inner lives of their characters. In Woolf’s “To the Lighthouse” (1927), the shifting weather patterns at the seaside mirror the changing dynamics of the Ramsay family, while in Joyce’s “Ulysses” (1922), the city of Dublin is brought to life through vivid descriptions of the weather and its effects on the characters’ moods and actions.

        Contemporary artists and writers continue to be inspired by the weather and its many manifestations. In the world of installation art, artists like Olafur Eliasson have created immersive environments that simulate natural phenomena, such as his “The Weather Project” (2003) at the Tate Modern, which recreated the experience of a giant sun in the museum’s turbine hall. In literature, authors like Amitav Ghosh have explored the impact of climate change and extreme weather events on human lives and communities, as seen in his novel “The Hungry Tide” (2004), set in the Sundarbans delta of India and Bangladesh.

        The representation of weather in art and literature serves as a reminder of our deep connection to the natural world and the power of the elements to shape our experiences and emotions. Whether captured in paint, pixels, or words, the ever-changing face of the weather continues to captivate and inspire artists and writers, inviting us to marvel at the beauty and complexity of the world around us.

        From the gentle brush strokes of the Dutch Golden Age painters to the immersive installations of contemporary artists, weather has been a constant presence in the history of art. It has served as a source of inspiration, a metaphor for the human condition, and a reminder of the awesome power of nature. Similarly, in literature, weather has been used to create atmosphere, reflect the inner lives of characters, and explore deeper themes of change, renewal, and the human relationship with the environment.

        Unraveling the Mystery: Why Severe Storms Have Green, Teal, and Blue Colors

        Supercell thunderstorms are among the most awe-inspiring and powerful weather phenomena on Earth. These storms are characterized by their rotating updrafts, known as mesocyclones, which can produce severe weather conditions such as large hail, damaging winds, and even tornadoes. One of the most striking features of supercells is the occasional appearance of a green or teal color in the sky, particularly near the storm’s base. This unique coloration has fascinated both weather enthusiasts and scientists alike, prompting numerous studies to unravel the mystery behind this phenomenon.

        The presence of these large water droplets is crucial to the formation of the green or teal color. Water droplets are particularly effective at absorbing red light, which is at the longer wavelength end of the visible spectrum. As sunlight enters the storm and interacts with these water droplets, a significant portion of the red light is absorbed, leaving the remaining light dominated by shorter wavelengths, which correspond to blue and green colors.

        However, the absorption of red light by water droplets alone is not sufficient to explain the intense green or teal hue sometimes observed. Another critical factor is the presence of ice crystals in the upper portions of the storm, particularly in the updraft and the rear flank downdraft (RFD). The RFD is another area of descending air, located on the back side of the storm, often associated with strong winds and large hail.

        Ice crystals in the upper portions of the storm can scatter the remaining blue light, further enhancing the green appearance. The combination of red light absorption by water droplets in the lower levels and blue light scattering by ice crystals in the upper levels creates the distinctive green or teal color.

        The green coloration is most likely to be observed when the sun is at a low angle on the horizon, typically during the late afternoon or early evening. During this time, sunlight has to travel through more of the Earth’s atmosphere, which can further filter out red light and enhance the green appearance. Additionally, the presence of large amounts of hail in the storm can intensify the green color, as hail can also absorb and scatter light in a manner similar to water droplets and ice crystals. Most storm chasers have experienced the largest hail when storms take on green and teal colors.

        It is important to note that not all supercells exhibit a green or teal color, and the absence of this coloration does not necessarily indicate a less severe storm. The appearance of the green hue depends on a delicate balance of factors, including the storm’s structure, the concentration and size of hydrometeors, and the angle of the sun.

        While the green or teal color in supercells is a fascinating phenomenon, it is important to remember that it is often associated with the most severe and dangerous storms. Supercells that exhibit this coloration are likely to be producing large hail, damaging winds, and possibly even tornadoes. If you find yourself in the vicinity of a supercell with a green or teal hue, it is crucial to seek shelter immediately and follow the advice of local weather authorities.

        Top 5 Hurricane Myths Debunked

        Hurricane Mythbusters: Taping Windows Does NOT Save You

        As hurricane season approaches, preparation becomes paramount for those living in vulnerable coastal regions. Amidst the flurry of activity – securing outdoor furniture, stocking up on supplies, and reviewing evacuation plans – a persistent myth continues to circulate: taping windows prevents them from shattering during a hurricane. This well-intentioned practice, however, offers a false sense of security and does little to protect your home from the destructive forces of hurricane-force winds.

        The Science Behind Shattering Windows:

        Understanding why taping windows is ineffective requires a basic understanding of how hurricane winds impact structures. During a hurricane, intense wind gusts exert immense pressure on the exterior of a building, including windows and doors. When wind speeds reach extreme levels, the pressure differential between the inside and outside of a building can become significant. This pressure difference, rather than the direct force of the wind itself, is often the primary cause of window failure.

        Why Tape Fails the Test:

        Taping windows, while seemingly logical, does not address the underlying issue of pressure differential. The tape may hold shattered glass fragments together momentarily, but it does little to prevent the initial breakage or the forceful intrusion of wind and debris into the building. Once a window fails, the sudden influx of wind can create a build-up of internal pressure, potentially leading to catastrophic structural damage, including roof failure.

        Effective Alternatives for Window Protection:

        Instead of relying on the ineffective practice of taping windows, consider these proven methods for enhancing window protection during a hurricane:

        • Hurricane Shutters: Permanent or removable hurricane shutters offer the most robust protection for windows. These shutters are typically made of aluminum or steel and are designed to withstand extreme wind pressures and flying debris.
        • Impact-Resistant Windows: Investing in impact resistant windows provides a permanent solution for enhanced window protection. These windows are constructed with laminated glass and reinforced frames, significantly reducing the risk of breakage during a storm.
        • Plywood: While not as aesthetically pleasing or convenient as shutters or impact-resistant windows, properly installed plywood can offer a temporary and more affordable alternative. Ensure the plywood is cut to fit each window and securely anchored to the window frame.

        Dispelling the Myth, Promoting Safety:

        The myth of taping windows as an effective hurricane protection measure persists due to a combination of misinformation and a desire for simple solutions. However, understanding the science behind window failure and the limitations of tape is crucial for making informed decisions about hurricane preparedness

        Hurricane Mythbusters: Opening Windows Doesn’t Protect Your Roof

        Amidst the flurry of preparations during hurricane season, a common misconception often emerges: opening windows helps equalize pressure and prevents roof damage during a storm. This seemingly logical notion, however, is a dangerous myth that can actually worsen the situation and put your home at greater risk.

        Understanding Pressure Dynamics:

        To grasp why opening windows is counterproductive, it’s crucial to understand the basic principles of pressure dynamics during a hurricane. As hurricane-force winds batter a building, they create a zone of low pressure outside. If the building is relatively airtight, with windows and doors closed, the pressure inside remains higher. This pressure differential, while still posing a threat to windows and doors, helps to maintain the structural integrity of the roof.

        The Perils of Open Windows:

        Opening windows during a hurricane disrupts this pressure balance. Instead of equalizing pressure, it allows the strong winds to enter the building, creating a buildup of internal pressure that pushes upwards on the roof. This internal pressure, combined with the external wind forces, can significantly increase the risk of roof uplift and structural failure.

        Wind Tunnel Effect and Debris Hazards:

        Beyond the pressure concerns, opening windows creates a wind tunnel effect, allowing wind and debris to enter the building with greater force. This can turn everyday objects into dangerous projectiles, causing significant damage to the interior of your home and posing a serious threat to anyone inside.

        Focus on Proper Roof Protection:

        Instead of resorting to the myth of opening windows, focus on proactive measures to protect your roof during a hurricane:

        • Roof Inspections and Maintenance: Regularly inspect your roof for any loose shingles, damaged flashing, or other vulnerabilities. Address any issues promptly to ensure your roof is in optimal condition to withstand a storm.
        • Hurricane Straps and Reinforcements: Consider reinforcing your roof structure with hurricane straps or clips. These metal connectors help to secure the roof to the walls of your home, increasing its resistance to uplift forces.
        • Impact-Resistant Roofing Materials: If you live in a hurricane-prone area, consider investing in impact-resistant roofing materials, such as metal or asphalt shingles specifically designed to withstand high winds and flying debris.

        Hurricane Mythbusters: Storm Surge is More Than Just a Big Wave

        When hurricanes threaten coastal communities, the term “storm surge” frequently arises, often accompanied by misconceptions about its nature and dangers. One common myth portrays storm surge as simply a large wave crashing onto the shore. However, the reality of storm surge is far more complex and menacing, posing a significant threat to life and property.

        Understanding the Mechanics of Storm Surge:

        Storm surge is not a singular wave but rather an abnormal rise of water generated by a storm’s winds pushing seawater towards the coast. As a hurricane approaches land, its powerful winds act like a giant fan, shoving a massive volume of ocean water towards the shoreline. This surge of water can reach heights of several feet, inundating coastal areas far beyond the reach of normal waves.

        Factors Influencing Storm Surge:

        Several factors influence the severity of storm surge, including:

        • Hurricane Intensity: Stronger hurricanes with higher wind speeds generate more powerful storm surges.
        • Size and Shape of the Hurricane: Larger hurricanes with a broader wind field tend to produce more extensive storm surge.
        • Angle of Approach: The angle at which a hurricane approaches the coast influences the direction and height of the surge.
        • Coastal Topography: The shape and slope of the coastline play a crucial role in determining the extent of inundation. Low-lying areas and shallow coastal waters are particularly vulnerable to significant storm surge.

        The Destructive Power of Storm Surge:

        Storm surge is often the most destructive and deadly aspect of a hurricane. The forceful rush of water can inundate coastal communities, causing extensive flooding, structural damage, and erosion. Additionally, storm surge can exacerbate the impact of heavy rainfall, leading to even more severe flooding.

        Beyond the Wave: Additional Threats:

        The dangers of storm surge extend beyond the immediate threat of flooding:

        • Strong Currents: The surging water creates powerful currents that can sweep away people, vehicles, and debris.
        • Contaminated Water: Floodwaters from storm surge can be contaminated with sewage, chemicals, and other hazardous materials.
        • Debris Impact: The force of the surge can carry large debris inland, causing significant damage to structures and posing a danger to anyone in its path.

        Hurricane Mythbusters: Inland Areas are NOT Immune to Hurricane Impacts

        When hurricanes threaten landfall, the focus often centers on coastal communities bracing for the brunt of the storm. This leaves many inland residents with a false sense of security, believing they are immune to the impacts of these powerful weather systems. However, the reality is that hurricanes pose significant threats far beyond the coastline, impacting communities hundreds of miles inland.

        Wind Hazards Extend Far Inland:

        While hurricanes are known for their intense winds near the eyewall, these winds can maintain significant strength as the storm moves inland. Hurricane-force wind gusts can extend hundreds of miles from the center of the storm, causing widespread damage to trees, power lines, and structures. Inland areas, often less accustomed to such extreme winds, can be particularly vulnerable to wind-related damage.

        Flooding: A Widespread Threat:

        Hurricanes are prolific rain producers, capable of dumping torrential amounts of precipitation over vast areas. As the storm moves inland and interacts with geographical features, such as mountains and hills, the rainfall can intensify, leading to flash floods, river flooding, and mudslides. Inland communities situated near rivers, streams, and low-lying areas are particularly susceptible to these flood hazards.

        Tornadoes: A Hidden Danger:

        Hurricanes often spawn tornadoes, particularly in the right-front quadrant of the storm. These tornadoes can occur well inland, sometimes hundreds of miles from the coast, posing a significant threat to communities not directly in the path of the hurricane’s core.

        Indirect Impacts and Cascading Effects:

        Beyond the direct wind, flooding, and tornado threats, hurricanes can trigger a cascade of indirect impacts on inland areas:

        • Power Outages: Widespread wind damage to power lines can lead to prolonged power outages, disrupting essential services and daily life.
        • Transportation Disruptions: Flooding and debris can make roads impassable, hindering transportation and emergency response efforts.
        • Economic Disruptions: Business closures, agricultural losses, and supply chain disruptions can have significant economic consequences for inland communities.

        Hurricane Mythbusters: Lower Category Doesn’t Mean Lower Risk

        As hurricanes approach landfall, their categorization often becomes a focal point of public attention. The Saffir-Simpson Hurricane Wind Scale, which ranks hurricanes from Category 1 to 5 based on wind speed, provides a valuable tool for understanding potential wind damage. However, a common misconception arises when hurricanes weaken below Category 3: the assumption that lower category storms pose minimal threats. This misconception can lead to complacency and underestimation of the dangers associated with these still-powerful weather systems.

        Beyond Wind Speed: A Multifaceted Threat:

        While wind speed is a crucial factor in hurricane categorization and potential damage, it’s essential to recognize that hurricanes are multifaceted threats. Even as a hurricane weakens below Category 3, it can still unleash a range of hazards, including:

        • Heavy Rainfall and Flooding: Hurricanes are prolific rain producers, capable of causing significant inland flooding regardless of their wind speed category. Slow-moving or stalled hurricanes can dump torrential amounts of rainfall over a region, leading to flash floods, river flooding, and mudslides.
        • Storm Surge: The storm surge, a rise in seawater level pushed ashore by the hurricane’s winds, remains a significant threat even as wind speeds decrease. The height and extent of storm surge depend on various factors, including the size and track of the hurricane, coastal topography, and the timing of tides.
        • Tornadoes: Hurricanes can spawn tornadoes, regardless of their category, particularly in the right-front quadrant of the storm. These tornadoes can pose a significant threat to communities both near the coast and further inland.

        Case Studies: Lower Category, High Impact:

        History provides numerous examples of lower-category hurricanes causing significant damage and loss of life:

        • Hurricane Harvey (2017): Despite weakening to a Category 1 hurricane at landfall, Harvey stalled over Texas, producing catastrophic flooding and becoming one of the costliest hurricanes in U.S. history.
        • Hurricane Florence (2018): Florence made landfall as a Category 1 hurricane but caused extensive flooding and damage in the Carolinas due to its slow movement and record-breaking rainfall.

        Advancing Severe Weather Detection: The Rise of Dual Polarization Radar in the US

        Weather radar has always been a cornerstone of meteorological observation and forecasting. Yet, traditional radar systems, while effective, were limited in their ability to decipher the complexities within storms, often leaving meteorologists with an incomplete picture. The advent of dual polarization radar technology marked a paradigm shift, ushering in an era of enhanced precision and understanding in severe weather detection and warnings.

        Understanding the Dual Pol Advantage:

        Traditional weather radars transmit and receive horizontally polarized waves, meaning the waves vibrate parallel to the ground. This provides information about the location and intensity of precipitation but lacks the ability to discern the size, shape, and variety of particles within a storm. Dual polarization technology builds upon this foundation by introducing a second dimension – vertical polarization. By transmitting and receiving both horizontally and vertically polarized waves, dual pol radar paints a more comprehensive picture of the storm environment.

        Transforming Tornado Detection:

        One of the most significant benefits of dual pol technology lies in its ability to enhance tornado detection and warnings. Traditional radar could identify areas of rotation within a storm, suggestive of a possible tornado. However, confirming the presence of a tornado often relied on visual sightings or the detection of debris lofted into the air, both of which could be unreliable or delayed.

        Dual pol radar brought a game-changing advantage: the ability to detect debris fields associated with tornadoes. When a tornado is on the ground, it lifts a variety of objects – from tree limbs and building materials to vehicles and even larger structures. These objects scatter radar waves differently than raindrops or hailstones, creating a distinct signature that dual pol radar can identify. This capability allows meteorologists to confirm the presence of a tornado with greater confidence and issue more timely and accurate warnings, potentially saving lives.

        Sharper Images, Clearer Insights:

        Beyond debris detection, dual pol technology enhances the overall resolution and clarity of radar data. By analyzing the way horizontally and vertically polarized waves interact with precipitation particles, meteorologists can estimate the size and shape of raindrops, hailstones, and snowflakes. This information provides valuable insights into the intensity of precipitation, the potential for flooding, and the type of winter weather expected.

        A Nationwide Upgrade: The Dual Pol Rollout:

        Recognizing the transformative potential of dual polarization technology, the National Weather Service (NWS) embarked on an ambitious endeavor to upgrade its entire network of radars across the United States. The rollout, initiated in 2010 and completed in 2013, involved retrofitting existing radars with dual pol capabilities, ensuring comprehensive coverage for the nation.

        This nationwide upgrade has yielded substantial improvements in severe weather detection and warnings. Studies have shown a significant increase in lead times for tornado warnings and a reduction in false alarms, underscoring the life-saving potential of this technology.

        Beyond Tornadoes: A Multifaceted Tool:

        While the impact of dual pol radar on tornado warnings has been profound, its benefits extend far beyond this realm. The technology has proven invaluable for:

        • Improved Rainfall Estimates: By providing more accurate measurements of rainfall amounts, dual pol data enhances flash flood warnings and supports better water resource management.
        • Winter Weather Monitoring: The ability to differentiate between various types of frozen precipitation, such as snow, sleet, and freezing rain, leads to more precise winter storm forecasts and improved road condition monitoring.
        • Aviation Safety: Dual pol radar aids in identifying hazardous weather phenomena for aviation, including icing conditions and turbulence, contributing to safer air travel.

        Hurricane Andrew: A South Florida Nightmare – August 24, 1992

        The morning of August 24, 1992, dawned bright and clear in South Florida, but the calm was a cruel deception. Lurking in the Atlantic, Hurricane Andrew, a Category 5 monster, was on a collision course. By the time the sun set, Andrew would etch its name in history as one of the most destructive hurricanes to ever strike the United States, leaving behind a trail of devastation that would take years to rebuild.

        Andrew’s journey of destruction began in the eastern Atlantic as a tropical wave, gradually gaining strength as it moved westward. By August 22nd, it had intensified into a Category 5 hurricane with sustained winds of 175 mph. After pummeling the northern Bahamas, Andrew set its sights on South Florida. Despite weakening slightly to a Category 4, Andrew remained a formidable force, boasting winds of 145 mph as it approached the coast.

        Around 5 AM on August 24th, the hurricane’s eyewall slammed into Elliott Key, just south of Miami. The anemometer at the National Hurricane Center in Coral Gables clocked a peak gust of 177 mph before being destroyed by the wind. Homes were ripped apart, boats tossed ashore like toys, and palm trees stripped bare. The storm surge, a wall of water pushed ashore by the hurricane, inundated coastal areas, flooding streets and homes.

        The devastation wasn’t confined to the immediate coastline. As Andrew moved inland, its powerful winds tore through Homestead, Florida City, and Kendall, leaving behind scenes reminiscent of a war zone. Homestead Air Force Base, located near the eye of the storm, was virtually destroyed, with aircraft hangars crumpled and fighter jets tossed about like paper airplanes. Mobile home parks were obliterated, shopping centers reduced to rubble, and thousands of homes left uninhabitable. The darkness of the early morning, combined with the howling winds and driving rain, created an atmosphere of pure terror for those trapped in the storm’s path.

        Andrew’s destructive power was fueled by a combination of factors. The warm waters of the Atlantic provided ample energy for the storm to intensify. Additionally, a lack of wind shear, which can disrupt a hurricane’s organization, allowed Andrew to maintain its strength. The storm’s compact size, while limiting the geographic scope of its impact, concentrated its destructive winds over a smaller area, resulting in catastrophic damage. The pressure readings recorded in Homestead were some of the lowest ever observed in a hurricane striking the U.S. mainland, indicating the storm’s incredible intensity.

        The aftermath of Hurricane Andrew revealed a landscape of unimaginable destruction. Over 125,000 homes were damaged or destroyed, leaving thousands homeless. Millions were left without power, and the economic losses reached an estimated $26 billion, making it the costliest natural disaster in U.S. history at the time. The storm exposed flaws in building codes and emergency preparedness, prompting significant changes in both areas.

        The human cost of the disaster was equally staggering. In Florida alone, 44 deaths were directly attributed to the hurricane, with another 15 indirectly caused by the storm. Thousands more were injured, and the psychological scars left by the trauma of the event were deep and long-lasting.

        While the physical scars of Hurricane Andrew have faded with time, the memories of its devastating impact remain vivid for those who lived through it. The storm serves as a stark reminder of the destructive power of nature and the importance of respecting and preparing for its fury. The lessons learned from Andrew have led to improved building codes, better emergency response systems, and a heightened awareness of hurricane preparedness, ultimately saving countless lives in subsequent storms.

        Adjusted for inflation, the estimated $26 billion in damages translates to a staggering $55.6 billion in today’s dollars, underscoring the immense financial impact of the storm. This figure encompasses a wide range of losses, including:

        • Residential and Commercial Property Damage: Andrew obliterated thousands of homes and businesses, leaving behind a landscape of rubble. Rebuilding costs, coupled with lost economic activity, contributed significantly to the overall financial toll.
        • Infrastructure Damage: The storm inflicted severe damage on critical infrastructure, including power grids, communication systems, and transportation networks. Repairing and restoring these essential services added to the overall cost.
        • Agricultural Losses: The agricultural sector, particularly in South Florida, suffered extensive losses due to crop damage and destruction of farming infrastructure.
        • Insurance Payouts: Insurance companies faced massive payouts to cover property damage claims, leading to increased premiums and financial strain within the industry.

        Timeline of Hurricane Andrew:

        • August 14, 1992: A tropical wave emerges off the coast of Africa, marking the genesis of what would become Hurricane Andrew.
        • August 16-22, 1992: The tropical wave strengthens as it tracks westward across the Atlantic, eventually becoming a tropical storm and then rapidly intensifying into a Category 5 hurricane by August 22nd.
        • August 23, 1992: Andrew makes landfall in the northern Bahamas as a Category 4 hurricane, causing significant damage.
        • August 24, 1992 (Early Morning): Hurricane Andrew makes landfall near Elliott Key, Florida, as a Category 5 hurricane with sustained winds of 165 mph, causing catastrophic damage in South Florida, including Homestead, Florida City, and Kendall.
        • August 24-26, 1992: Andrew weakens as it crosses the Gulf of Mexico but regains strength before making a second landfall as a Category 3 hurricane in Louisiana, causing further damage.
        • August 26-28, 1992: Andrew weakens into a tropical depression as it moves inland and dissipates over the eastern United States.

        The Destructive Power of EF-5 Tornadoes: A Look at the Rarest and Most Devastating Twisters

        The rarity of EF-5 tornadoes can be attributed to the specific atmospheric conditions required for their formation. These conditions include a combination of strong wind shear, instability, and moisture. The presence of a strong, persistent updraft is also crucial in allowing the tornado to maintain its intensity and reach EF-5 status.

        Here are the last five EF-5 tornadoes recorded in the United States:

        1. Moore, Oklahoma (May 20, 2013): This devastating tornado tragically resulted in 24 fatalities and injured 210 people. The estimated population of Moore at the time was around 55,000.
        2. Joplin, Missouri (May 22, 2011): This catastrophic tornado caused immense destruction, claiming the lives of 158 people and injuring over 1,000. Joplin’s population was approximately 50,000 at the time.
        3. Parkersburg, Kansas (May 4, 2007): This powerful tornado resulted in significant damage and tragically took the lives of 11 people. The estimated population of Parkersburg was around 1,400.
        4. Greensburgh, Kansas (May 4, 2007): On the same day as the Parkersburg tornado, Greensburg was struck by another devastating EF5. The town was almost completely destroyed, with 11 fatalities reported. Greensburg’s population was approximately 1,500.
        5. Bridge Creek-Moore, Oklahoma (May 3, 1999): This intense tornado, part of a larger outbreak, caused widespread damage and resulted in 36 fatalities. The combined population of Bridge Creek and Moore was around 41,000 at the time.

        The El Reno tornado is an example of a tornado exhibiting higher wind speeds than those indicated by the damage-based Enhanced Fujita (EF) Scale rating. In fact, there have been several instances where mobile Doppler radar or close-range dual-polarization (dual-pol) radar data have suggested wind speeds exceeding the EF Scale rating.

        For example, the Chickasha, Oklahoma tornado of May 24, 2011, was rated as an EF-4 based on damage surveys. However, mobile Doppler radar data indicated wind speeds of up to 288 mph (463 km/h), which would have classified it as an EF-5. Similarly, the Tipton, Oklahoma tornado of May 16, 2015, was rated as an EF-3, but mobile radar data suggested wind speeds of up to 247 mph (398 km/h), putting it in the EF-5 range.

        These discrepancies between damage-based ratings and radar-measured wind speeds highlight the limitations of the current EF Scale and the need for a more comprehensive approach to tornado intensity classification. By incorporating mobile and close-range dual-pol radar data, scientists and meteorologists could gain a more accurate understanding of a tornado’s true intensity and potential for damage.

        It is worth noting that the Enhanced Fujita (EF) Scale, introduced in 2007, is an updated version of the original Fujita (F) Scale, which was developed by Dr. Theodore Fujita in 1971. The original F Scale was based on the damage caused by tornadoes to structures and vegetation, with ratings ranging from F0 to F5. However, the F Scale had some limitations, such as its subjective nature and the fact that it did not account for differences in building construction and materials.

        The EF Scale was developed to address these limitations and provide a more consistent and objective approach to tornado intensity classification. The EF Scale still uses damage surveys as the primary basis for ratings, but it also takes into account the quality of construction and the types of materials used in structures. Additionally, the wind speed ranges for each EF rating were adjusted based on the latest scientific understanding of the relationship between wind speeds and damage.

        Despite these improvements, the EF Scale still relies heavily on post-event damage surveys, which can be affected by factors such as the availability of damage indicators and the experience of the survey team. Incorporating mobile and close-range dual-pol radar data into the EF Scale could help to overcome these limitations and provide a more comprehensive and accurate assessment of tornado intensity.

        The impact of EF-5 tornadoes on communities is devastating, with long-lasting effects on infrastructure, economy, and the lives of those affected. The high death tolls associated with these tornadoes can be attributed to the extreme wind speeds, the amount of debris generated, and the difficulty in providing adequate warning and shelter.

        Advancements in tornado forecasting and warning systems have helped to reduce the loss of life from EF-5 tornadoes in recent years. However, the destructive power of these rare twisters remains a significant threat to life and property. Continued research into the formation and behavior of EF-5 tornadoes is crucial in improving our understanding and ability to mitigate their impact on communities.