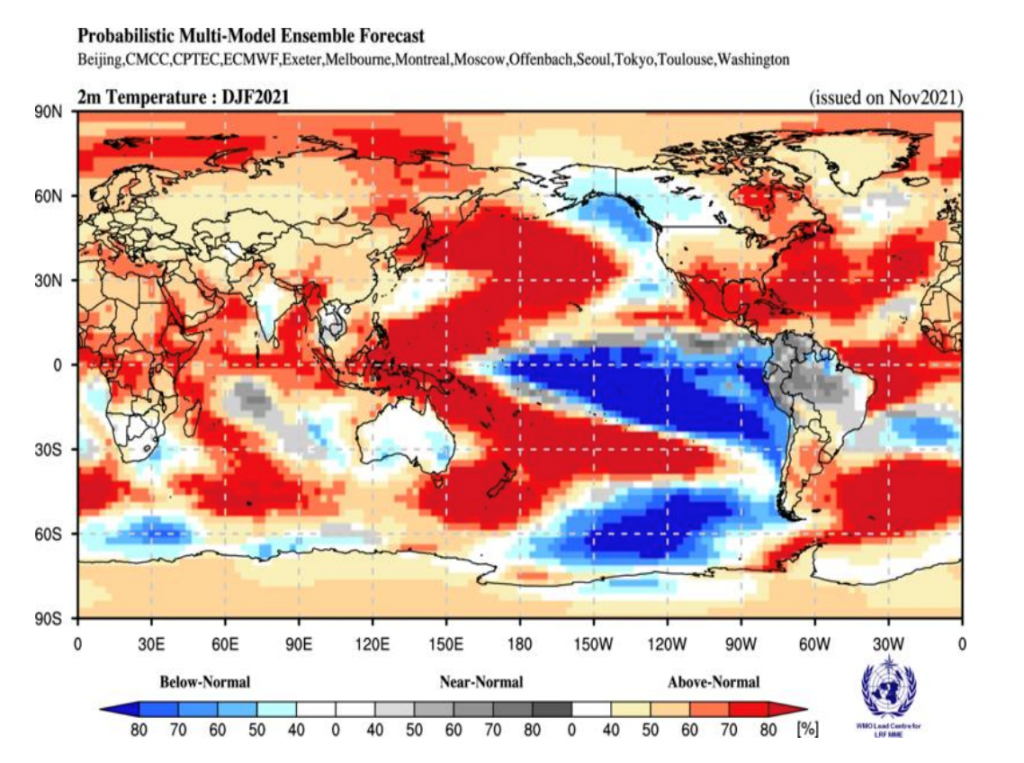
La Niña, a complex weather phenomenon, has a significant impact on the climate and weather patterns across the United States. This naturally occurring event is characterized by the cooling of the surface waters in the eastern equatorial Pacific Ocean, which alters atmospheric circulation and influences temperature and precipitation patterns worldwide.
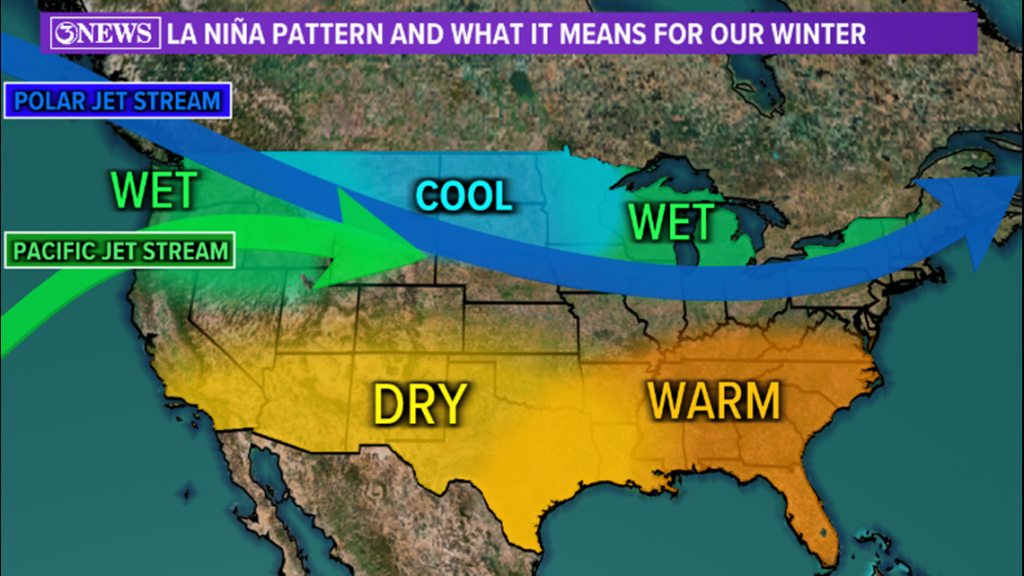
According to the National Oceanic and Atmospheric Administration (NOAA), during a La Niña event, the jet stream tends to shift northward, causing changes in the distribution of temperature and precipitation across the country. This shift often results in below-average temperatures and above-average precipitation in the northern parts of the United States, while the southern states experience warmer and drier conditions.
The Pacific Northwest and the northern Rockies are particularly affected by La Niña. These regions often experience colder temperatures and increased snowfall during the winter months. In fact, the NOAA Climate Prediction Center’s data suggests that during a La Niña winter, the chances of above-average snowfall in the Cascades and the northern Rockies can increase by as much as 40%.
On the other hand, the southern states, particularly the Southwest and the Gulf Coast, tend to experience warmer and drier conditions during a La Niña event. This can lead to an increased risk of drought and wildfires in these regions. In the winter of 2020-2021, which was influenced by a moderate La Niña, the U.S. Drought Monitor reported that over 40% of the contiguous United States experienced some level of drought, with the most severe conditions in the Southwest and the Great Plains.
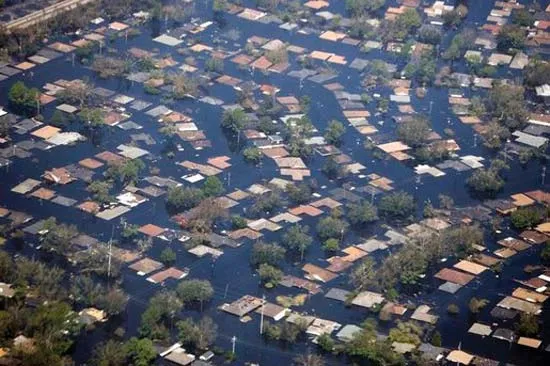
La Niña’s impact on the Atlantic hurricane season is also noteworthy. During a La Niña year, the atmospheric conditions in the Atlantic basin become more conducive to hurricane formation. Reduced wind shear and increased atmospheric instability allow tropical storms to develop and intensify more easily. The NOAA reported that the 2020 Atlantic hurricane season, which coincided with a La Niña event, was the most active on record, with 30 named storms, 13 of which became hurricanes.
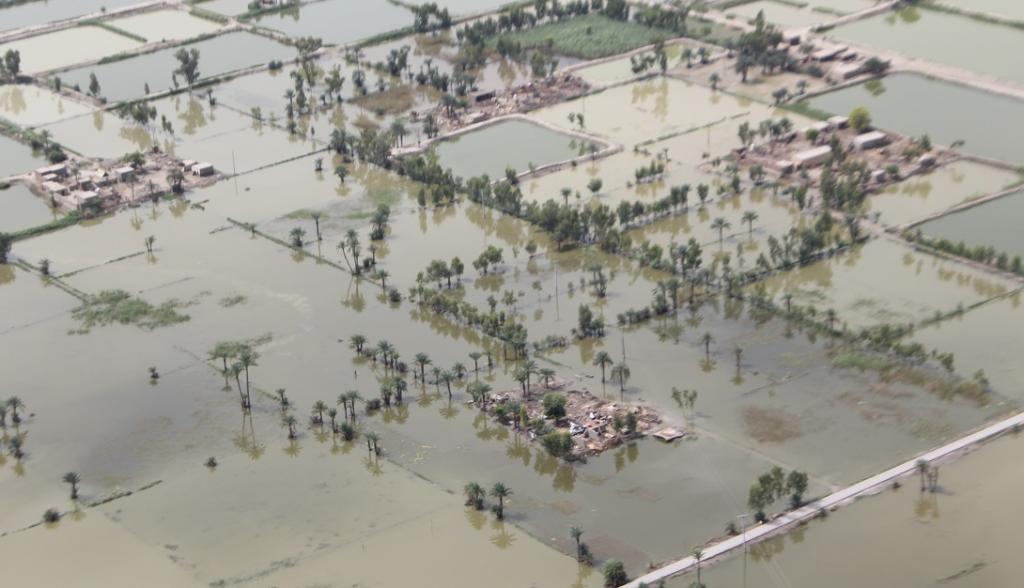
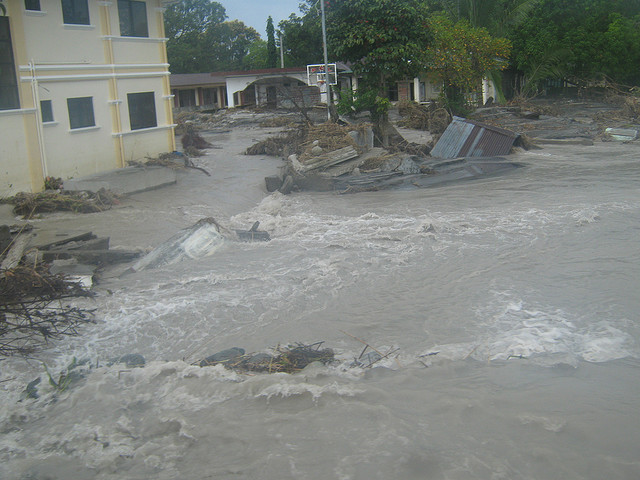
La Niña 2010-2011: This was a strong La Niña event. Its impacts included increased rainfall in the western Pacific, leading to floods in Australia, Indonesia, and the Philippines. Conversely, it brought drought conditions to parts of Africa and South America.
La Niña 2011-2012: Following the previous event, this one was weaker but still brought heavy rainfall to parts of Australia, contributing to flooding in Queensland. It also influenced weather patterns in the Americas, affecting rainfall in regions such as the southern United States.
La Niña 2016-2017: This was another strong La Niña episode. It caused wetter-than-average conditions in parts of Southeast Asia and Australia, contributing to flooding. It also influenced global temperature patterns, with cooler-than-average temperatures in some regions.
La Niña 2020-2021: This event began in late 2020 and continued into early 2021. It contributed to above-average rainfall in parts of Southeast Asia, leading to flooding in Indonesia and the Philippines. It also influenced weather patterns in the Americas, affecting precipitation in regions such as the southwestern United States and South America.
La Niña 2007-2008: This was a moderate La Niña event. It caused above-average rainfall in parts of Southeast Asia, leading to flooding in Indonesia and Malaysia. Australia also experienced wetter-than-average conditions during this period.
La Niña 2017-2018: Following the 2016-2017 La Niña event, this one was weaker but still had notable impacts. It influenced weather patterns in various regions, including increased rainfall in parts of South America, contributing to flooding in Peru and Colombia.
La Niña 2021-2022: This event began in late 2021 and continued into 2022. It brought above-average rainfall to parts of Southeast Asia, contributing to flooding in Indonesia and Malaysia. Australia also experienced wetter conditions during this period.
La Niña 2022-2023: This event occurred in the latter part of 2022 and extended into 2023. It had varying impacts globally, with some regions experiencing above-average rainfall and others facing drier conditions. For example, parts of South America and the southern United States saw increased precipitation, while parts of Africa and the Middle East experienced drier-than-average conditions.
Reed Timmer is a renowned meteorologist and extreme storm chaser who has dedicated his life to studying and documenting severe weather events. Born on March 17, 1980, in Grand Rapids, Michigan, Timmer developed a fascination with weather at a young age. He pursued his passion by earning a B.S. in Meteorology from the University of Oklahoma in 2002 and later obtained his Ph.D. in Meteorology from the same institution in 2015.
Timmer’s storm chasing career began in 1999 when he joined the University of Oklahoma’s storm chasing team. He quickly gained notoriety for his fearless approach to intercepting tornadoes and hurricanes, often placing himself in harm’s way to gather valuable data and capture stunning footage.
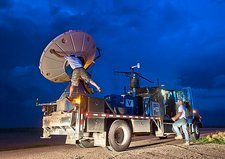
Timmer’s research focuses on collecting valuable data from within the heart of severe storms using state-of-the-art instruments, such as mobile tornado probes. By gathering this data, he has helped improve tornado forecasting and warning systems, ultimately saving lives and property. His innovative approach to storm chasing led him to design and build a series of armored vehicles called “Dominators,” which allow him and his team to safely navigate through the most intense weather conditions.
In addition to his scientific contributions, Timmer has played a significant role in educating the public about severe weather and storm safety. He has been featured in numerous television shows and documentaries, including “Storm Chasers” on the Discovery Channel and “Extreme Weather” on National Geographic. These appearances have helped raise awareness about the dangers of severe weather and the importance of being prepared.
Timmer’s commitment to education extends beyond the media. He frequently gives presentations at schools, universities, and community events, sharing his knowledge and experiences with audiences of all ages. His engaging and informative talks inspire future generations of meteorologists and emphasize the critical role that storm safety plays in protecting communities.
Beyond his research and educational efforts, Timmer has also ventured into entrepreneurship. He founded TVN Weather, a company that provides live severe weather video content to media outlets, allowing viewers to witness the power and beauty of extreme weather events from the safety of their homes. Additionally, he established SRV Dominator, which offers storm chasing tours and experiences to the public, giving individuals a unique opportunity to learn about severe weather firsthand.
In 2008, Timmer became a featured meteorologist on the Discovery Channel’s reality television series “Storm Chasers.” The show followed Timmer and his team as they pursued severe weather events across the United States. During his time on the show, Timmer showcased his expertise and innovative storm chasing techniques, including the use of armored vehicles like the “Dominator” to safely navigate through dangerous conditions.
Throughout his career, Timmer has witnessed and documented over 1,000 tornadoes and numerous hurricanes, including Hurricane Katrina in 2005 and Hurricane Harvey in 2017. His up-close footage of these powerful storms has provided valuable insights for the scientific community and has helped raise public awareness about the dangers of severe weather.
In addition to his storm chasing endeavors, Timmer is also an accomplished researcher. His doctoral thesis focused on the study of tornadoes and their environments using high-resolution radar data. Timmer’s research has contributed to a better understanding of tornado formation and has the potential to improve tornado warning systems.
As an educator, Timmer has taught meteorology courses at the University of Oklahoma and has been a guest lecturer at numerous universities and conferences worldwide. He is also the author of the book “Into the Storm: Violent Tornadoes, Killer Hurricanes, and Death-Defying Adventures in Extreme Weather,” which chronicles his experiences as a storm chaser and meteorologist.
Reed Timmer’s dedication to studying and documenting severe weather events has made him one of the most respected and well-known figures in the field of meteorology. His work has not only advanced our understanding of these powerful natural phenomena but has also helped to save lives by providing valuable information to the public and emergency management officials.
In today’s world, being prepared for changing weather conditions is crucial. Fortunately, there are numerous weather apps available that can help you stay informed and safe. Here are 20 game-changing weather apps you can’t afford to miss:
Dark Sky This app is known for its accurate hyperlocal forecasts and beautiful radar maps. It provides down-to-the-minute updates and alerts for precipitation, temperature, and severe weather events, making it a reliable choice for staying on top of changing weather conditions.
Hail No Defend yourself from hailstorms with Hail No, the first hail app to provide real-time tracking and alert notifications. See where the hail is, create a defensive radius around any location, and get automatic alerts. Hail No provides access to the National Severe Storms Laboratory hail algorithm, the most accurate available, ensuring you’re always aware of potential hail threats. Apple: https://apps.apple.com/us/app/hail-no/id1469253867
WeatherBug WeatherBug is a comprehensive weather app that offers real-time weather data, radar maps, and severe weather alerts. It also includes features like pollen and air quality forecasts, making it a great choice for those with allergies or respiratory issues. Stay informed about changing weather conditions and potential health impacts with WeatherBug.
Tornado Vision See severe weather with augmented reality! Tornado Vision can help you see tornadoes hiding in the rain or at night. Simply point your phone at any severe storm, and you’ll get a heads-up display on what is happening inside the storm. This groundbreaking weather technology provides information on the chance of a tornado, hail size, wind speed, and more, right on your screen. iOS: https://apps.apple.com/us/app/tornado-vision/id1469550036 Android: https://play.google.com/store/apps/details?id=com.tornadovision.app.presentation&hl=en&gl=US&pli=1
RadarScope Designed for weather enthusiasts and professionals, RadarScope is a powerful radar app that provides high-resolution radar data, storm tracking, and advanced analysis tools. Dive deep into weather data and gain a comprehensive understanding of weather patterns with this feature-rich app.
Predict Now Predict Now is a powerful weather app that provides hyperlocal forecasts and real-time alerts for severe weather events. With its user-friendly interface and advanced features, you can stay ahead of the game and plan your activities accordingly, ensuring you’re always prepared for changing weather conditions. Apple: https://apps.apple.com/us/app/predict-now/id1481839520
NOAA Weather Radar Live This free app provides access to real-time weather radar data from the National Oceanic and Atmospheric Administration (NOAA). Stay informed about severe weather events in your area with up-to-date radar information from a trusted source.
Weather Underground Weather Underground is a comprehensive weather app that offers hyperlocal forecasts, radar maps, and severe weather alerts. It also includes a community feature that allows users to share weather observations and photos, creating a collaborative weather-tracking experience.
AccuWeather AccuWeather is a popular weather app known for its accurate forecasts and user-friendly interface. It provides detailed weather information, including hourly and daily forecasts, radar maps, and severe weather alerts, ensuring you have all the information you need to plan your day.
The Weather Channel The Weather Channel app is a reliable source for weather information, offering forecasts, radar maps, and severe weather alerts. It also includes features like hurricane tracking and ski resort conditions, making it a versatile choice for various weather-related activities.
Clime: NOAA Weather Radar Clime: NOAA Weather Radar is a free app that provides access to real-time weather radar data from NOAA. Stay informed about severe weather events in your area with this simple yet effective app.
MyRadar Weather Radar MyRadar Weather Radar is a powerful app that offers high-resolution radar data, severe weather alerts, and customizable settings. Tailor the app to your specific needs and get a detailed view of weather conditions in your area.
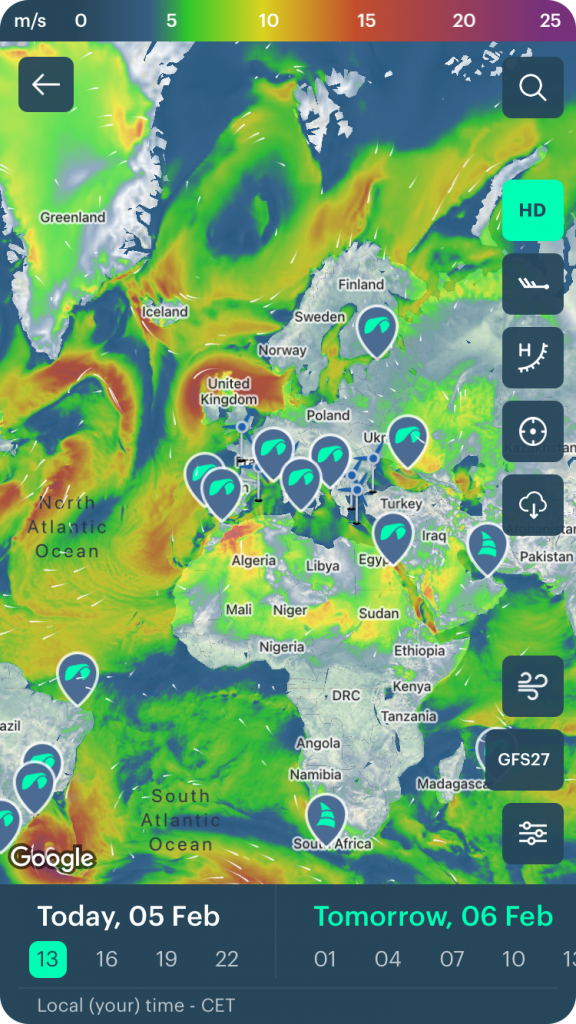
Windy Windy is a unique weather app that focuses on wind forecasts and patterns. It provides detailed wind maps, as well as forecasts for temperature, precipitation, and other weather conditions, making it an excellent choice for outdoor enthusiasts and those interested in wind-related activities.
Weather Mate Weather Mate is a comprehensive weather app that offers hyperlocal forecasts, radar maps, and severe weather alerts. It also includes features like air quality and pollen forecasts, making it a great choice for those with allergies or respiratory issues. Stay informed about weather conditions and potential health impacts with this all-in-one app.
Carrot Weather Carrot Weather is a unique weather app that combines accurate forecasts with a quirky and humorous personality. It provides detailed weather information, including hourly and daily forecasts, radar maps, and severe weather alerts, all delivered with a touch of humor to make weather tracking more enjoyable.
Storm Radar Storm Radar is a powerful app that provides real-time radar data, severe weather alerts, and storm tracking capabilities. Stay informed about severe weather events in your area and track storms with this comprehensive app.
Weather Live Weather Live is a comprehensive weather app that offers hyperlocal forecasts, radar maps, and severe weather alerts. It also includes features like air quality and pollen forecasts, making it a great choice for those with allergies or respiratory issues. Stay informed about weather conditions and potential health impacts with this versatile app.
Flowx Flowx is a unique weather app that focuses on visualizing weather patterns and forecasts. It provides detailed weather information, including wind patterns, precipitation, and temperature, in a visually stunning format, making it an excellent choice for those who appreciate beautiful data visualization.
Weather Maps Weather Maps is a powerful app that provides detailed weather maps and forecasts for various weather conditions, including precipitation, temperature, wind, and more. Get a comprehensive view of weather patterns with this data-rich app.
Weather Radar by ICM Weather Radar by ICM is a free app that provides access to real-time weather radar data from various sources, including NOAA and Environment Canada. Stay informed about severe weather events in your area with this simple yet effective app.
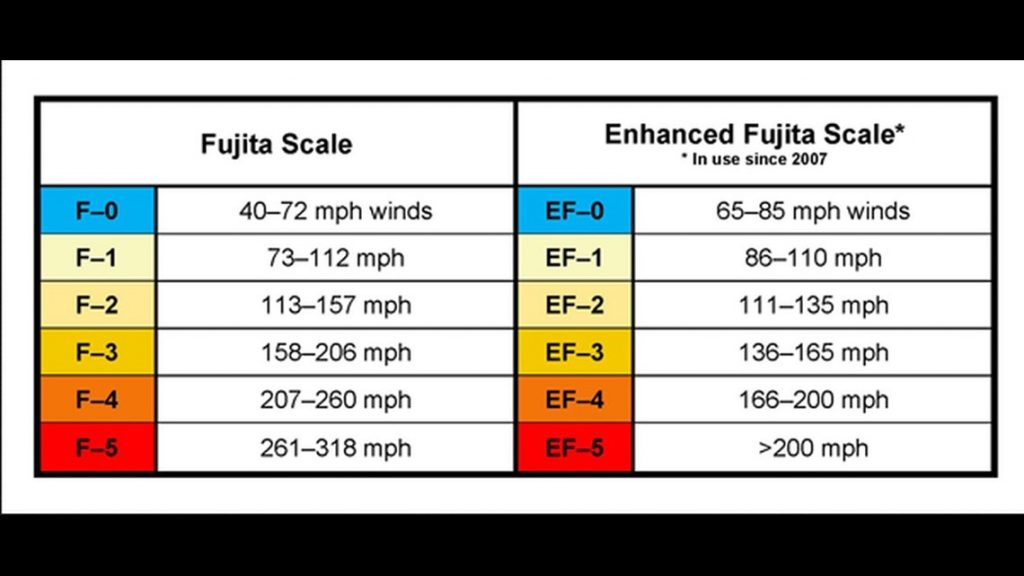
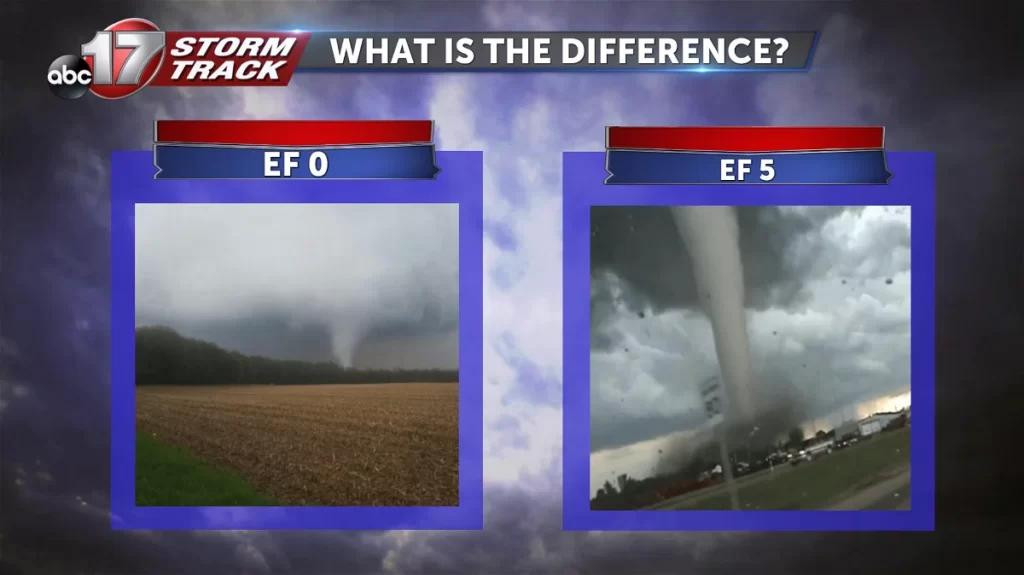
The Enhanced Fujita (EF) Scale is a system used to classify the strength of tornadoes based on the damage they cause to structures and vegetation. Developed in 2007 as an update to the original Fujita Scale, the EF Scale provides a more precise and comprehensive method for assessing tornado intensity. The EF Scale consists of six categories, ranging from EF0 to EF5, with EF0 being the weakest and EF5 being the strongest. Each category is defined by specific wind speed ranges and the corresponding damage expected at those wind speeds.
EF0 (65-85 mph): These tornadoes cause light damage, such as broken tree branches, shallow rooted trees being toppled, and minor damage to chimneys or sign boards
EF1 (86-110 mph): Moderate damage occurs, including roof surfaces being peeled off, mobile homes being pushed off foundations or overturned, and exterior doors and windows being damaged.
EF2 (111-135 mph): Considerable damage is observed, with roofs torn off well-constructed houses, mobile homes completely destroyed, large trees snapped or uprooted, and light objects becoming projectiles.
EF3 (136-165 mph): Severe damage happens, including entire stories of well-constructed houses being destroyed, trains overturned, and forests being heavily damaged.
EF4 (166-200 mph): Devastating damage takes place, with well-constructed houses being leveled, structures with weak foundations blown away, and cars thrown.
EF5 (>200 mph): Incredible damage occurs, with strong frame houses being lifted off foundations and carried considerable distances, automobile-sized missiles flying through the air, and trees being debarked.
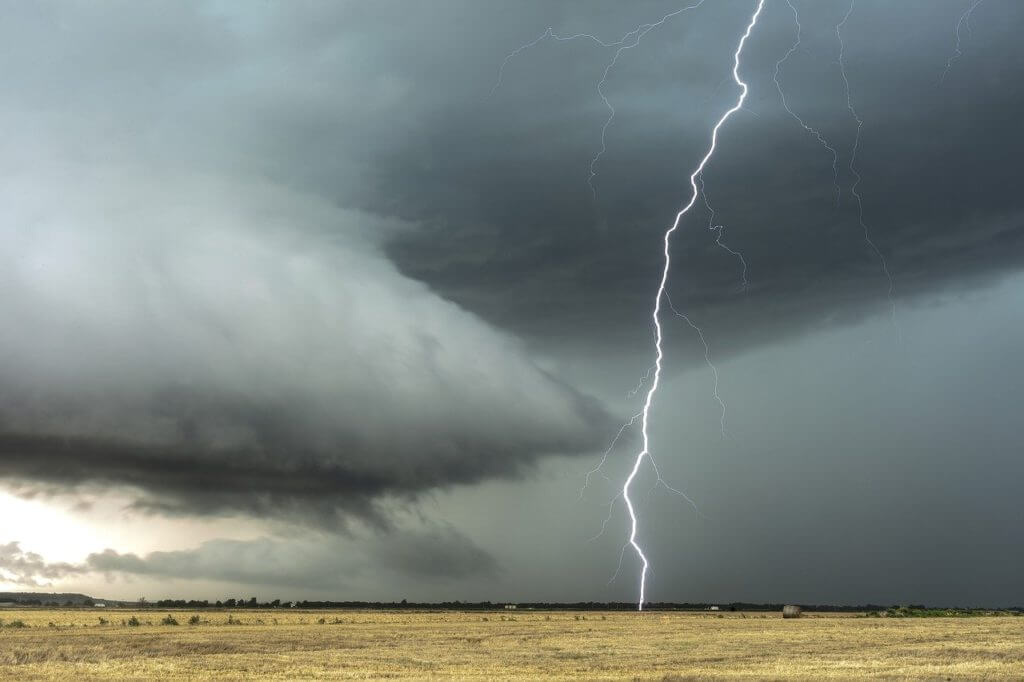
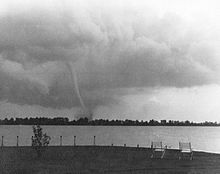
Canada, known for its diverse landscapes and vast expanses, is also home to a unique meteorological phenomenon – severe thunderstorms and tornadoes. While storm chasing is more commonly associated with the United States, particularly in the infamous “Tornado Alley,” Canada experiences its fair share of severe weather events, attracting both professional meteorologists and amateur storm chasers.
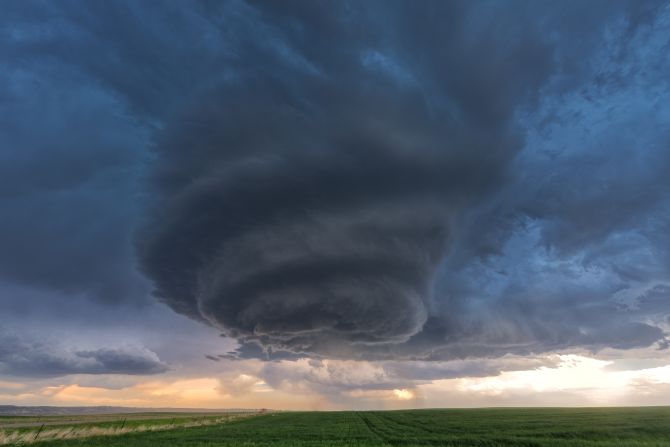
Meteorology Behind Canadian Storm Chasing The formation of severe thunderstorms and tornadoes in Canada is primarily influenced by the collision of contrasting air masses. During the summer months, warm, moist air from the Gulf of Mexico and the United States Great Plains often clashes with cooler, drier air from the Arctic. This collision creates instability in the atmosphere, leading to the development of powerful supercell thunderstorms.
Additionally, Canada’s unique topography plays a role in storm formation. The prairies, with their flat, open landscapes, allow for uninterrupted wind flow and the creation of strong updrafts necessary for tornado development. The presence of the Rocky Mountains to the west also contributes to the formation of severe weather, as the mountains can help channel and intensify storm systems.
Prime Storm Chasing Locations in Canada
Southern Ontario: This region, particularly the area extending from Windsor to Toronto, experiences the highest frequency of tornadoes in Canada. The proximity to the Great Lakes and the convergence of air masses make this area a hotspot for severe weather.
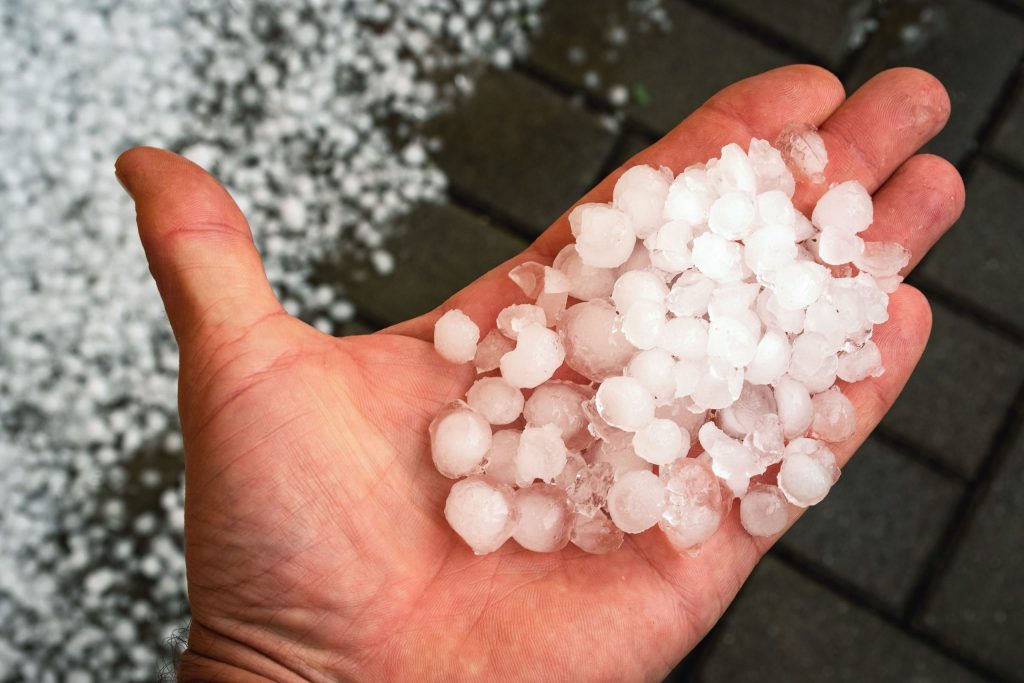
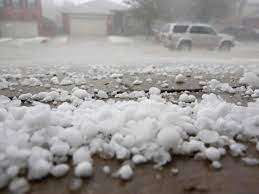
Alberta: Known as “Hailstorm Alley,” central and southern Alberta often experience severe thunderstorms capable of producing large hail, damaging winds, and occasional tornadoes. Cities like Calgary and Red Deer are prime locations for storm chasers.
Saskatchewan: The southern portions of Saskatchewan, especially along the border with the United States, are prone to severe thunderstorms and tornadoes. The flat, open prairies provide an ideal environment for storm development.
Manitoba: Similar to Saskatchewan, southern Manitoba experiences severe weather due to its location and topography. The Red River Valley, in particular, is a corridor for intense storm systems.
Tornado Statistics by Province According to Environment and Climate Change Canada, the average number of reported tornadoes per year in each province is as follows:
Ontario: 12-18
Alberta: 10-15
Saskatchewan: 8-12
Manitoba: 6-10
Quebec: 4-8
New Brunswick: 1-2
British Columbia: 0-1
Nova Scotia: 0-1
Prince Edward Island: 0-1
Newfoundland and Labrador: 0-1
It is important to note that these numbers are based on reported tornadoes and may not reflect the actual occurrence, as some tornadoes in remote areas may go undetected.
Storm chasing in Canada is a thrilling and scientifically valuable pursuit, but it also comes with inherent risks. Chasers must be well-prepared, equipped with proper safety gear, and knowledgeable about severe weather dynamics. It is crucial to respect the power of nature and prioritize personal safety above all else.
As climate change continues to influence weather patterns worldwide, studying severe weather events in Canada becomes increasingly important.
Top 5 Weather Events in Canada
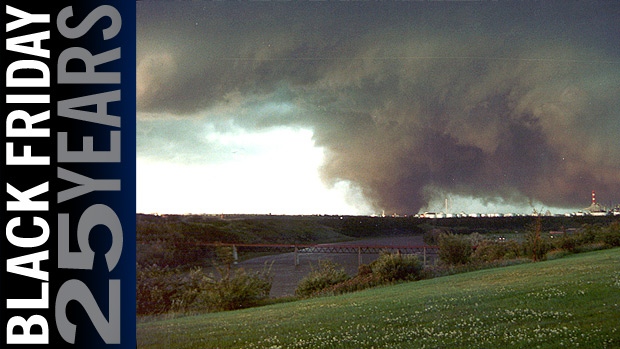
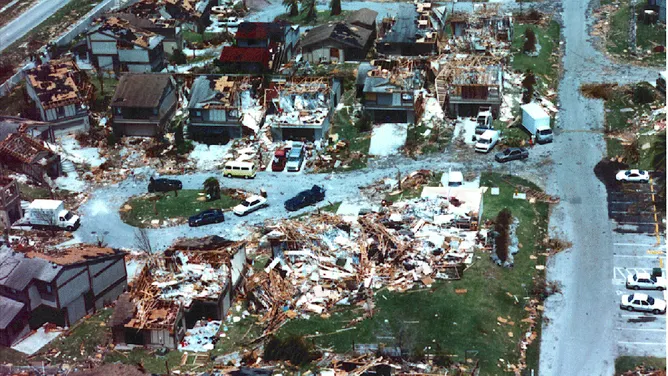
Edmonton Tornado (July 31, 1987) Also known as “Black Friday,” this devastating F4 tornado struck eastern Edmonton, Alberta, causing 27 fatalities, injuring over 300 people, and resulting in an estimated $330 million in damages (adjusted for inflation). It remains the deadliest tornado in Canadian history and one of the most destructive in terms of property damage.
Pine Lake Tornado (July 14, 2000) An F3 tornado touched down near Pine Lake, a popular camping area in central Alberta, claiming 12 lives and injuring over 100 people. The tornado caused widespread damage to the Green Acres Campground, destroying numerous trailers and vehicles. It is the second-deadliest tornado in Canadian history.
Windsor – Tecumseh, Ontario Tornado (June 17, 1946) This powerful F4 tornado struck the towns of Windsor and Tecumseh in southwestern Ontario, causing 17 fatalities and over 200 injuries. It remains the third-deadliest tornado in Canadian history and caused significant damage to residential areas and infrastructure.
Calgary Hailstorm (June 13, 2020) A severe thunderstorm produced large hail over Calgary, Alberta, causing an estimated $1.2 billion in insured damages, making it the fourth-costliest natural disaster in Canadian history. The hailstorm damaged numerous homes, vehicles, and buildings across the city.
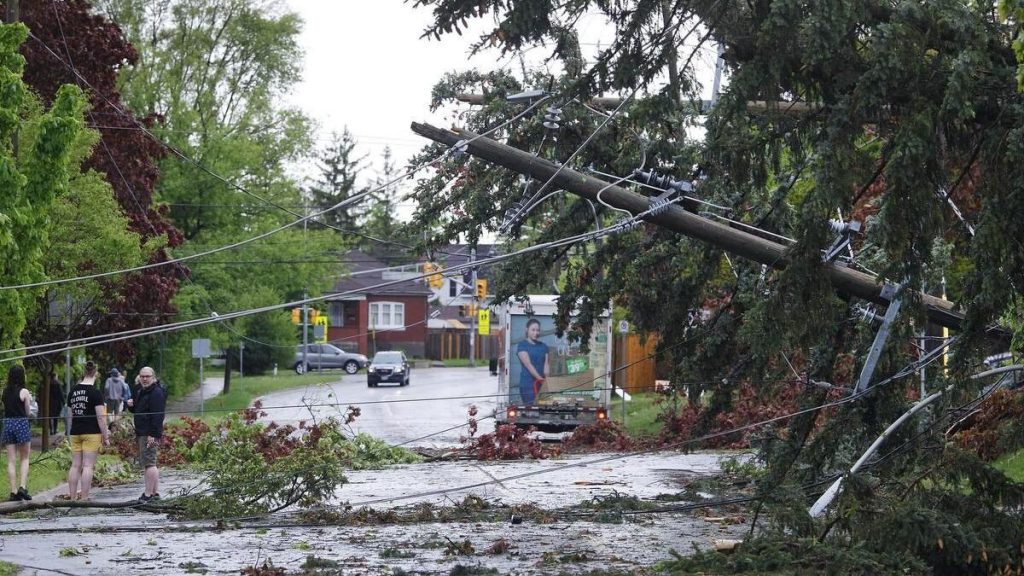
Southern Ontario Derecho (May 21, 2022) A powerful derecho, a widespread and long-lived windstorm associated with a line of severe thunderstorms, swept across southern Ontario, causing significant damage and power outages. The storm resulted in 10 fatalities and affected major cities such as Toronto, Ottawa, and London. Wind gusts exceeding 120 km/h were recorded, and the event is considered one of the most impactful derechos in Canadian history.
Well-known Storm Chasers in Canada:
Mark Robinson: A meteorologist and storm chaser based in Ontario, Robinson is the founder of The Weather Network’s “Storm Hunters” team. He has been chasing storms across Canada and the United States for over two decades.
Greg Johnson: Known as “Tornado Hunter,” Johnson is a Saskatchewan-based storm chaser and photographer who has been documenting severe weather events for more than 20 years. His work has been featured in numerous publications and documentaries.
Justin Hobson: A storm chaser and photographer based in Alberta, Hobson is known for his stunning images of severe weather events across the Canadian Prairies.
Weather Radar Network and Forecast Models: Environment and Climate Change Canada (ECCC) operates the Canadian weather radar network, which consists of 31 Doppler radars across the country. These radars provide real-time data on precipitation intensity, wind velocity, and storm structure, aiding in the detection and tracking of severe weather events. ECCC also utilizes several forecast models to predict weather patterns and severe weather potential:
Global Environmental Multiscale (GEM) Model: This is the primary forecast model used by ECCC, providing short-range and medium-range weather forecasts for Canada and the world. High Resolution Deterministic Prediction System (HRDPS): A high-resolution model that provides detailed short-range forecasts for specific regions in Canada, focusing on severe weather events. Canadian Precipitation Analysis (CaPA): A system that combines radar, satellite, and surface observations to provide a comprehensive analysis of precipitation across Canada.
Links:
Environment and Climate Change Canada Weather Radar: https://weather.gc.ca/radar/index_e.html Canadian Centre for Meteorological and Environmental Prediction: https://weather.gc.ca/ensemble/index_e.html The Weather Network Storm Hunters: https://www.theweathernetwork.com/ca/news/storm-hunters Greg Johnson Tornado Hunter: https://tornadohunter.com/ Justin Hobson Photography: https://justinhobson.ca/
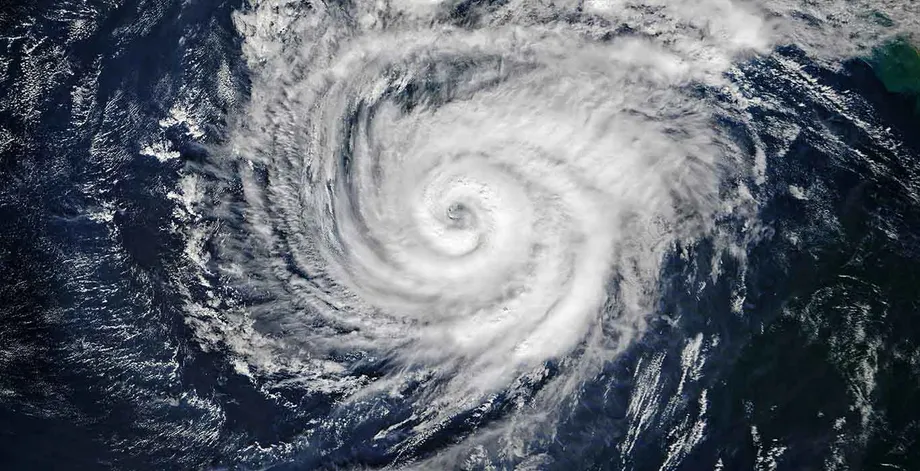
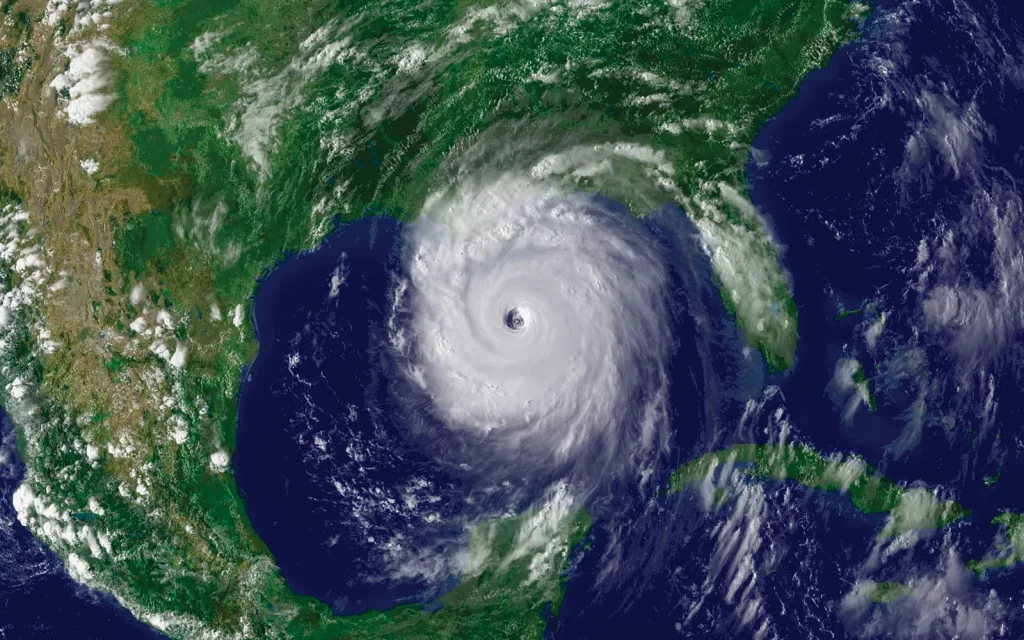
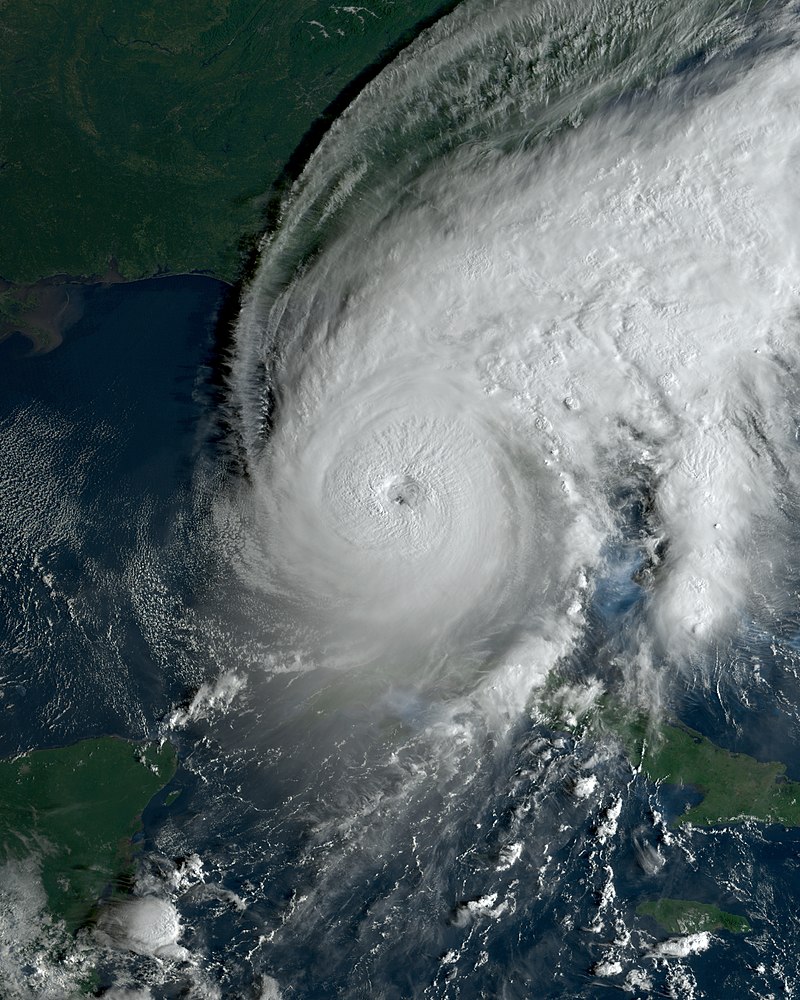
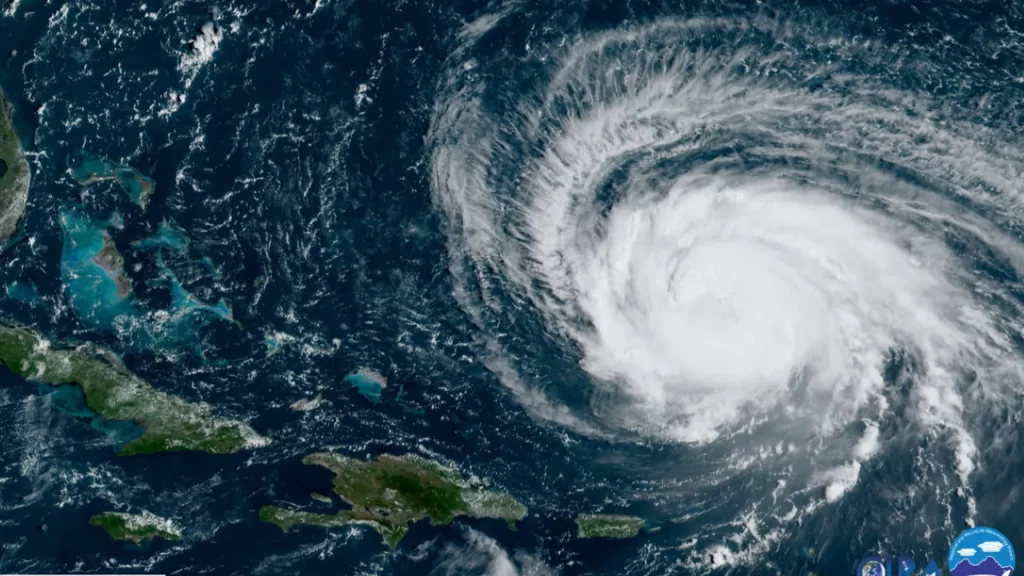
1.1 What is a hurricane? A hurricane is a type of tropical cyclone, which is a rotating, organized system of clouds and thunderstorms that originates over tropical or subtropical waters. Hurricanes are characterized by a low-pressure center, high winds, and heavy rainfall. In the North Atlantic Ocean, Caribbean Sea, and the eastern North Pacific Ocean, these storms are called hurricanes. In other parts of the world, they may be referred to as typhoons or tropical cyclones, depending on their location.
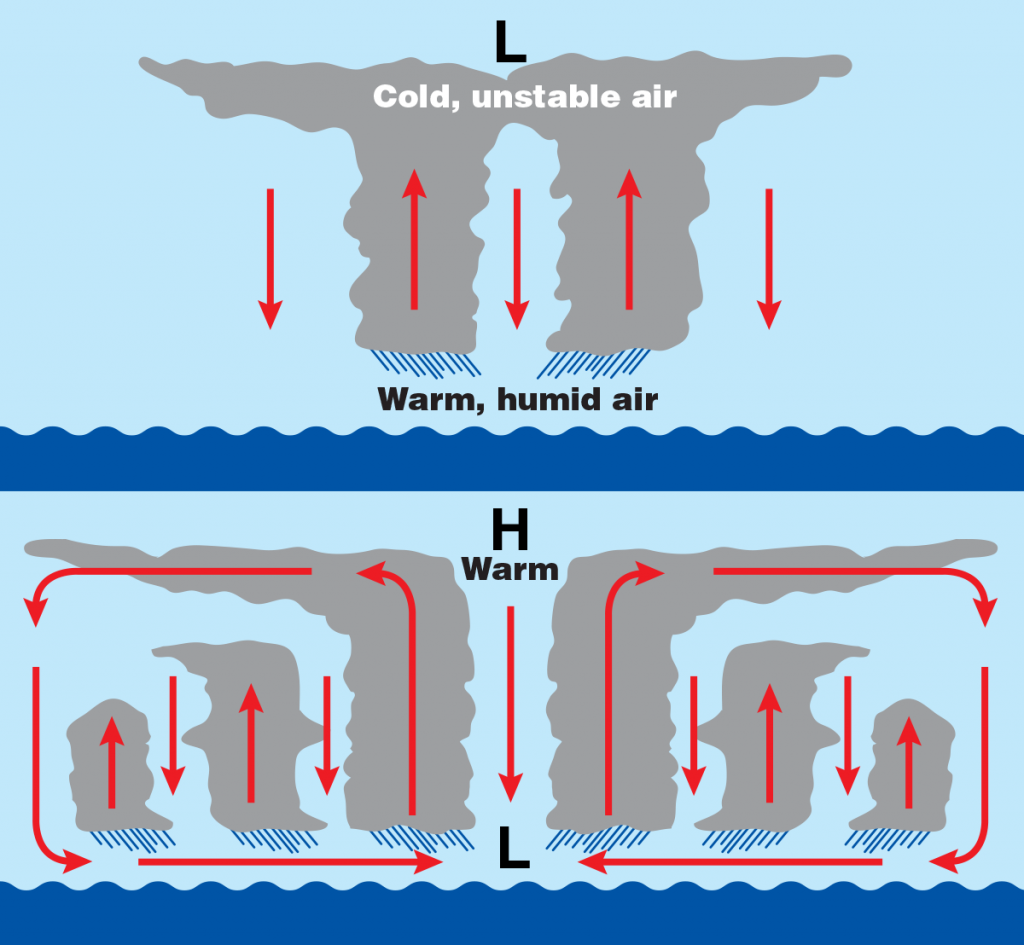
1.2 How do hurricanes form? Hurricanes form when specific atmospheric and oceanic conditions are met. The key factors that contribute to hurricane formation include: a. Warm ocean water (at least 26.5°C or 79.7°F) to a depth of about 50 meters b. Atmospheric instability, which allows the warm, moist air to rise and form thunderstorms c. Sufficient Coriolis force, which causes the storm to rotate (this force is minimal near the equator) d. A pre-existing disturbance, such as a tropical wave or a low-pressure system e. Low wind shear, which allows the storm to maintain its vertical structure
When these conditions are present, the warm, moist air rises, creating an area of low pressure near the surface. As the air continues to rise, it cools and condenses, forming clouds and thunderstorms. The rotation of the Earth and the Coriolis force cause the storm to spin, and as the system becomes more organized, it can intensify into a tropical depression, tropical storm, or hurricane.
1.3 The life cycle of a hurricane Hurricanes typically go through four stages of development: a. Tropical disturbance: An area of low pressure with thunderstorms, but no organized circulation b. Tropical depression: A low-pressure system with sustained winds of up to 38 mph (61 km/h) c. Tropical storm: A more organized system with sustained winds between 39 and 73 mph (63 to 118 km/h) d. Hurricane: A well-defined, rotating storm with sustained winds of 74 mph (119 km/h) or higher
Once a hurricane makes landfall or moves over cooler waters, it begins to weaken and eventually dissipates.
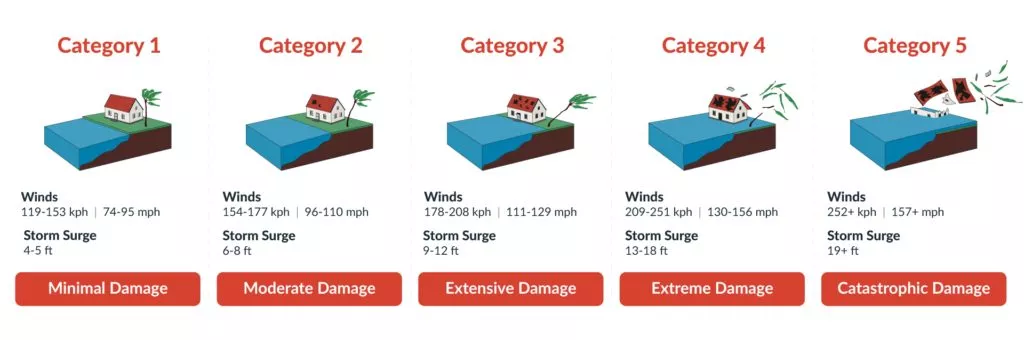
1.4 Categories of hurricane intensity Hurricanes are classified into five categories based on their maximum sustained wind speeds, using the Saffir-Simpson Hurricane Wind Scale:
Category 1: 74-95 mph (119-153 km/h)
Category 2: 96-110 mph (154-177 km/h)
Category 3: 111-129 mph (178-208 km/h)
Category 4: 130-156 mph (209-251 km/h)
Category 5: 157 mph (252 km/h) or higher
It is important to note that the Saffir-Simpson scale only measures wind speed and does not account for the potential damage caused by storm surge, rainfall, or other factors. Lower-category hurricanes can still cause significant damage and loss of life, particularly due to flooding and storm surge.
Part 2: Data Collection and Analysis
2.1 Observing and measuring hurricanes To accurately forecast hurricanes, scientists rely on various data collection methods to observe and measure the storms’ characteristics and the surrounding environment. The main tools used for this purpose are:
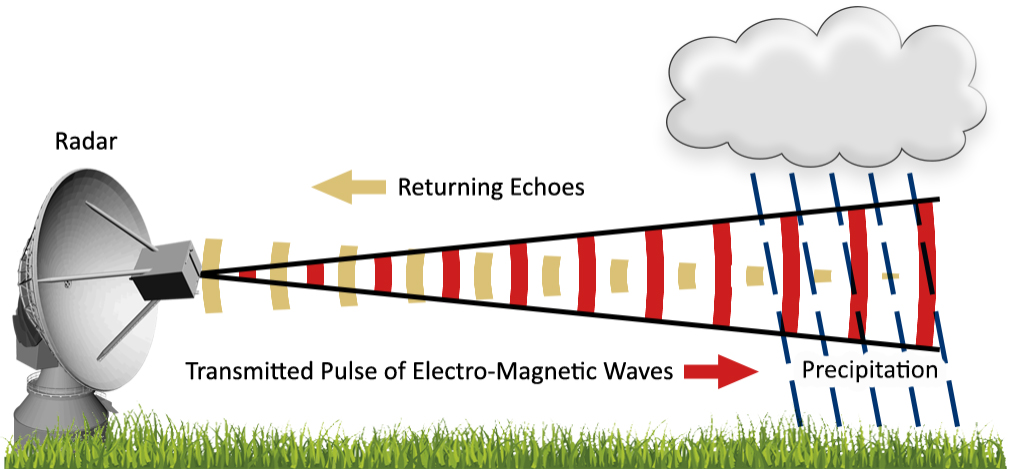
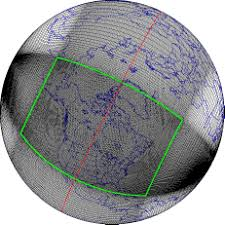
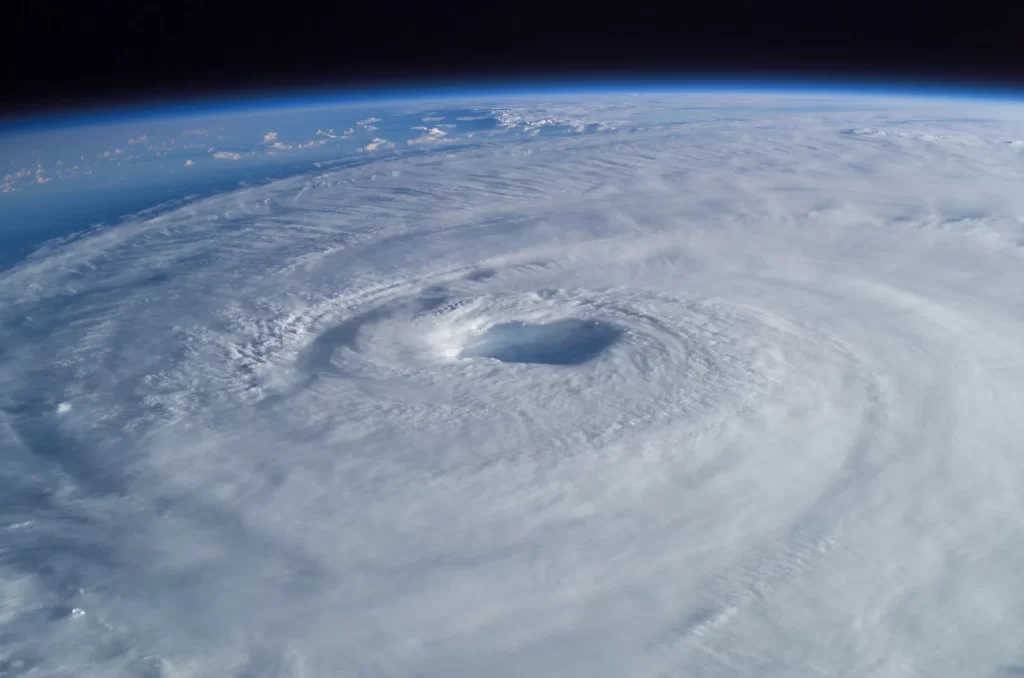
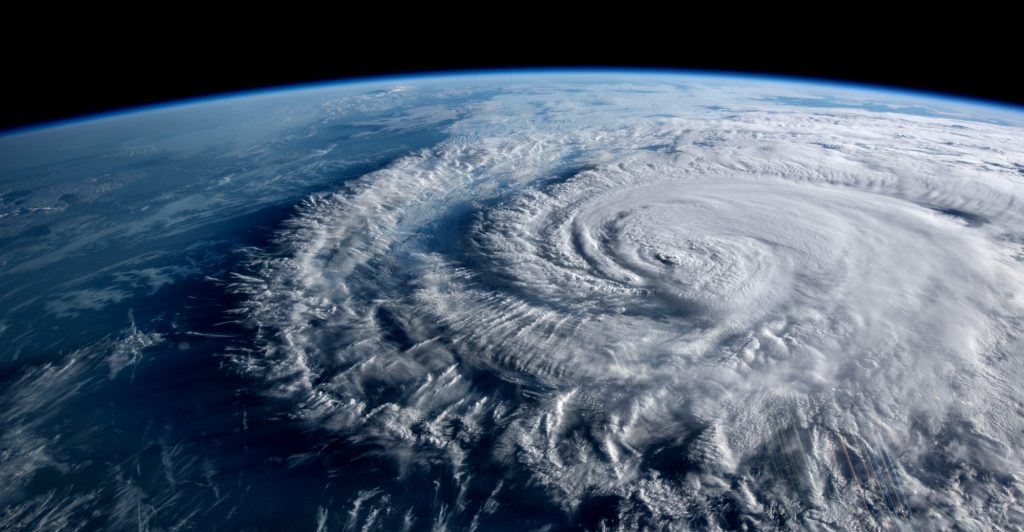
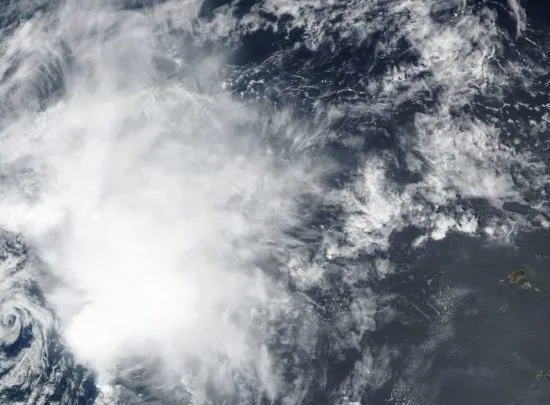
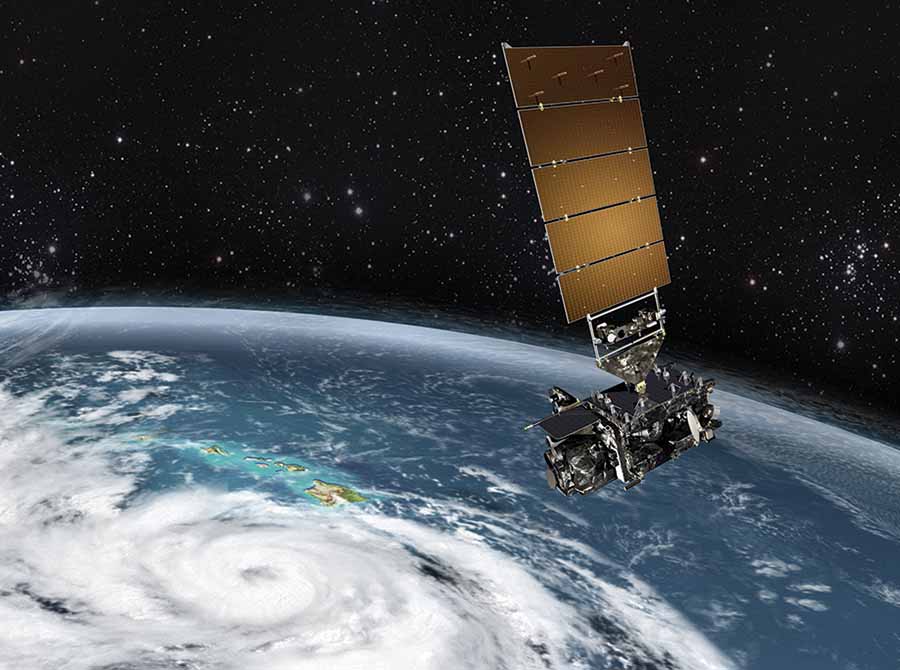
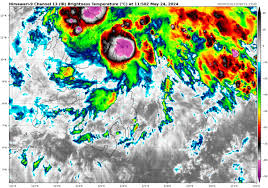
2.1.1 Satellite imagery Satellites provide a comprehensive view of hurricanes from space, allowing forecasters to monitor their development, track their movement, and estimate their intensity. Visible and infrared satellite images help identify the storm’s structure, size, and cloud patterns. Microwave imagery can penetrate through clouds, providing information about the storm’s internal structure and rainfall rates.
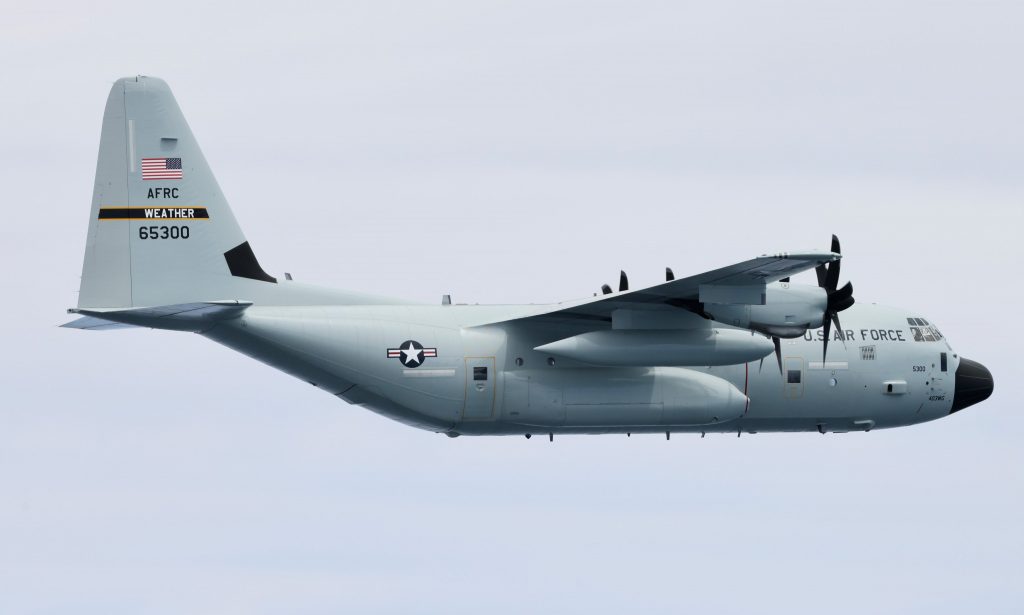
2.1.2 Aircraft reconnaissance Specially equipped aircraft, such as the U.S. Air Force Reserve’s Hurricane Hunters, fly directly into hurricanes to collect valuable data. These aircraft measure wind speed, air pressure, temperature, and humidity at various altitudes within and around the storm. They also deploy instruments called dropsondes, which measure atmospheric conditions as they descend to the ocean surface.
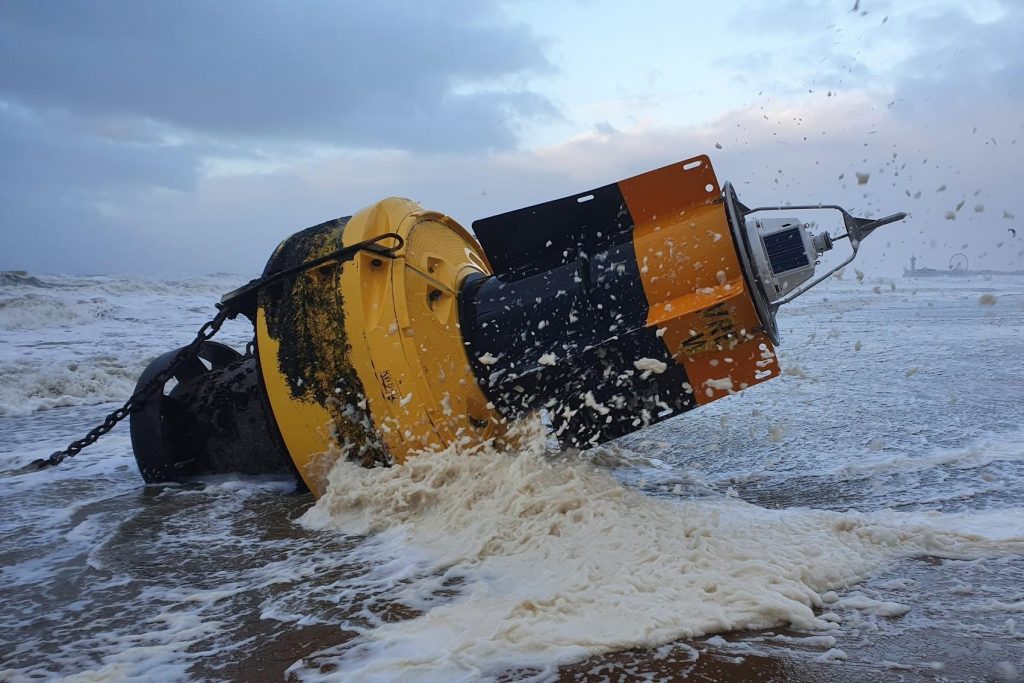
2.1.3 Buoys and weather stations Buoys and weather stations in the ocean and on land provide essential data about surface conditions, such as wind speed, air pressure, and sea surface temperature. These measurements help forecasters understand the storm’s interaction with its environment and assess its potential for intensification.
2.2 Analyzing atmospheric and oceanic conditions In addition to directly observing hurricanes, forecasters analyze various atmospheric and oceanic conditions that influence hurricane development and behavior. Some of the key factors considered are:
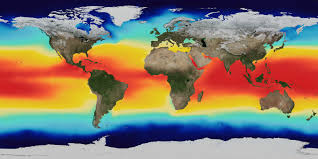
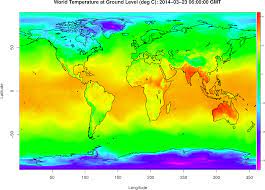
2.2.1 Sea surface temperature Warm ocean water, typically above 26.5°C (79.7°F), is essential for hurricane formation and intensification. Forecasters monitor sea surface temperatures using satellite data and buoy measurements to identify areas that are conducive to hurricane development.
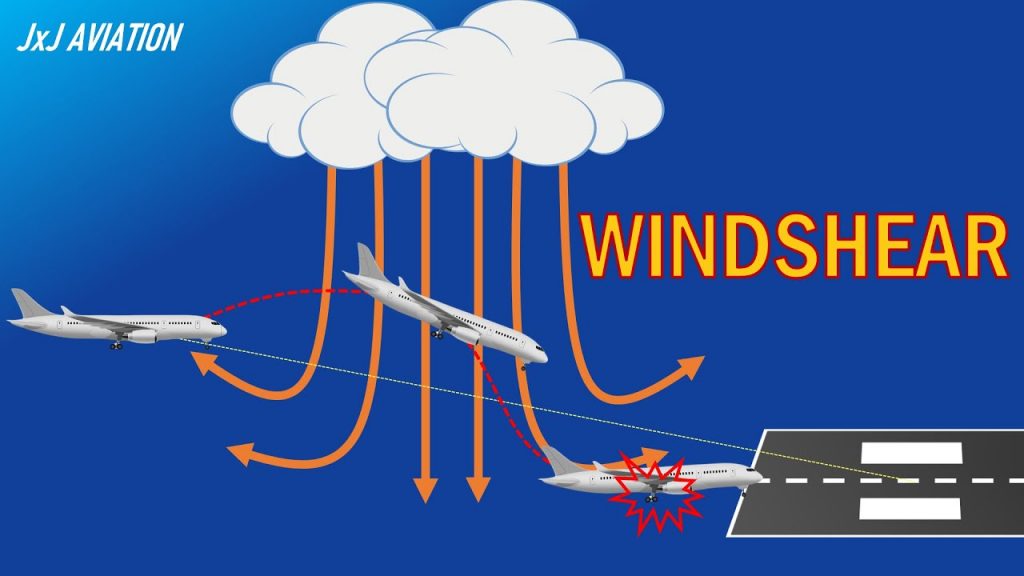
2.2.2 Wind shear Wind shear refers to the change in wind speed or direction with height in the atmosphere. High wind shear can disrupt the vertical structure of a hurricane, causing it to weaken or dissipate. Forecasters assess wind shear using satellite data, weather balloon observations, and numerical weather models.
2.2.3 Atmospheric pressure Hurricanes are characterized by low air pressure at their center. Forecasters monitor changes in atmospheric pressure using barometers on buoys, ships, and land-based weather stations. A rapid drop in pressure often indicates that a storm is intensifying.
2.3 Historical data and trends Analyzing historical hurricane data and trends is crucial for improving our understanding of these storms and refining forecasting techniques. Scientists study past hurricane seasons, landfall locations, intensities, and tracks to identify patterns and relationships with atmospheric and oceanic conditions. This information helps forecasters develop statistical models and analog forecasts based on similar historical situations. Additionally, examining long-term trends in hurricane activity can provide insights into the potential impacts of climate change on hurricane frequency and intensity.
By collecting and analyzing a wide range of data from multiple sources, forecasters can build a comprehensive picture of a hurricane’s current state and its likely future behavior. This information forms the foundation for the development and application of forecasting models and techniques, which will be discussed in the next part of this guide.
Part 3: Forecasting Models and Techniques
Forecasting hurricanes involves using various models and techniques to predict the track, intensity, and potential impacts of these storms. Meteorologists and researchers rely on a combination of statistical and dynamical models to generate forecasts.
3.1 Statistical models Statistical models, also known as statistical-dynamical models, use historical data on past hurricanes and their relationships with environmental variables to predict the behavior of current storms. These models consider factors such as sea surface temperature, atmospheric pressure, and wind shear to estimate the likelihood of hurricane formation, intensification, and movement. Some examples of statistical models include: a. Statistical Hurricane Intensity Prediction Scheme (SHIPS) b. Logistic Growth Equation Model (LGEM) c. Rapid Intensification Index (RII)
Statistical models are generally less computationally intensive than dynamical models and can provide quick guidance on hurricane behavior. However, they may not capture the full complexity of hurricane dynamics and can be limited by the quality and quantity of historical data.
3.2 Dynamical models Dynamical models, also called numerical weather prediction models, use mathematical equations to simulate the physical processes that govern hurricane formation and evolution. These models divide the atmosphere and ocean into grid cells and solve equations that describe the motion of air and water, as well as the transfer of heat and moisture. Dynamical models can be further categorized into two types:
3.2.1 Global models Global models simulate the entire Earth’s atmosphere and oceans, providing a comprehensive view of the large-scale environmental conditions that influence hurricane behavior. Some examples of global models include: a. Global Forecast System (GFS) b. European Centre for Medium-Range Weather Forecasts (ECMWF) c. Navy Global Environmental Model (NAVGEM)
Global models have a relatively coarse spatial resolution, typically ranging from 10 to 50 kilometers between grid points. They are useful for identifying large-scale patterns and long-term trends but may not capture the finer details of hurricane structure and intensity.
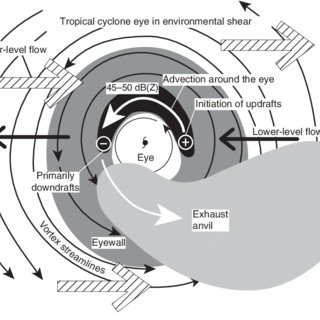
3.2.2 Regional models Regional models, also known as limited-area models or mesoscale models, focus on a specific region of interest and provide higher-resolution simulations of hurricane behavior. These models use boundary conditions from global models but can resolve smaller-scale features such as hurricane eye structure and rainbands. Some examples of regional models include: a. Hurricane Weather Research and Forecasting (HWRF) Model b. Hurricanes in a Multi-scale Ocean-coupled Non-hydrostatic (HMON) Model c. Advanced Hurricane WRF (AHW) Model
Regional models typically have a spatial resolution of 1 to 10 kilometers, allowing for more detailed predictions of hurricane track, intensity, and structure. However, they are computationally expensive and may have shorter lead times compared to global models.
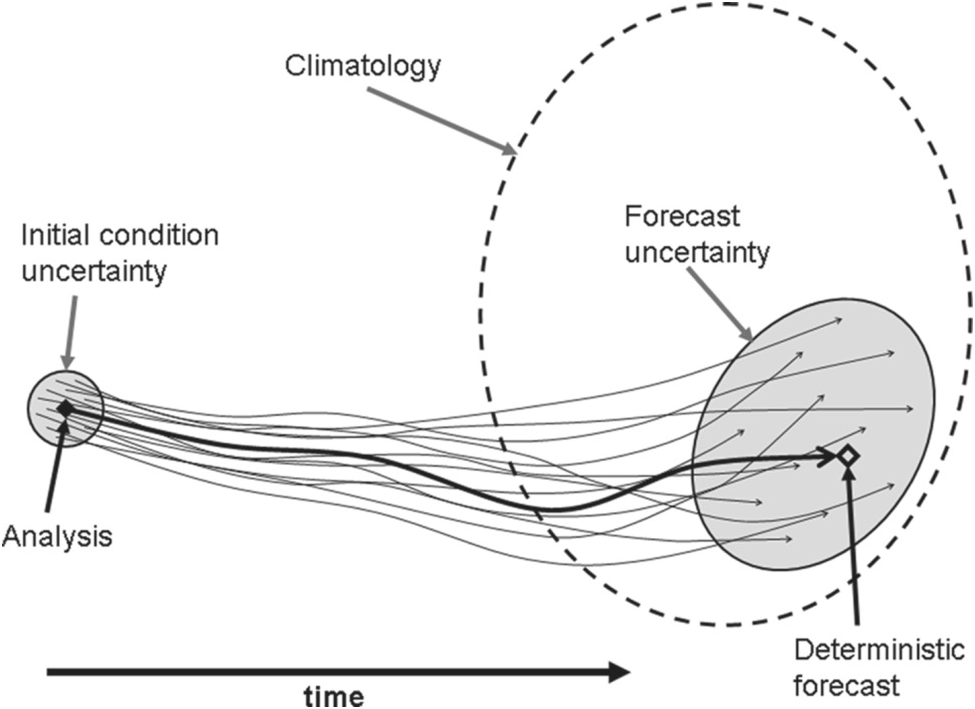
3.3 Ensemble forecasting Ensemble forecasting involves running multiple simulations of a hurricane using slightly different initial conditions, model physics, or model types. By generating a range of possible outcomes, ensemble forecasting helps quantify the uncertainty in hurricane predictions and provides probabilistic guidance on hurricane track, intensity, and impacts. Ensemble forecasting can be applied to both statistical and dynamical models.
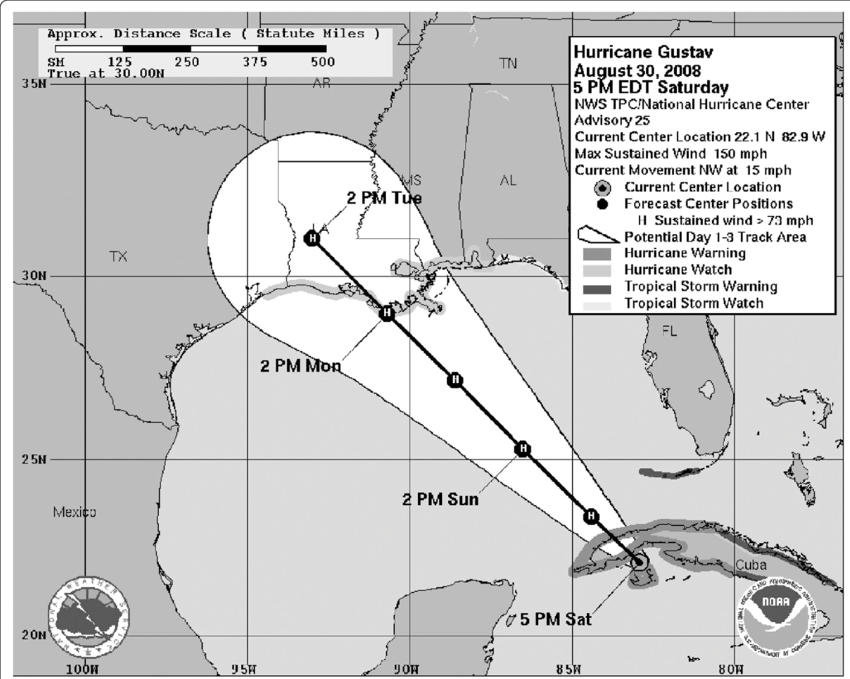
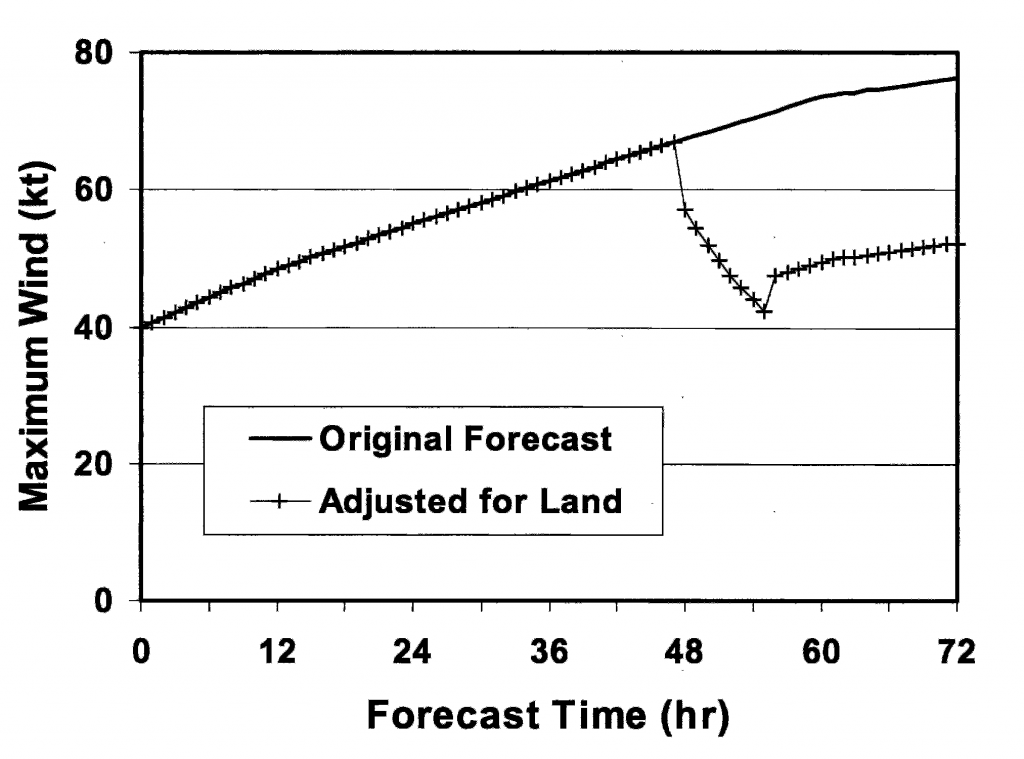
3.4 Interpreting model output Interpreting the output from hurricane forecasting models requires expertise in meteorology and an understanding of the strengths and limitations of each model. Forecasters analyze various model outputs, such as track plots, intensity graphs, and wind field maps, to assess the likely evolution of a hurricane. They also consider the consistency between different models and the overall pattern of model predictions to generate the official forecast.
Hurricane forecasting checklist:
Sea Surface Temperature (SST):
Look for SSTs of at least 26.5°C (79.7°F) extending to a depth of about 50 meters. Higher SSTs provide more energy for the storm to develop and intensify.
Atmospheric Instability:
Check for a moist, unstable atmosphere that allows warm air to rise easily. Look for a deep layer of warm, humid air extending from the surface to the mid-troposphere. Evaluate the presence of convective available potential energy (CAPE) to support thunderstorm development.
Low Wind Shear:
Analyze the vertical wind shear, which is the change in wind speed or direction with height. Ideal conditions for hurricane development have wind shear values less than 10 knots (11.5 mph or 18.5 km/h) between the lower and upper troposphere. High wind shear can disrupt the storm’s circulation and prevent it from intensifying.
Moisture Content:
Assess the presence of a moist environment, particularly in the mid-troposphere (around 5 km or 3 miles altitude). High relative humidity (greater than 70%) in this layer is conducive to hurricane development.
Pre-existing Disturbance:
Identify any pre-existing disturbances, such as tropical waves, low-pressure systems, or remnants of previous storms. These disturbances can act as seed areas for hurricane development if other conditions are favorable.
NOAA National Data Buoy Center: https://www.ndbc.noaa.gov/ NOAA Aircraft Operations Center: https://www.omao.noaa.gov/learn/aircraft-operations NOAA Hurricane Hunters: https://www.aoml.noaa.gov/hrd/about_hrd/HRD-P3_program.html
Forecasting:
NOAA National Hurricane Center: https://www.nhc.noaa.gov/ NOAA Environmental Modeling Center: https://www.emc.ncep.noaa.gov/ NOAA Hurricane Weather Research and Forecasting (HWRF) Model: https://www.emc.ncep.noaa.gov/gc_wmb/vxt/HWRF/
Advisories:
NOAA National Hurricane Center Advisories: https://www.nhc.noaa.gov/cyclones/ NOAA National Weather Service: https://www.weather.gov/ FEMA (Federal Emergency Management Agency): https://www.fema.gov/
Flood Maps:
FEMA Flood Map Service Center: https://msc.fema.gov/portal/home NOAA National Hurricane Center Storm Surge Inundation Maps: https://www.nhc.noaa.gov/surge/inundation/ USGS (United States Geological Survey) Flood Event Viewer: https://stn.wim.usgs.gov/FEV/
Forecast model links:
1. Tropical Tidbits: https://www.tropicaltidbits.com/ – Provides a wide range of model data, satellite imagery, and analysis tools
2. Mike’s Weather Page: https://spaghettimodels.com/ – Offers a collection of spaghetti models, forecast discussions, and other tools
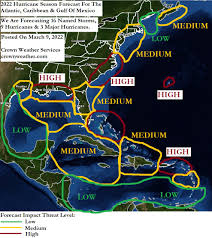
3. Crown Weather Services: https://crownweather.com/ – Includes detailed forecast discussions, model data, and a focus on the Atlantic basin
4. Cyclocane: https://www.cyclocane.com/ – Features an interactive map with various model tracks and satellite imagery
5. Hurricane Track: https://hurricanetrack.com/ – Provides a mix of professional analysis, model data, and user-friendly explanations
6. Severe Weather Europe: https://www.severe-weather.eu/tropical-weather/ – Covers tropical weather worldwide, with a focus on European interests
7. Force Thirteen: https://www.force-13.com/ – Offers live coverage, model analysis, and a community-driven approach to hurricane tracking
8. Instant Weather Maps: https://www.instantweathermaps.com/ – Provides a variety of weather maps, including tropical cyclone data and model outputs
9. Windy: https://www.windy.com/ – An interactive weather visualization platform with various forecast models and hurricane tracking features
10. NOAA’s Atlantic Oceanographic and Meteorological Laboratory (AOML): https://www.aoml.noaa.gov/hrd/graphics_sub_pages/models.html – While part of an official agency, AOML provides a comprehensive collection of model data and graphics
One of the key ways AI is being used in weather forecasting is through machine learning algorithms. These algorithms can analyze vast amounts of historical weather data, including temperature, humidity, wind speed, and precipitation, to identify patterns and make predictions about future weather events. By continuously learning from new data, these algorithms can improve their accuracy over time, leading to more reliable forecasts.
Another area where AI is making a significant impact is in the interpretation of weather satellite imagery. Traditional methods of analyzing satellite data can be time-consuming and prone to human error. However, AI-powered systems can quickly and accurately identify weather patterns and anomalies in satellite images, providing meteorologists with valuable insights into developing weather systems.
AI is also being used to improve the resolution and accuracy of weather models. By incorporating machine learning techniques, researchers can create more detailed and precise models that can simulate weather conditions down to the neighborhood level. This level of granularity can be particularly useful for predicting the impact of severe weather events, such as hurricanes and tornadoes, on specific communities.
In addition to improving the accuracy of weather forecasts, AI is also helping to make them more accessible and user-friendly. Many weather apps and websites now use AI-powered chatbots and virtual assistants to provide personalized weather information and alerts based on a user’s location and preferences. This can help individuals and businesses make more informed decisions about their daily activities and operations.
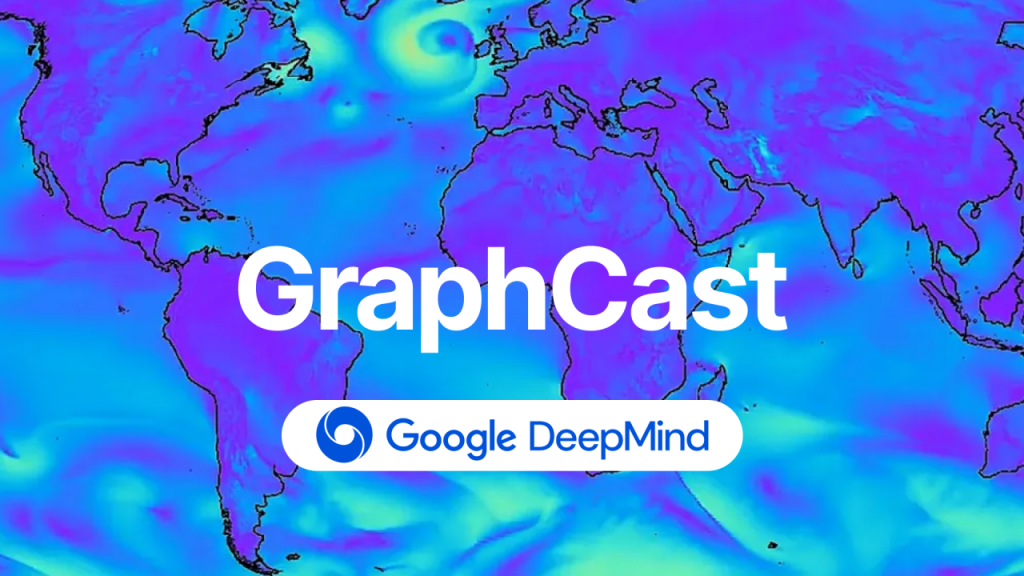
Title: The Future Potential of AI in Weather Forecasting: Building on Google’s GraphCast
Google’s GraphCast represents a significant advancement in the field of weather forecasting, utilizing artificial intelligence (AI) and Graph Neural Networks (GNNs) to deliver highly accurate 10-day weather predictions in a fraction of the time required by traditional methods. This groundbreaking technology not only improves the accuracy and efficiency of weather forecasts but also demonstrates the potential for AI to revolutionize the field of meteorology.
One of the most promising aspects of GraphCast is its ability to identify and predict extreme weather events, such as cyclones, atmospheric rivers, and heat waves, with greater accuracy and lead time than traditional forecasting models. This early warning capability could prove invaluable in saving lives and minimizing the impact of severe weather on communities. As AI continues to advance, it is likely that models like GraphCast will become even more adept at detecting and predicting these extreme events, allowing for better preparedness and response.
Looking to the future, the potential applications of AI in weather forecasting are vast. By building upon the foundation laid by GraphCast, researchers and meteorologists could develop even more sophisticated models that incorporate additional data sources, such as satellite imagery, radar, and weather station observations. These enhanced models could provide even greater accuracy and granularity in weather predictions, allowing for more localized and personalized forecasts. Additionally, AI could be used to develop long-term climate models, helping scientists better understand and predict the impacts of climate change on weather patterns and extreme events. As the world continues to grapple with the challenges posed by a changing climate, the insights provided by AI-powered weather and climate models will become increasingly critical in informing policy decisions and guiding adaptation and mitigation efforts.
Despite the many benefits of AI in weather forecasting, there are also some challenges and limitations to consider. One concern is the potential for AI systems to perpetuate biases or errors in historical weather data, leading to inaccurate predictions. Another challenge is the need for large amounts of high-quality data to train and validate AI models, which can be difficult and expensive to obtain.
Despite these challenges, the future of weather forecasting looks bright thanks to the continued advancement of AI technologies. As more data becomes available and AI algorithms become more sophisticated, we can expect to see even more accurate and detailed weather forecasts in the years to come. This will not only help us better prepare for and respond to severe weather events but also enable us to make more informed decisions about everything from agriculture to transportation to energy production.
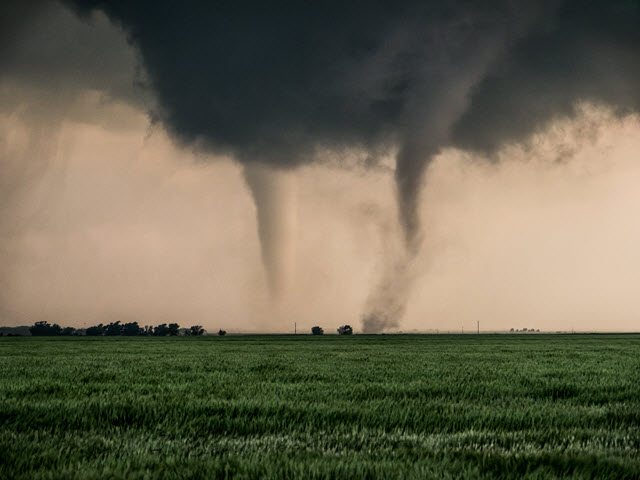
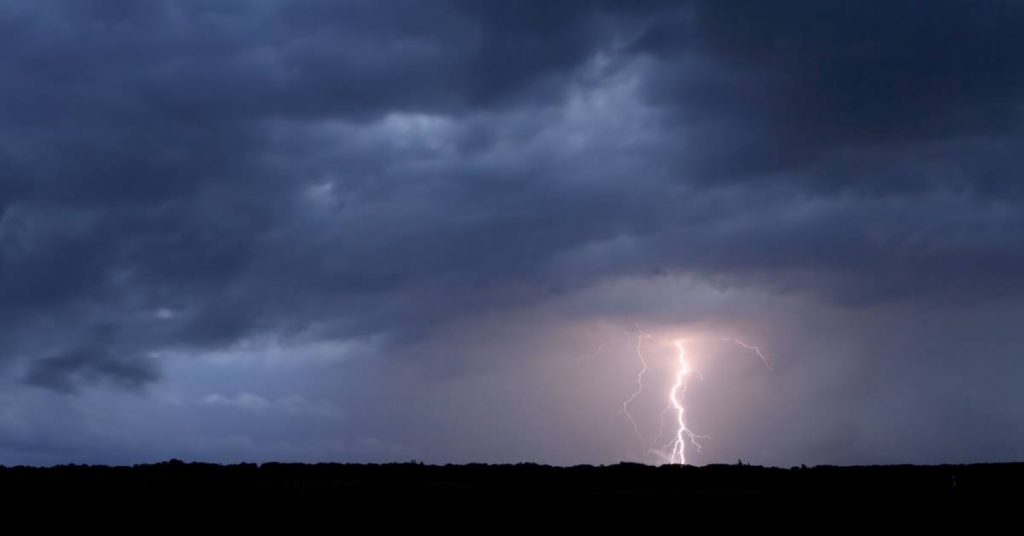
Storm Chasing: The Thrilling Pursuit of Nature’s Fury
Since the dawn of human civilization, storms have captivated and terrified us in equal measure. However, it wasn’t until the 20th century that a group of intrepid individuals began actively pursuing these meteorological marvels, giving birth to the exhilarating and often dangerous field of storm chasing.
Before the advent of modern storm chasing, the study of tornadoes and severe weather was a far cry from the sophisticated pursuit we know today. In the 1800s, the scientific understanding of these powerful natural phenomena was still in its infancy, and the concept of actively seeking out storms was virtually unheard of.
During this time, the primary sources of information about tornadoes were the accounts of those who had witnessed them firsthand. These eyewitness reports, often filled with vivid descriptions and harrowing tales of survival, laid the foundation for our early understanding of severe weather. One of the most famous accounts from this era is that of John Park Finley, a sergeant in the U.S. Army Signal Corps who became fascinated with tornadoes after surviving a close encounter in 1882.
Finley’s experience sparked a lifelong passion for studying severe weather, and he went on to become one of the most influential figures in the field. In 1884, he published the first comprehensive study of tornadoes in the United States, titled “Report on the Character of Six Hundred Tornadoes.” This groundbreaking work, which included detailed descriptions and classifications of tornadoes, served as a cornerstone for future research.
Despite the efforts of individuals like Finley, the scientific community of the 1800s was largely skeptical of the idea that tornadoes could be studied in a systematic way. Many believed that these powerful storms were too unpredictable and chaotic to be understood, and the notion of actively pursuing them was considered foolhardy at best.
However, this began to change in the late 1800s, as advances in technology and communication made it easier to track and study severe weather. The invention of the telegraph allowed for the rapid dissemination of weather reports, and the establishment of a national weather service in 1870 marked a significant step forward in the organized study of meteorology.
In the heart of Oklahoma, at Tinker Air Force Base, a groundbreaking event took place on March 25, 1948, that would forever change the course of severe weather forecasting. On this fateful day, a group of Air Force meteorologists, led by the visionary Captain Robert C. Miller and Major Ernest J. Fawbush, issued the world’s first tornado forecast. This remarkable achievement marked a turning point in our understanding of these powerful storms and paved the way for the development of modern storm chasing and severe weather research.
The events leading up to this historic moment were nothing short of extraordinary. Miller and Fawbush, both brilliant meteorologists, had been tasked with investigating the devastating tornado that struck Tinker Air Force Base on March 20, 1948, causing significant damage and injuring several personnel. As they pored over weather data and eyewitness accounts, the two men began to notice patterns and conditions that seemed to precede the formation of tornadoes. With a powerful cold front approaching and similar atmospheric conditions to the March 20th tornado in place, Miller and Fawbush made a bold decision: they would issue a tornado forecast for the following day.
The forecast, which was met with skepticism by some of their colleagues, proved to be remarkably accurate. On March 25, 1948, a tornado touched down just miles from Tinker Air Force Base, causing damage but no fatalities thanks to the advance warning provided by Miller and Fawbush’s forecast. This incredible success story quickly spread throughout the meteorological community, sparking a renewed interest in the study of tornadoes and severe weather. The Tinker Air Force Base breakthrough not only demonstrated the potential for tornado forecasting but also highlighted the critical importance of understanding these powerful storms. As a result, the field of storm chasing began to evolve, with a growing number of researchers and enthusiasts dedicating themselves to unlocking the secrets of nature’s fury.
The roots of storm chasing can be traced back to the 1950s when a handful of weather enthusiasts, armed with little more than their curiosity and a few rudimentary instruments, ventured out to observe storms up close. Among these early pioneers was David Hoadley, widely regarded as the father of storm chasing. Hoadley’s fascination with severe weather led him to found the Storm Track magazine in 1977, which became a bible for aspiring storm chasers.
Another notable figure in the history of storm chasing is Neil Ward, a meteorology professor at the University of Oklahoma. In the early 1970s, Ward began taking his students on field trips to observe severe weather, laying the groundwork for what would eventually become a thriving research community. His work paved the way for future scientists to study storms in their natural environment, leading to significant advancements in our understanding of severe weather.
The 1980s saw a surge in the popularity of storm chasing, thanks in part to the advent of Doppler radar and the increasing availability of portable video cameras. This decade also witnessed the rise of some of the most iconic figures in storm chasing history, including Tim Marshall, Gene Moore, and the late Al Moller. These individuals, along with many others, helped to establish storm chasing as a legitimate field of study and a thrilling pursuit for adventure seekers.
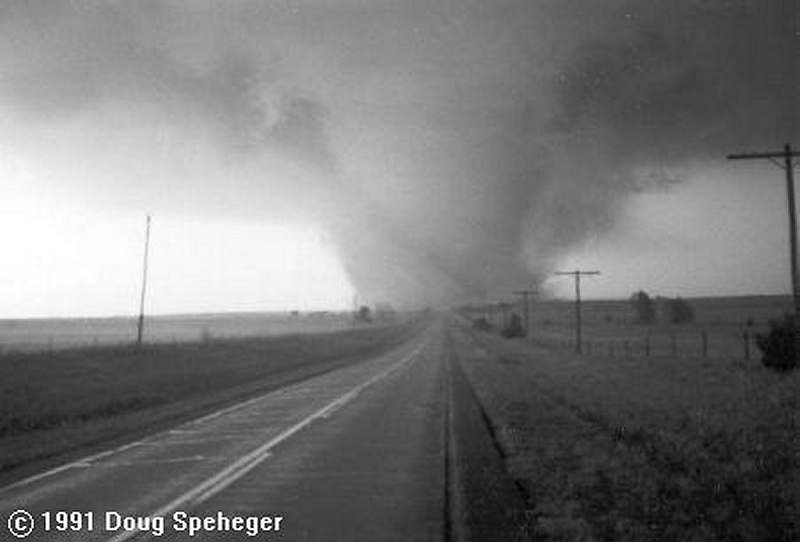
One of the most significant milestones in storm chasing history occurred on April 26, 1991, when a group of chasers, including Tim Marshall and Gene Moore, captured the first-ever footage of a tornado from start to finish. This groundbreaking achievement not only provided scientists with invaluable data but also sparked a renewed interest in storm chasing among the general public.
The 1990s and early 2000s saw storm chasing enter the mainstream, with the release of popular films like “Twister” and the rise of television shows dedicated to severe weather. This increased visibility brought with it a new generation of storm chasers, eager to experience the thrill of the chase and contribute to our understanding of these awe-inspiring natural phenomena.
As we entered the 21st century, storm chasing underwent a dramatic transformation, fueled by rapid advancements in technology, improved forecasting models, and a growing public fascination with severe weather. The period from 2000 to 2024 saw an explosion in the popularity of storm chasing, with a new generation of chasers pushing the boundaries of what was possible in the pursuit of nature’s fury.
One of the most significant developments during this time was the rise of high-resolution weather models and the increasing availability of mobile weather radar applications. These tools allowed storm chasers to track and predict the movement of storms with unprecedented accuracy, revolutionizing the way they approached their craft. No longer were chasers reliant on radio reports or their own intuition to guide them; now, they could access real-time data and detailed forecasts at the touch of a button. This technological leap forward not only made storm chasing safer and more efficient but also opened up the field to a wider range of participants, from seasoned researchers to amateur enthusiasts.
The 2000s also saw the emergence of a new breed of storm chaser, epitomized by the likes of Reed Timmer. Timmer, a meteorologist and extreme storm chaser, gained notoriety for his daring exploits and his custom-built armored vehicle, designed to withstand the forces of even the most violent tornadoes. His adventures, along with those of other extreme chasers, captured the public’s imagination and helped to fuel a growing interest in storm chasing as a recreational pursuit. The launch of the Discovery Channel’s “Storm Chasers” television series in 2007 further cemented the popularity of storm chasing, bringing the thrills and dangers of the chase into living rooms across the country.
Today, storm chasing remains a vital tool for researchers seeking to unravel the mysteries of severe weather. While technology has advanced significantly since the early days of Hoadley and Ward, the spirit of adventure and the desire to witness nature’s raw power continue to drive storm chasers to pursue their passion. As climate change contributes to an increasing frequency and intensity of severe weather events, the work of these dedicated individuals has never been more important.
If you’re an adventurous soul looking to witness the raw power of nature up close, a tornado tour might be just the thrill you’re seeking. However, with numerous companies offering storm chasing experiences, it’s important to choose a reputable and experienced outfit to ensure your safety and satisfaction. We’ll guide you through the process of selecting the best tornado tour company and provide a list of well-known operators along with their website addresses.
Factors to Consider When Choosing a Tornado Tour Company:
Experience and expertise: Look for companies with experienced guides who have a proven track record of successfully navigating severe weather conditions. Ensure that the guides are knowledgeable about meteorology and have the necessary skills to keep you safe.
Safety measures: Your chosen company should prioritize safety above all else. Inquire about their safety protocols, emergency procedures, and the equipment they use to monitor and track storms.
Group size: Smaller group sizes often lead to a more personalized experience and better access to the guides. Consider the company’s maximum group size and whether it aligns with your preferences.
Tour duration and itinerary: Tornado tours can vary in length from a single day to a week or more. Consider your availability and the specific areas you’d like to explore when choosing a tour duration and itinerary.
Reviews and testimonials: Read reviews and testimonials from previous clients to gauge the company’s reputation and the quality of their tours. Look for consistent positive feedback and how the company responds to any negative reviews.
Top Tornado Tour Companies:
1.Tempest Tours Website: https://tempesttours.com/ Tempest Tours has been offering storm chasing expeditions since 2000 and is known for their experienced guides and commitment to safety.
2. Silver Lining Tours Website: https://www.silverliningtours.com/ With over 20 years of experience, Silver Lining Tours provides educational and thrilling storm chasing adventures across Tornado Alley.
3. Storm Chasing Adventure Tours Website: https://stormchasing.com/ Storm Chasing Adventure Tours offers a variety of tour options, from single-day excursions to week-long expeditions, led by experienced meteorologists and storm chasers.
4. Extreme Tornado Tours Website: https://extremetornadotours.com/ Extreme Tornado Tours specializes in small-group tours led by seasoned storm chasers, ensuring a personalized and immersive experience.
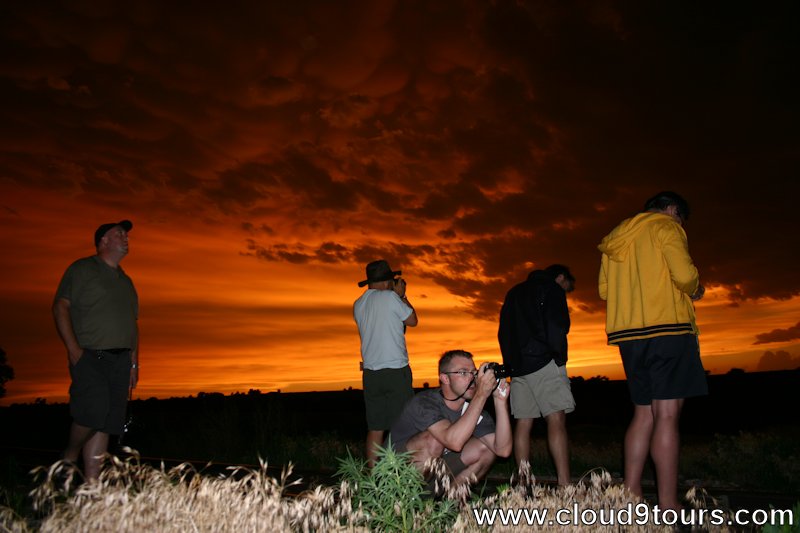
5. Cloud 9 Tours Website: https://cloud9tours.com/ Cloud 9 Tours offers both storm chasing and photography-focused tours, catering to those who want to capture the beauty and power of severe weather.
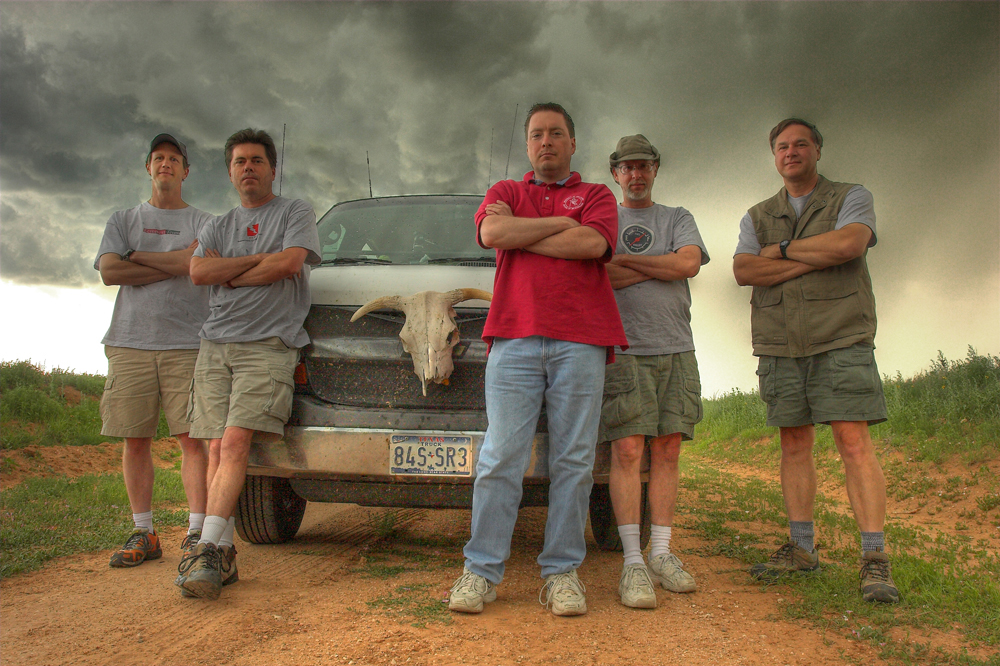
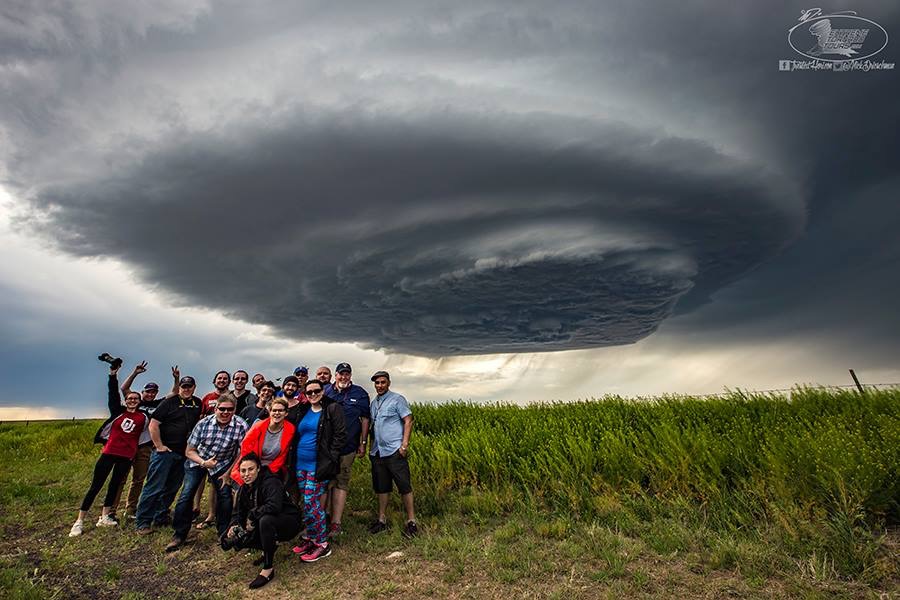
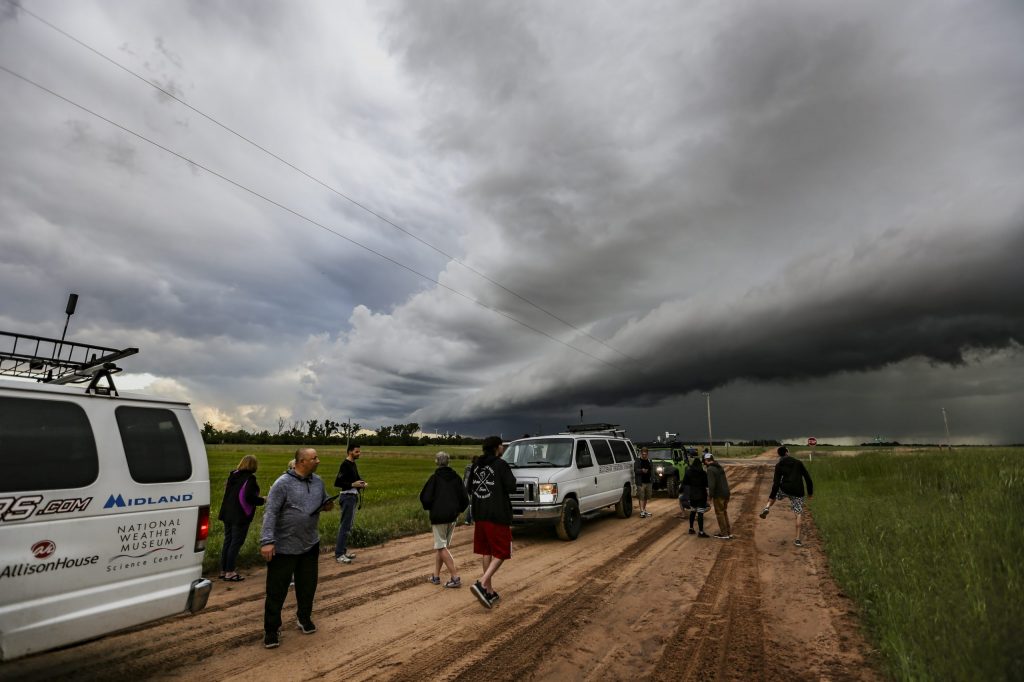
Storm chasing tornado tours offer a unique and exhilarating experience for thrill-seekers and weather enthusiasts alike. These guided adventures take participants on a journey into the heart of Tornado Alley, where they witness the awe-inspiring power of nature firsthand. Experienced storm chasers lead the tours, using their expertise in meteorology and forecasting to navigate the group towards active storms. Participants can expect to spend long hours on the road, tracking weather patterns and chasing down potential tornado outbreaks. When a tornado does form, the rush of adrenaline is unparalleled as the group carefully positions themselves at a safe distance to observe the twisting vortex.
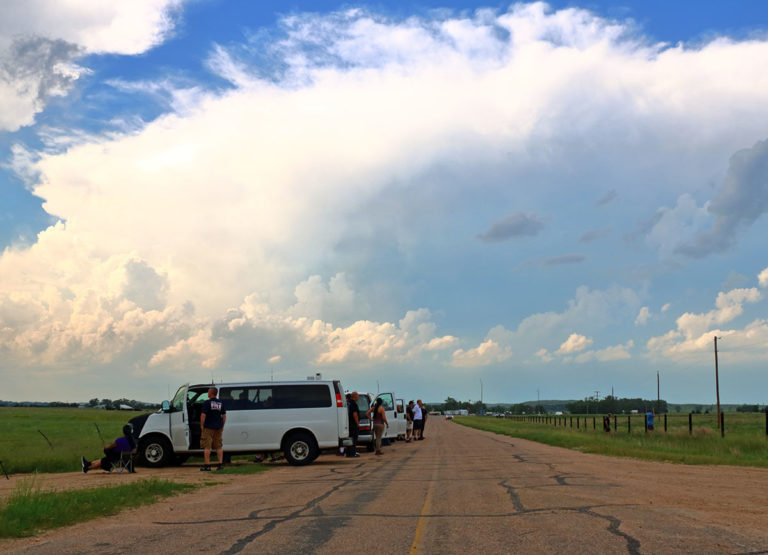
However, storm chasing is not without its risks. Tornadoes are unpredictable and can change course or intensify rapidly, putting chasers in danger if they are not careful. Flying debris, hail, and strong winds can also pose a threat to safety. Storm chasing tour companies prioritize the well-being of their clients, but participants must be aware of the inherent dangers and follow instructions closely. Choose a reputable company with experienced guides who prioritize safety above all else. Participants should also be prepared for the physical demands of the tour, as it often involves long periods of driving and potentially rough terrain. Storm chasing is endless driving and sometimes you won’t see much so you have to be prepared to be on the road for up to 10 days.
Despite the risks, the benefits of a storm chasing tornado tour are significant for those who crave adventure and have a deep appreciation for the power of nature. Witnessing a tornado up close is a once-in-a-lifetime experience that few people have the opportunity to enjoy. Storm chasing tours provide a controlled environment for this experience, with knowledgeable guides who can help participants understand the science behind the storms. Additionally, the tours often foster a sense of camaraderie among participants, as they bond over their shared passion for weather and adventure. For many, the thrill of the chase and the incredible photographs and memories they capture make the risks worthwhile.