Hurricane Hunters are specially equipped aircraft used to fly into tropical cyclones to gather critical meteorological data. These missions provide invaluable information that helps meteorologists predict the path, intensity, and potential impact of hurricanes. The aircraft used in these daring missions are heavily modified to withstand the extreme conditions encountered in the eyewall of a hurricane, the most intense part of the storm. This article explores the unique features and modifications of Hurricane Hunter aircraft, and how they accomplish their challenging mission.
The Role of Hurricane Hunter Aircraft
Hurricane Hunters are tasked with penetrating the core of hurricanes to collect data that cannot be obtained by satellites or ground-based instruments. These aircraft fly directly into the storm, gathering real-time data on wind speeds, pressure, temperature, humidity, and other critical parameters. This information is essential for improving hurricane forecasts, which can save lives and reduce economic losses.
Key Aircraft in the Hurricane Hunter Fleet
The most commonly used Hurricane Hunter aircraft include the Lockheed WP-3D Orion and the WC-130J Hercules. These planes are operated by the National Oceanic and Atmospheric Administration (NOAA) and the U.S. Air Force Reserve’s 53rd Weather Reconnaissance Squadron, respectively.
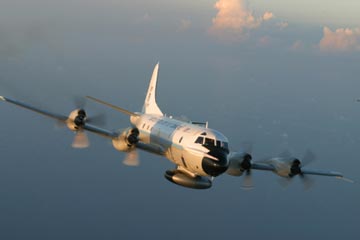
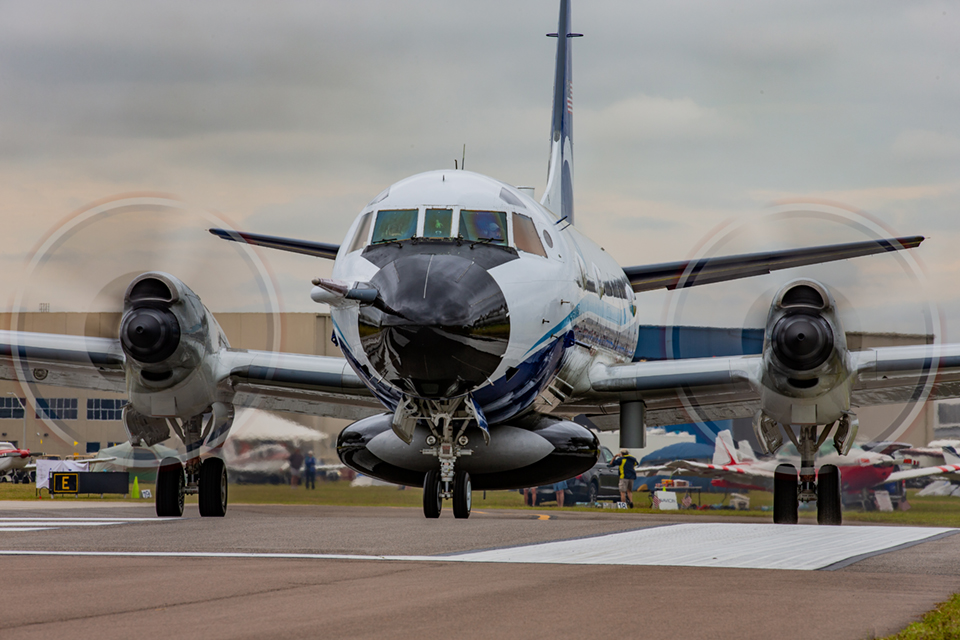
Lockheed WP-3D Orion
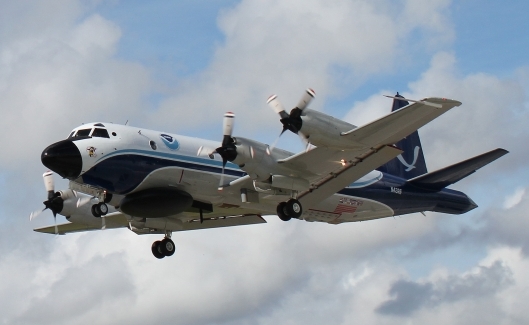
The WP-3D Orion, also known as “Miss Piggy” and “Kermit,” are two modified versions of the P-3 Orion, originally designed for anti-submarine warfare. These aircraft have been extensively modified to serve their new role in hurricane reconnaissance.
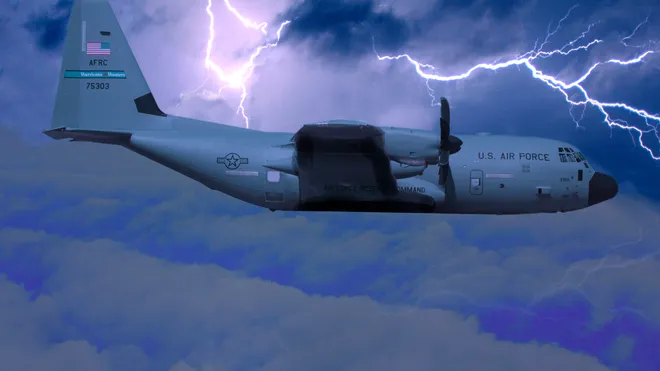
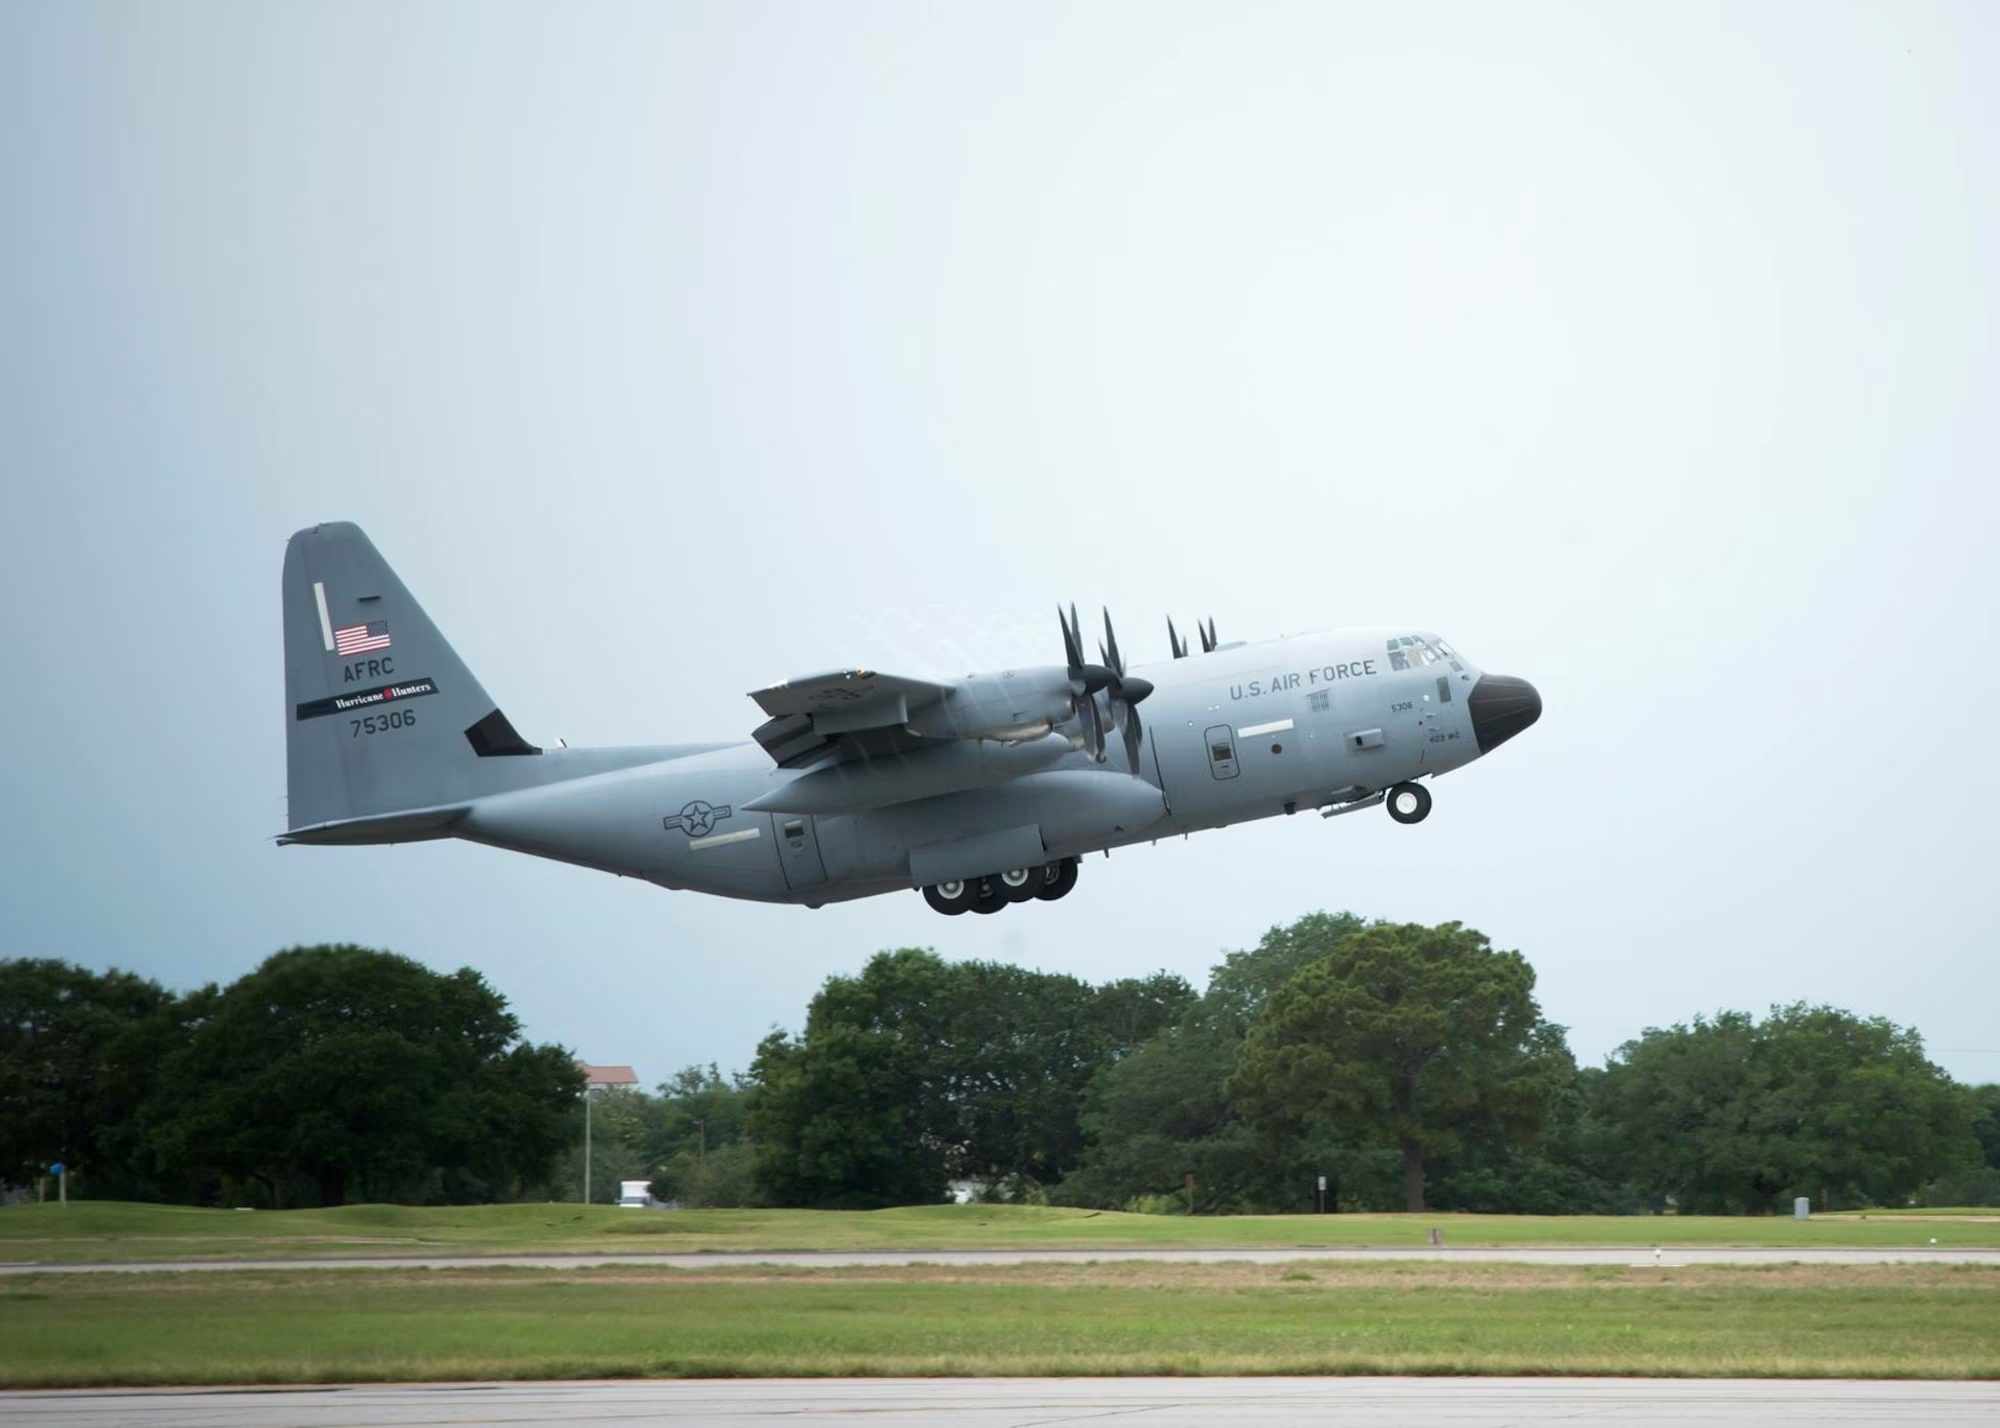
WC-130J Hercules
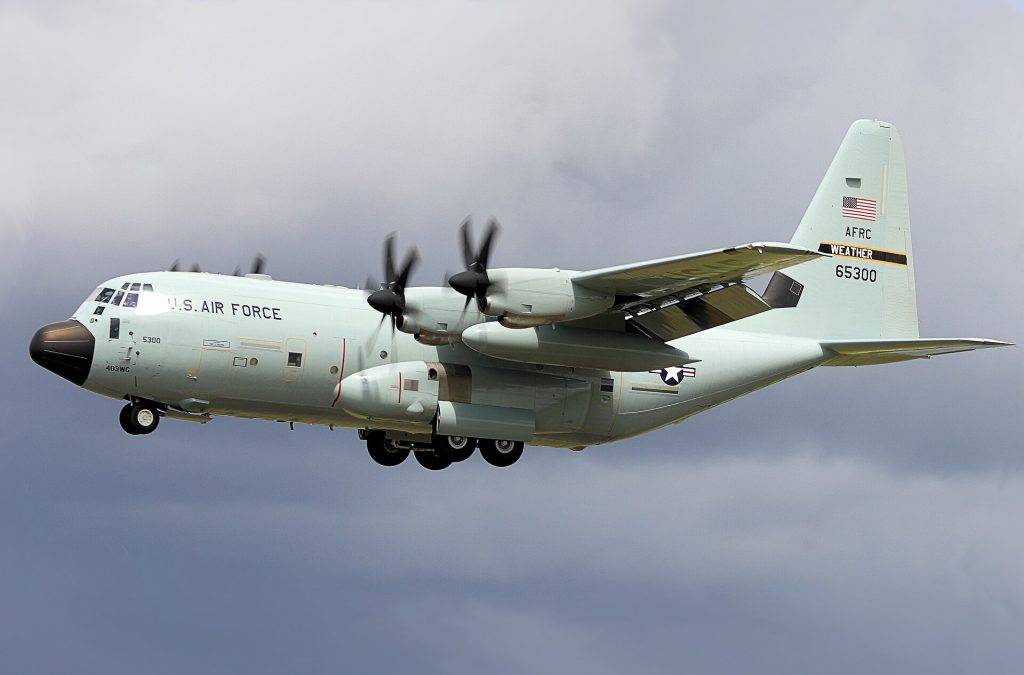
The WC-130J Hercules is a weather reconnaissance version of the C-130J Super Hercules. This aircraft is operated by the 53rd Weather Reconnaissance Squadron, known as the “Hurricane Hunters.” The WC-130J is equipped with sophisticated instruments to collect meteorological data while enduring the harsh conditions of a hurricane.
Modifications and Special Features
Hurricane Hunter aircraft undergo several modifications to ensure they can safely and effectively operate in the extreme conditions encountered within a hurricane. These modifications include structural reinforcements, specialized instrumentation, and enhanced communication systems.
Structural Reinforcements
- Enhanced Airframe: The airframe of Hurricane Hunter aircraft is reinforced to withstand the intense turbulence, high winds, and potential impact of debris encountered in the eyewall. The reinforcement includes strengthening the wings, fuselage, and control surfaces.
- De-Icing Systems: Given the varying altitudes and temperatures the aircraft experience, advanced de-icing systems are crucial to prevent ice buildup on the wings and control surfaces, which could jeopardize the mission.
Specialized Instrumentation
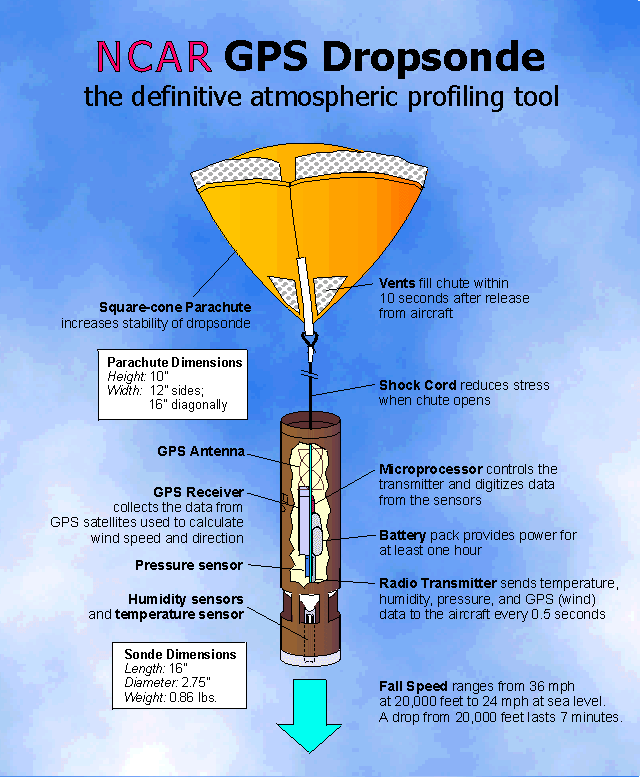
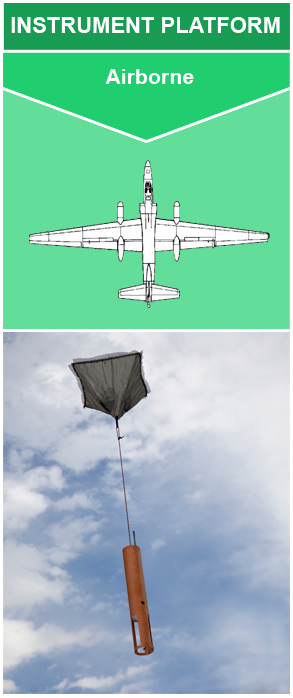
- Dropsondes: These are small, expendable devices dropped from the aircraft into the hurricane. As a dropsonde descends, it measures and transmits data on temperature, humidity, pressure, and wind speed and direction. This vertical profile of the atmosphere provides critical information about the structure of the storm.
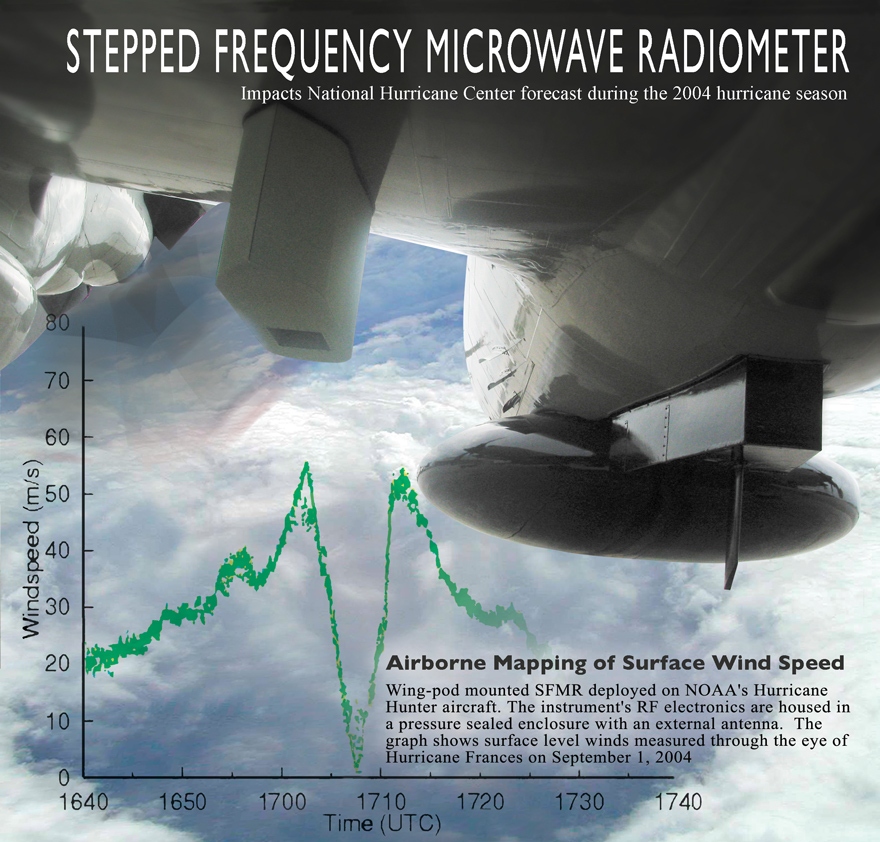
2. Stepped-Frequency Microwave Radiometer (SFMR): This instrument measures the wind speed at the surface of the ocean by detecting microwave emissions from the sea surface. The SFMR allows scientists to estimate the intensity of the storm over water, which is essential for accurate forecasting.
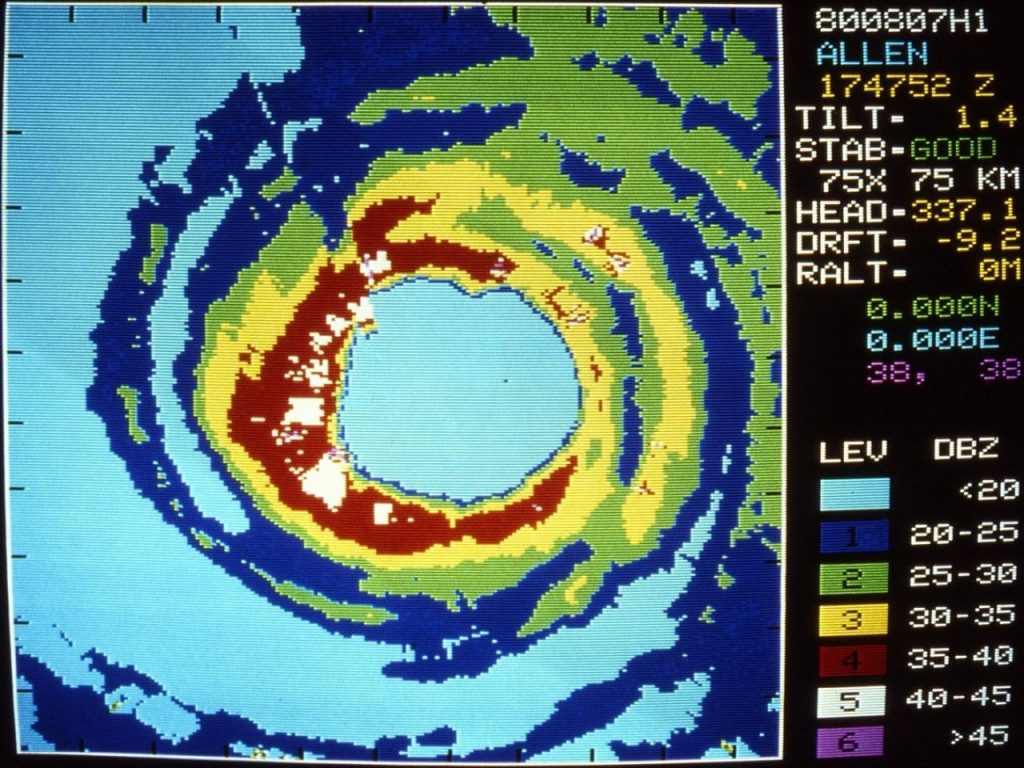
3. Radar Systems: Advanced radar systems, including tail Doppler radar and lower fuselage radar, are used to map the structure of the hurricane. These radar systems provide detailed information on the eyewall, rainbands, and overall storm morphology.
4. Airborne Vertical Atmospheric Profiling System (AVAPS): This system works in conjunction with dropsondes to provide vertical atmospheric profiles, enhancing the understanding of atmospheric dynamics within the storm.
Enhanced Communication Systems
- Satellite Communication: Real-time data transmission is crucial for Hurricane Hunters. Satellite communication systems allow the aircraft to send data directly to the National Hurricane Center (NHC) and other meteorological agencies. This ensures that forecasters receive up-to-date information to improve their models and predictions.
- Advanced Navigation Systems: Precision navigation is essential for flying into and out of the turbulent environment of a hurricane. Enhanced GPS and inertial navigation systems ensure accurate positioning, allowing the aircraft to safely navigate through the storm.
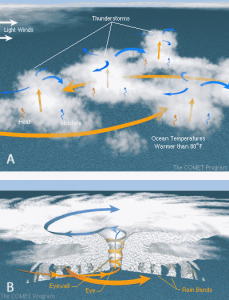
The Eyewall Challenge
The eyewall of a hurricane is the region surrounding the eye of the storm, characterized by the most intense winds and heaviest rainfall. Flying through the eyewall is one of the most challenging and dangerous aspects of a Hurricane Hunter mission.
Turbulence and Wind Shear
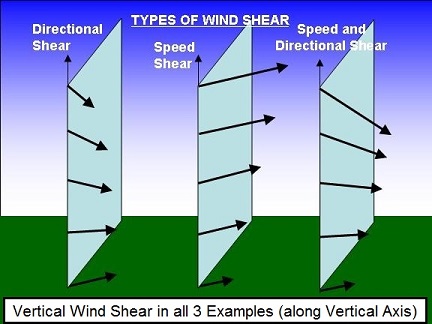
The eyewall features extreme turbulence and wind shear, which can create severe stress on the aircraft. Pilots must be highly skilled to manage these conditions, maintaining control of the aircraft while ensuring the safety of the crew and the integrity of the data being collected.
Lightning and Electrical Hazards
Hurricanes often generate significant electrical activity, including lightning. Hurricane Hunter aircraft are equipped with lightning protection systems to minimize the risk of electrical damage. These systems include static discharge wicks and shielding for electronic components.
Communication with Ground Stations
Maintaining communication with ground stations is vital during a mission. Despite the extreme conditions, Hurricane Hunter aircraft are equipped with robust communication systems to ensure continuous data transmission and coordination with meteorological agencies.
Case Studies: Missions into Major Hurricanes
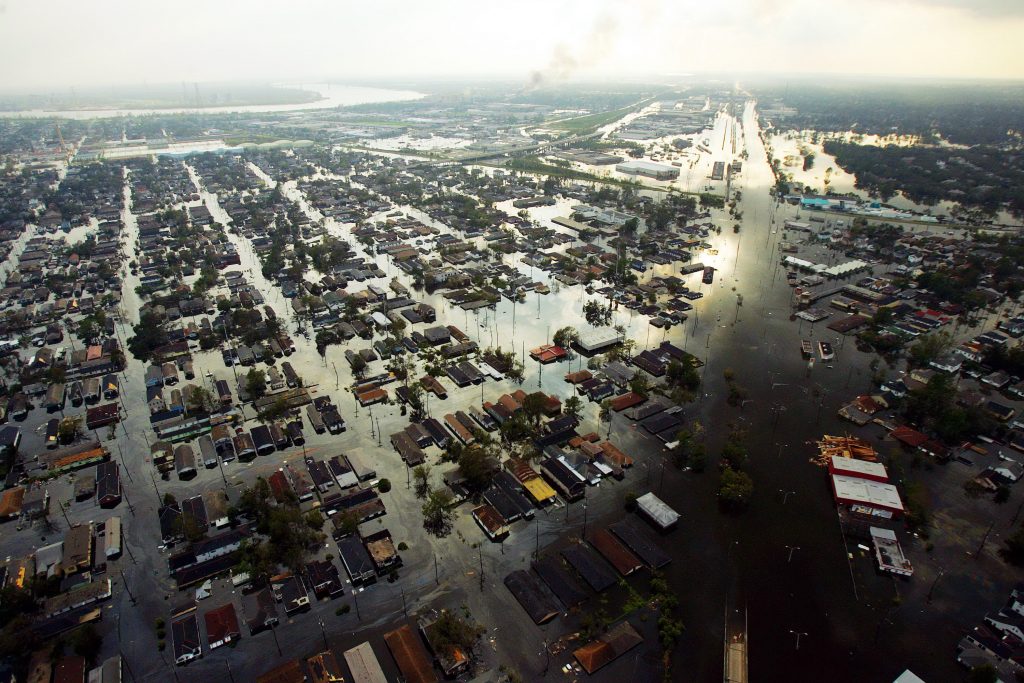
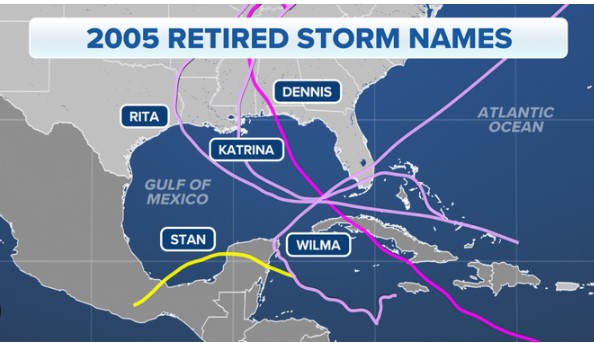
Hurricane Katrina (2005)
During Hurricane Katrina, Hurricane Hunter aircraft played a crucial role in monitoring the storm’s development and intensification. Data collected from these missions helped forecasters accurately predict the catastrophic impact of the storm, prompting timely evacuations and disaster preparations.
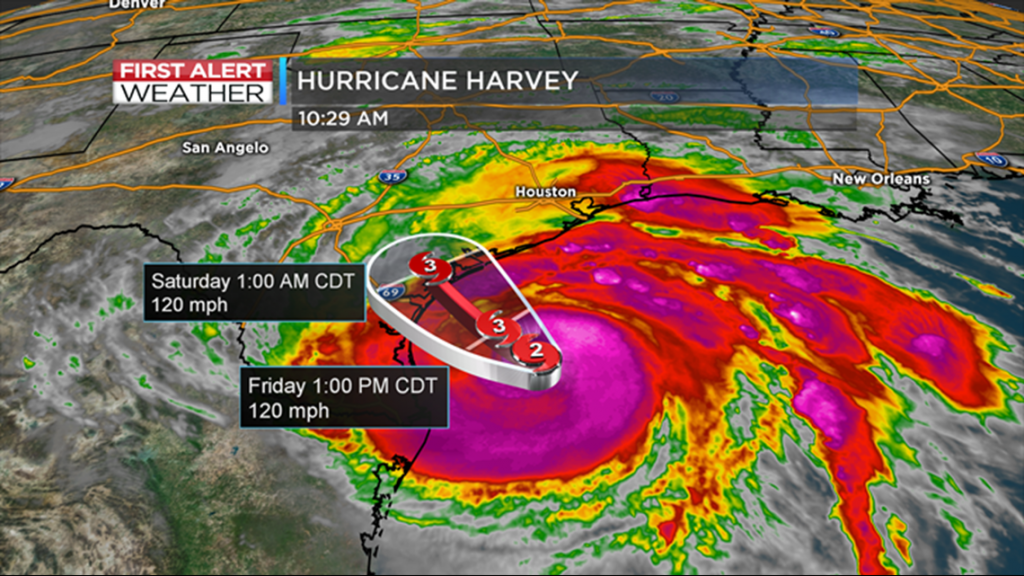
Hurricane Harvey (2017)
Hurricane Hunters were instrumental in tracking Hurricane Harvey, which brought unprecedented rainfall and flooding to Texas. The data collected by the aircraft provided critical insights into the storm’s behavior, enabling more accurate forecasts and effective emergency response efforts.
1. Hurricane Hugo (1989) – NOAA WP-3D Orion Incident
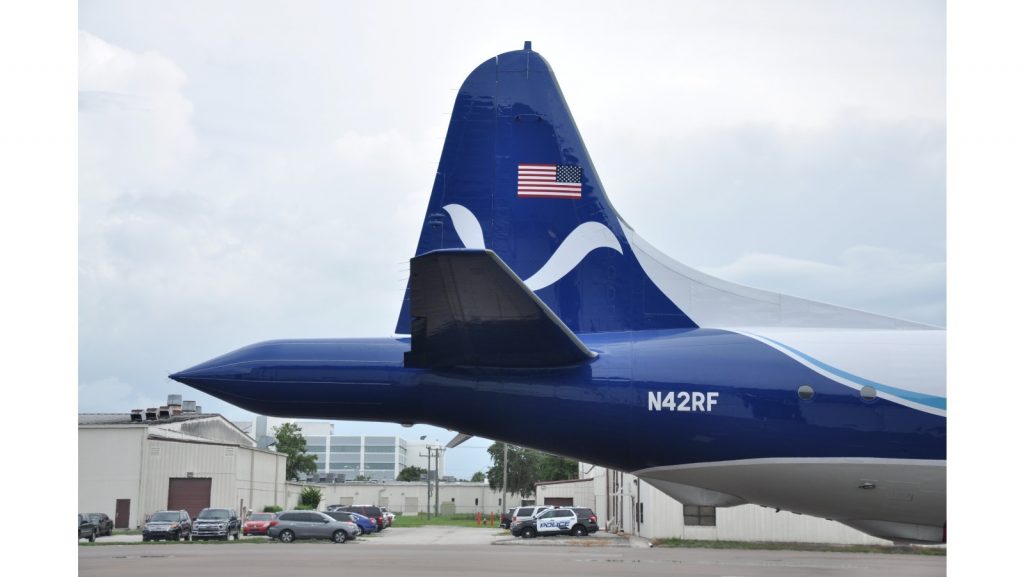
In September 1989, a NOAA WP-3D Orion aircraft, tail number N42RF (nicknamed “Kermit”), flew into Hurricane Hugo, which was a Category 5 storm at the time. The aircraft encountered severe turbulence and extreme wind shear. During the mission, the aircraft experienced a significant drop in altitude due to powerful downdrafts. The crew managed to recover the plane and complete the mission, but the incident underscored the extreme dangers of flying into powerful hurricanes.
2. Typhoon Violet (1961) – WB-50D Superfortress Crash

In October 1961, a U.S. Air Force WB-50D Superfortress, part of the 54th Weather Reconnaissance Squadron, was on a mission to gather data on Typhoon Violet. The aircraft encountered severe turbulence and extreme weather conditions in the eyewall. Tragically, the plane crashed into the Pacific Ocean, resulting in the loss of all ten crew members. This incident remains one of the deadliest involving Hurricane Hunter missions and highlights the risks these crews face.
3. Hurricane Janet (1955) – Navy P2V Neptune Crash
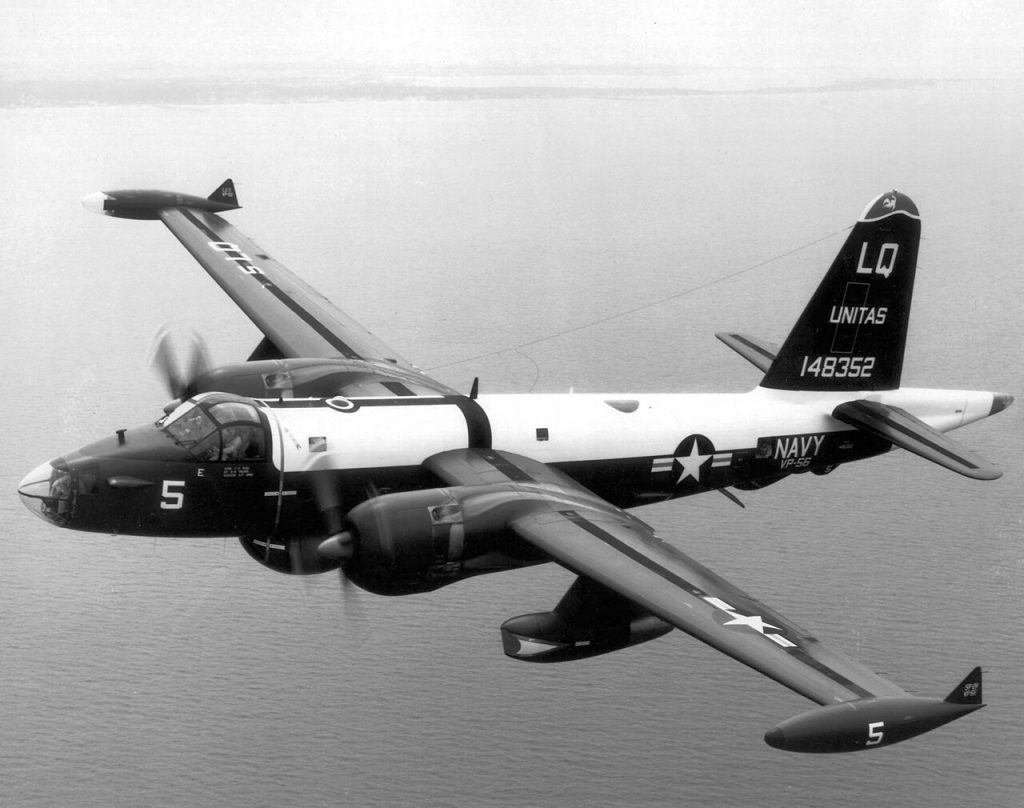
In September 1955, a U.S. Navy P2V Neptune aircraft from the VW-4 squadron was on a reconnaissance mission into Hurricane Janet, a Category 5 storm. The aircraft encountered severe turbulence and heavy rain, causing it to crash in the Caribbean Sea. All nine crew members aboard were lost. This crash prompted the military to review and improve safety protocols for Hurricane Hunter missions.
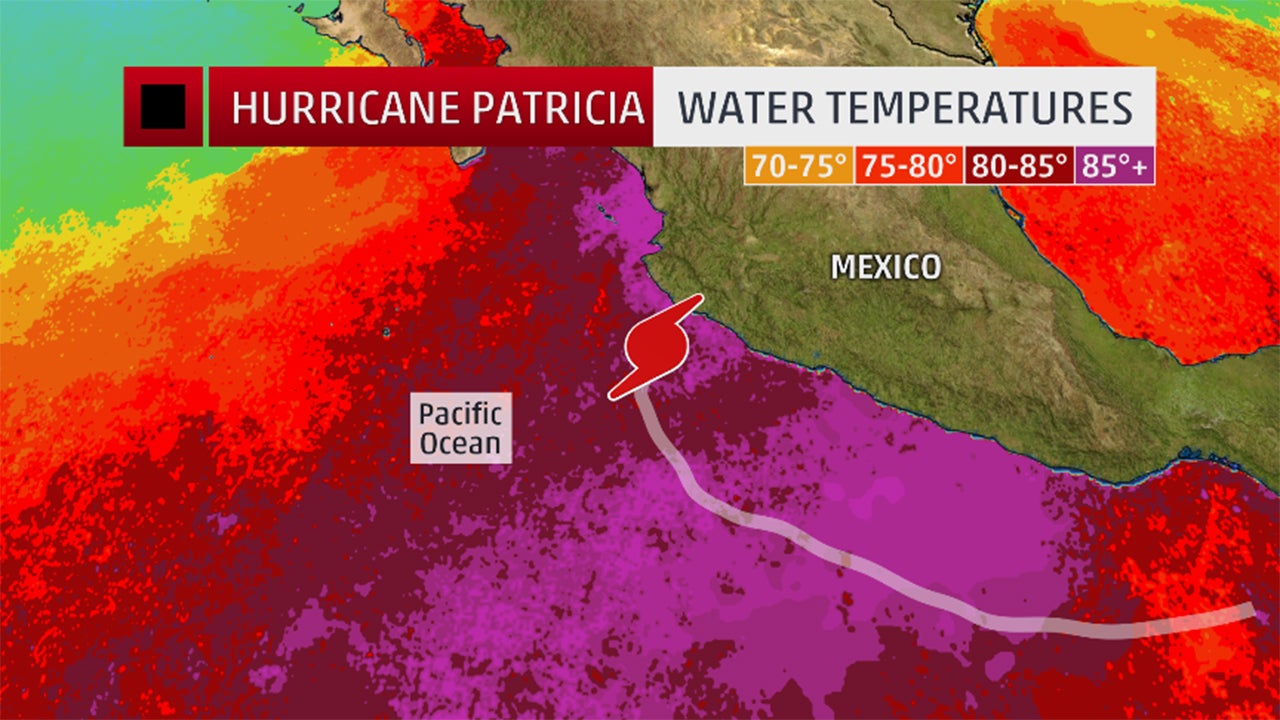
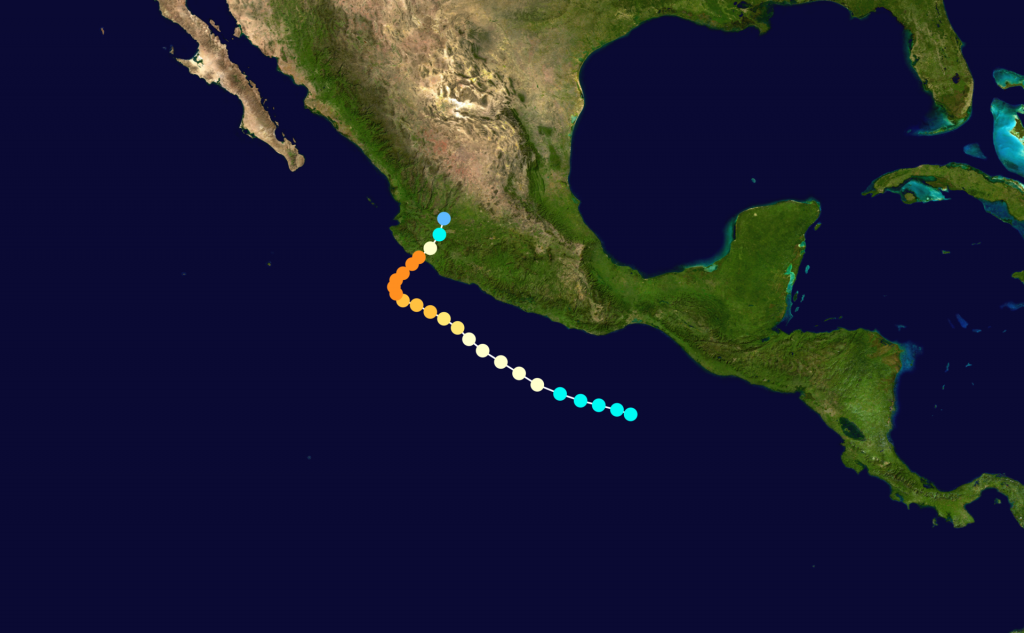
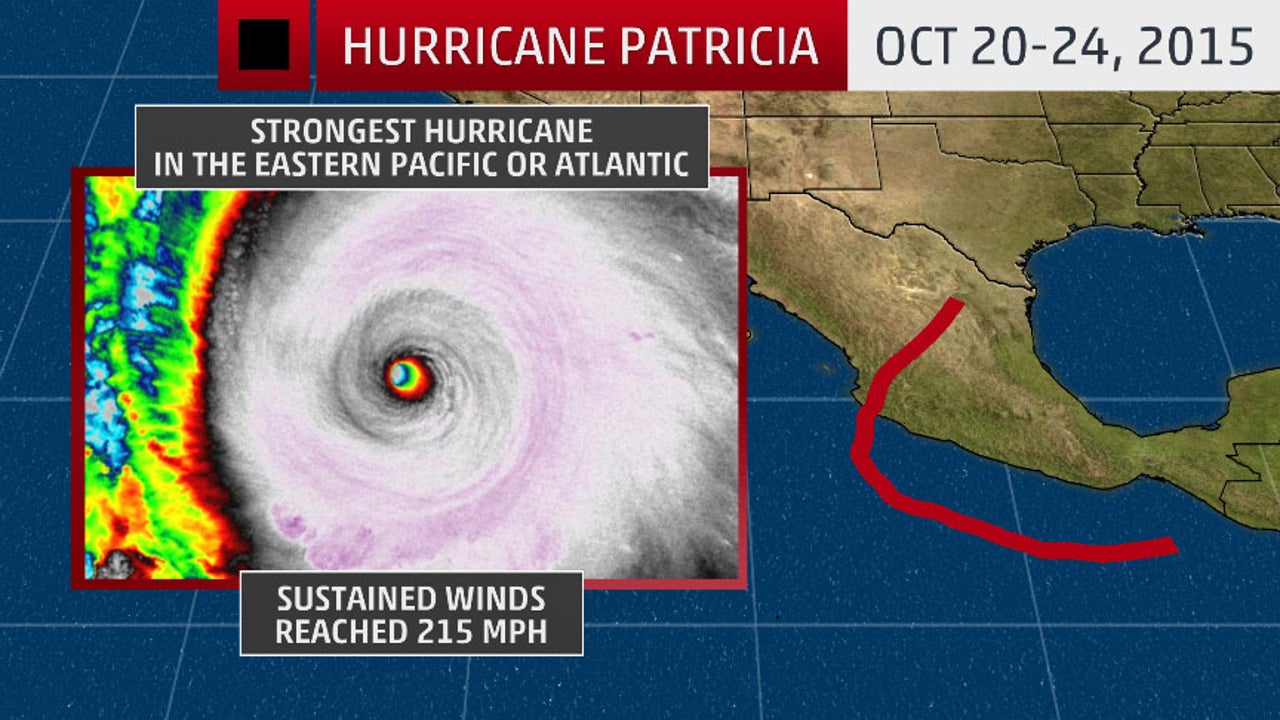
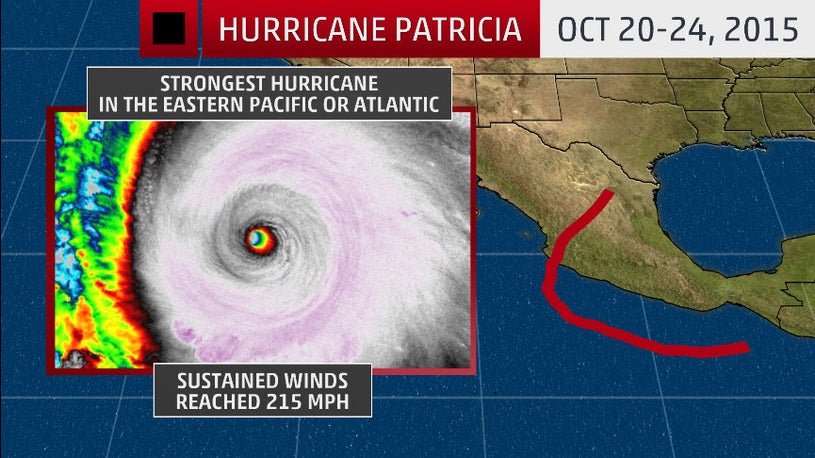
4. Hurricane Patricia (2015) – WC-130J Hercules Incident
During Hurricane Patricia in October 2015, which rapidly intensified to become the most powerful hurricane on record in the Western Hemisphere, a U.S. Air Force Reserve WC-130J Hercules aircraft flew into the storm to gather critical data. The aircraft encountered extreme turbulence and faced significant challenges maintaining altitude and stability. The crew managed to safely navigate through the eyewall, but the mission was a stark reminder of the perils involved in these operations.
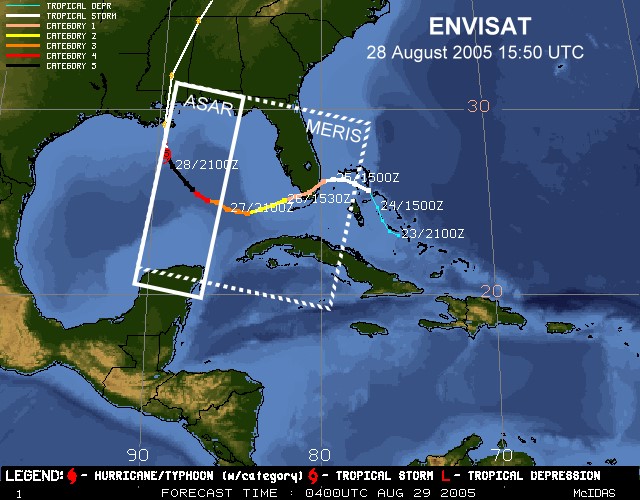
5. Hurricane Katrina (2005) – NOAA P-3 Incident
In August 2005, as Hurricane Katrina was intensifying in the Gulf of Mexico, a NOAA P-3 aircraft flew multiple missions into the storm. One particular flight faced severe turbulence and mechanical issues, including problems with one of the engines. Despite these challenges, the crew successfully completed their mission and provided crucial data that helped forecasters predict the storm’s path and intensity. The aircraft landed safely, but the mission highlighted the physical and technical difficulties of hurricane reconnaissance.