Inside the Storm: Decoding Radar’s Secrets – From Bow Echo to Debris Ball

Radar meteorology is one of the most important tools for monitoring and predicting severe weather events. By analyzing radar data, meteorologists can identify specific features that indicate the presence of dangerous storms, such as supercell thunderstorms and tornadoes. In this article, we will discuss some of the most common radar features to look for when assessing severe weather threats.

  1. Hook Echo:
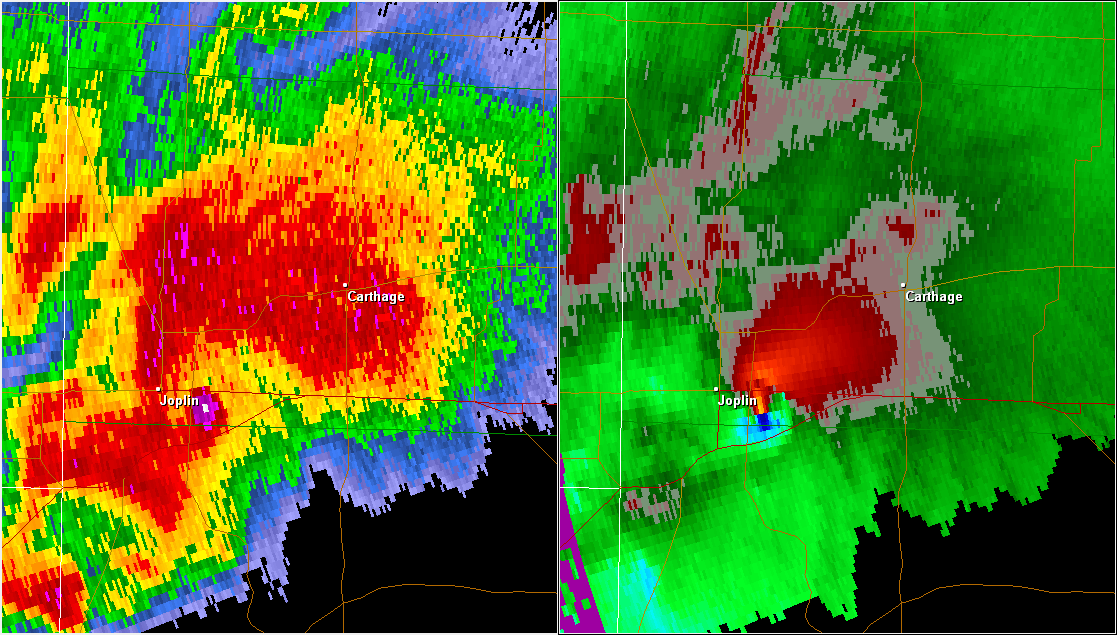
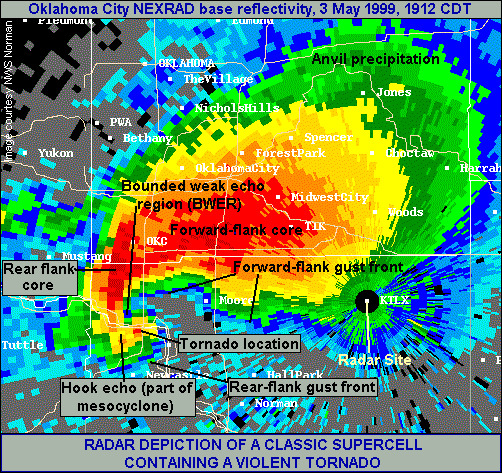
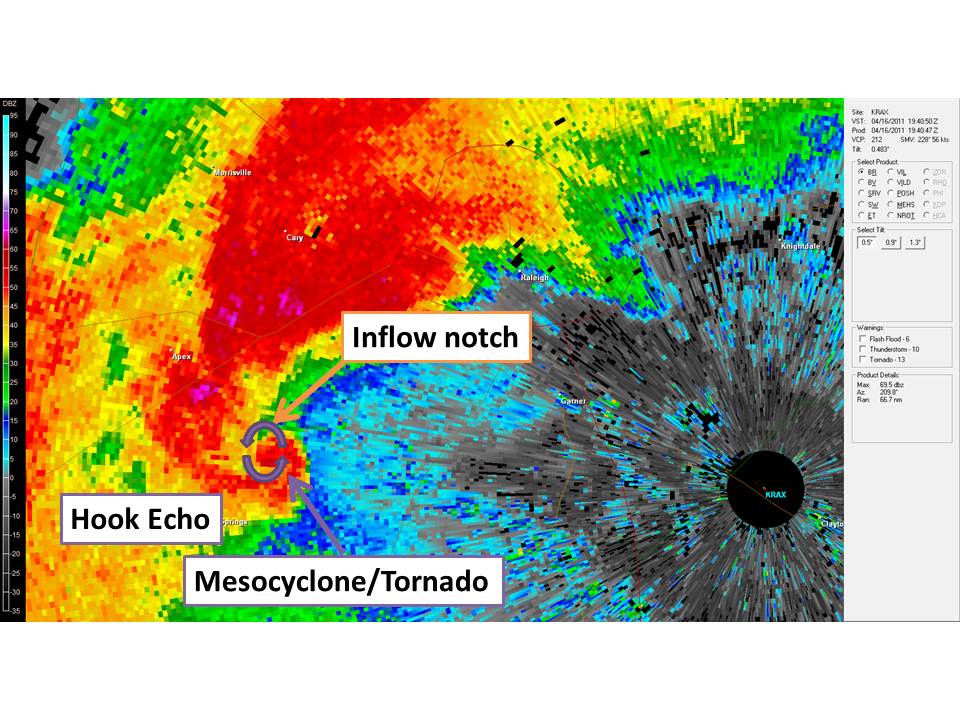
    A hook echo is a distinctive radar signature that often indicates the presence of a supercell thunderstorm capable of producing tornadoes. This feature appears as a hook-shaped appendage extending from the main storm cell on the radar display. The hook shape is formed by the rotation of the storm’s updraft, which can cause rain and hail to wrap around the updraft, creating a hook-like appearance.

When a hook echo is detected, it is essential to monitor the storm closely, as it has a higher likelihood of producing a tornado. The tightness and persistence of the hook echo can provide clues about the storm’s intensity and potential for tornadogenesis. A tight, well-defined hook echo that persists for an extended period is more likely to be associated with a strong, long-lived tornado.

  1. Bow Echo:
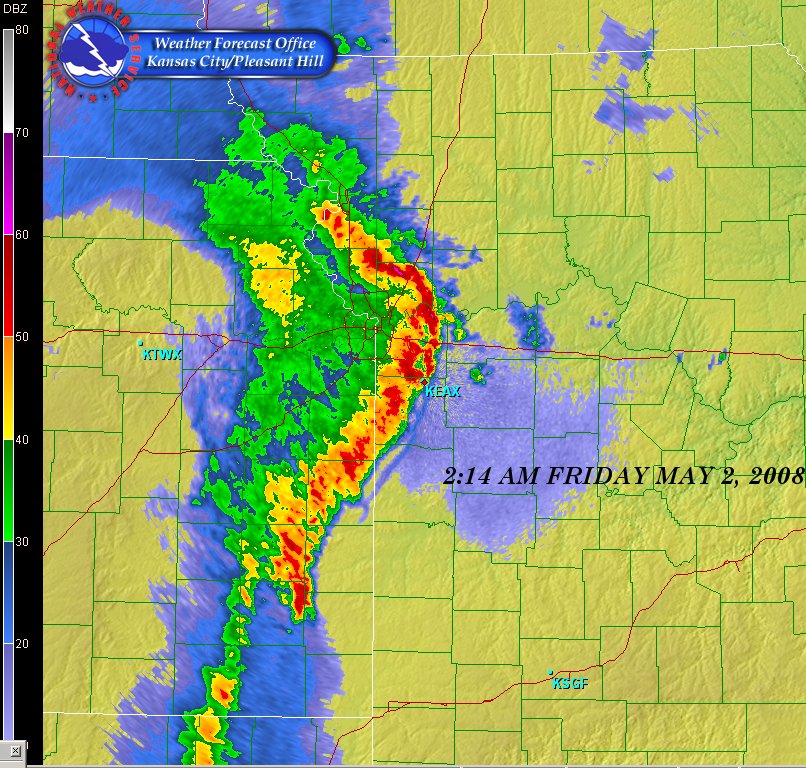
    A bow echo is a radar signature that indicates the presence of a strong, linear wind storm known as a derecho. This feature appears as a bow-shaped line of storms on the radar display, with the apex of the bow pointing in the direction of the storm’s movement. Bow echoes are often associated with widespread damaging winds, which can exceed 100 mph in extreme cases.

The formation of a bow echo is related to the development of a strong rear-inflow jet behind the main line of storms. This jet of fast-moving air descends to the surface and spreads out, causing the line of storms to bow outward. As the rear-inflow jet continues to strengthen, it can lead to the formation of embedded circulations within the line, known as mesovortices, which can produce brief, spin-up tornadoes.

  1. Debris Ball:
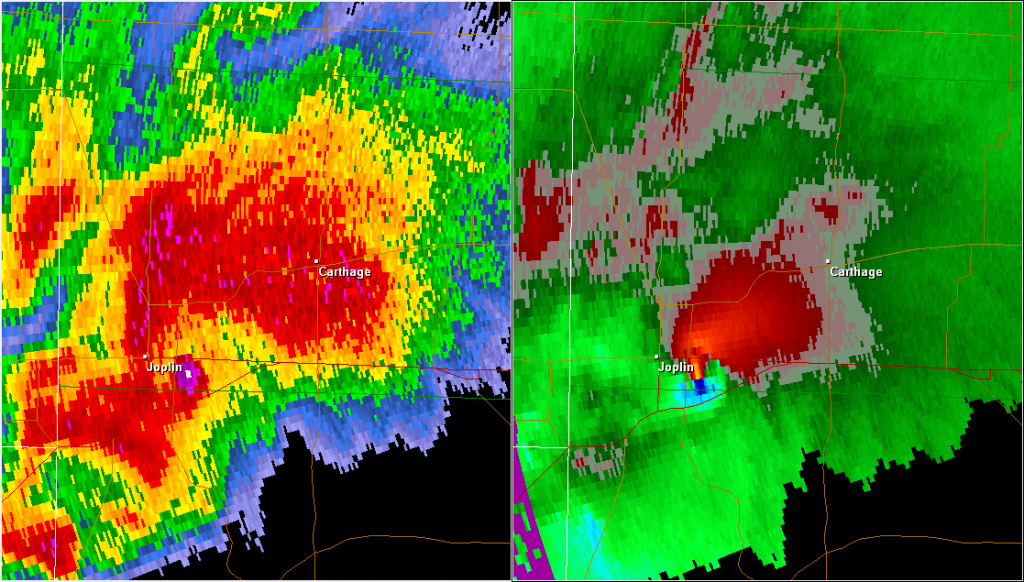
    A debris ball, also known as a tornado debris signature (TDS), is a radar feature that indicates the presence of lofted debris associated with a tornado. This signature appears as a localized area of high reflectivity (bright colors) on the radar display, often coinciding with the location of a hook echo or other tornado-related features.

The debris ball is caused by the tornado lofting large amounts of debris, such as trees, building materials, and other objects, high into the air. When the radar beam intersects this debris, it produces a strong return signal, which appears as a bright, concentrated area on the radar display. The presence of a debris ball is a strong indication that a tornado is causing damage on the ground.

  1. Three-Body Scatter Spike (TBSS):
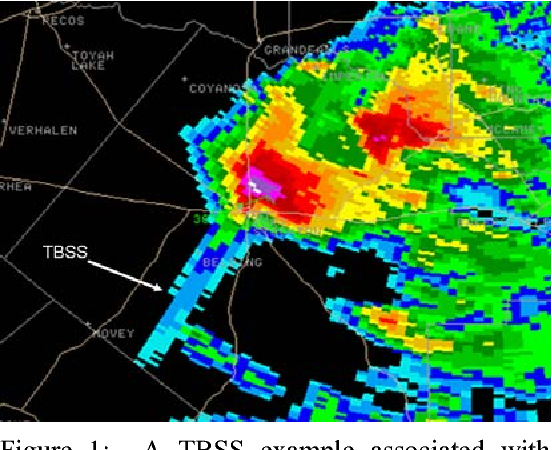
    A three-body scatter spike is a radar signature that can indicate the presence of a large hail core within a thunderstorm. This feature appears as a narrow, linear spike of high reflectivity extending radially outward from the storm on the radar display. The TBSS is caused by the radar beam reflecting off a layer of large hailstones and then reflecting again off the ground before returning to the radar.

The presence of a TBSS suggests that the storm contains a significant amount of large hail, which can cause extensive damage to property and pose a serious risk to public safety. When a TBSS is detected, it is important to issue warnings for large hail and to advise people to seek shelter immediately.

  1. Bounded Weak Echo Region (BWER):
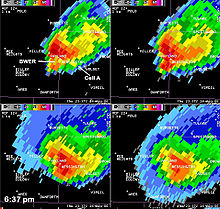
    A bounded weak echo region is a radar feature that indicates the presence of a strong, persistent updraft within a thunderstorm. This feature appears as a localized area of low reflectivity (dark colors) surrounded by higher reflectivity values on the radar display. The BWER is caused by the strong updraft lifting precipitation particles high into the storm, creating a region of relatively low radar returns.

The presence of a BWER suggests that the storm has a powerful updraft, which can support the formation of large hail and tornadoes. When a BWER is detected, it is important to monitor the storm closely for the development of other severe weather signatures, such as hook echoes or debris balls.

  1. Inflow Notch:
    An inflow notch is a radar signature that indicates the presence of strong, localized inflow into a thunderstorm. This feature appears as a small, localized area of low reflectivity (dark colors) along the leading edge of the storm on the radar display. The inflow notch is caused by the rapid inflow of warm, moist air into the storm, which can fuel the development of strong updrafts and severe weather.

The presence of an inflow notch suggests that the storm is actively ingesting warm, moist air, which can lead to rapid intensification and the formation of severe weather hazards, such as large hail, damaging winds, and tornadoes. When an inflow notch is detected, it is important to monitor the storm closely for the development of other severe weather signatures.

  1. Rear Inflow Notch (RIN):
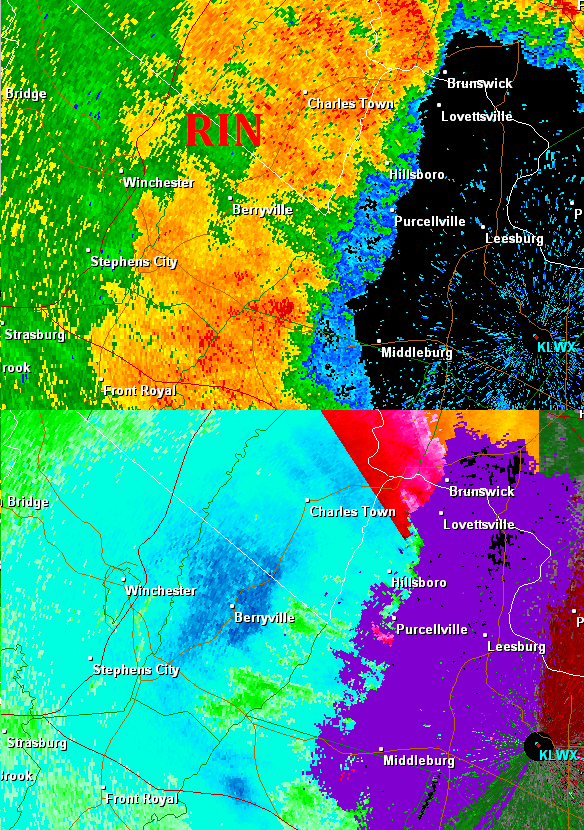
    A rear inflow notch is a radar feature that indicates the presence of strong, localized inflow into the back side of a thunderstorm. This feature appears as a small, localized area of low reflectivity (dark colors) along the rear flank of the storm on the radar display. The RIN is caused by the rapid inflow of cooler, drier air into the storm, which can help to strengthen the storm’s updraft and increase the potential for severe weather.

The presence of a RIN suggests that the storm is actively ingesting cooler, drier air on its back side, which can lead to the formation of a strong rear-flank downdraft (RFD). The RFD can help to tighten the storm’s rotation and increase the risk of tornadogenesis. When a RIN is detected, it is important to monitor the storm closely for the development of hook echoes, debris balls, and other tornado-related signatures.

  1. Hail Spike:
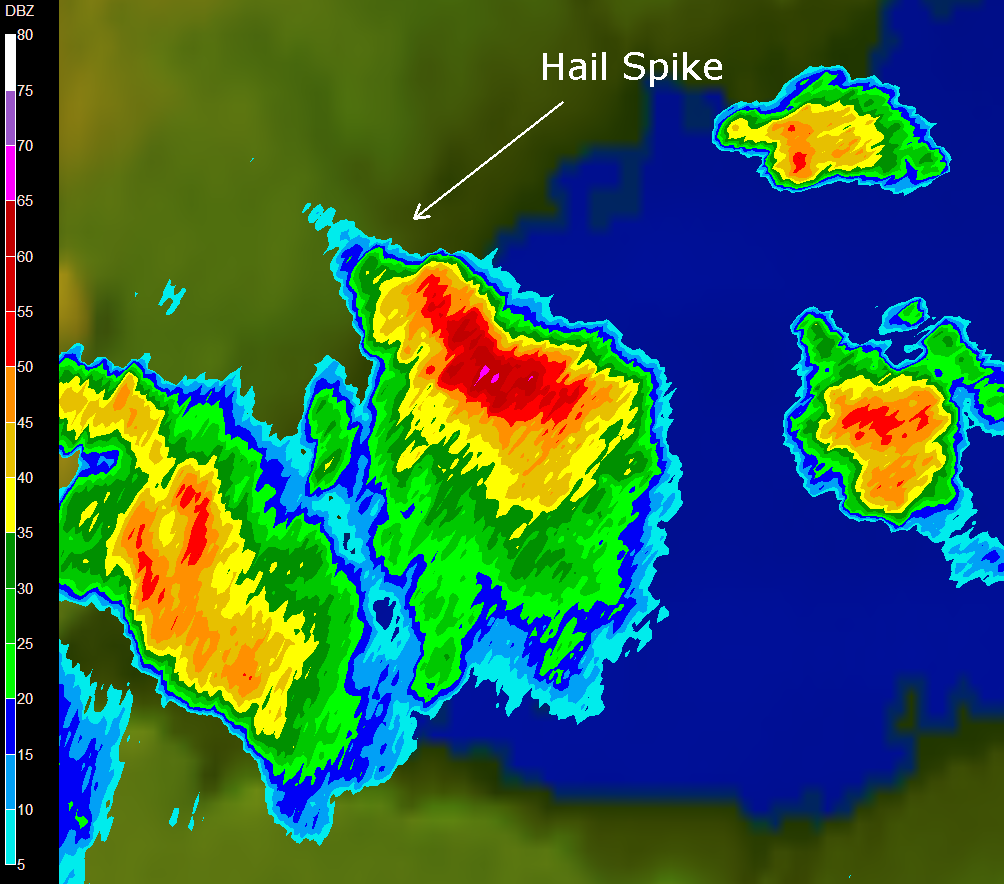
    A hail spike is a radar signature that indicates the presence of a strong updraft capable of producing large hail. This feature appears as a narrow, vertical spike of high reflectivity extending upward from the storm on the radar display. The hail spike is caused by the strong updraft lofting large hailstones high into the storm, where they can grow even larger before falling back to the ground.

The presence of a hail spike suggests that the storm has a powerful updraft that can support the formation of large, damaging hail. When a hail spike is detected, it is important to issue warnings for large hail and to advise people to seek shelter immediately.

Hurricanes and Climate Change: Is There a Connection?

As the world grapples with the increasingly visible effects of climate change, one question that often arises is whether there is a link between global warming and the frequency and intensity of hurricanes. To shed light on this complex issue, we spoke with leading climate scientists and examined the latest research on the subject.

The Basics of Hurricane Formation:
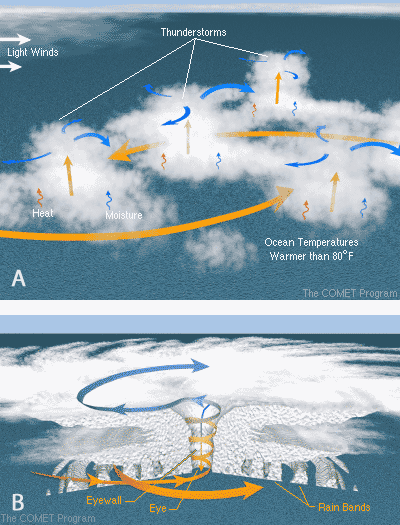
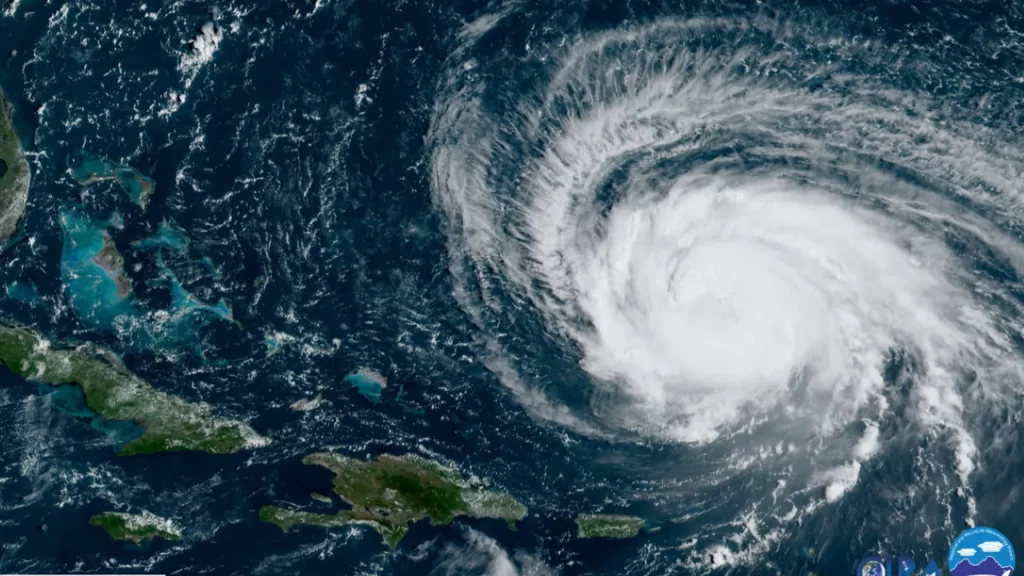
Before going into the potential connection between hurricanes and climate change, it’s key to understand how these powerful storms form. Hurricanes, also known as tropical cyclones, are fueled by warm ocean waters and low wind shear. As warm, moist air rises from the ocean surface, it creates an area of low pressure, which draws in more air from surrounding areas. This process continues, causing the storm to rotate and intensify.

Rising Sea Surface Temperatures:
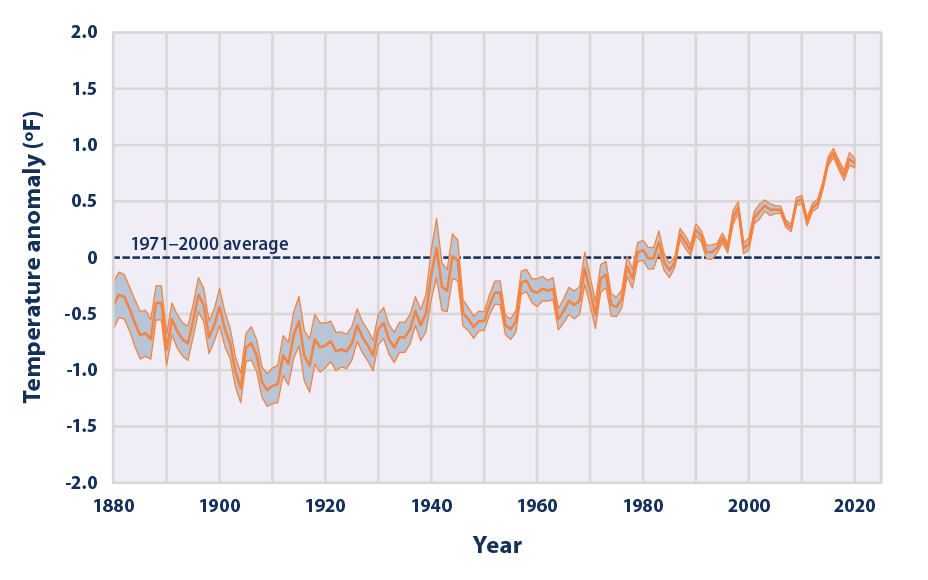
One of the most significant factors that climate scientists point to when discussing the potential link between hurricanes and climate change is rising sea surface temperatures. According to the National Oceanic and Atmospheric Administration (NOAA), global ocean temperatures have increased by approximately 0.13°F (0.07°C) per decade since 1901. This trend is particularly pronounced in the tropical regions where hurricanes form.

Dr. James Kossin, a climate scientist at NOAA’s National Centers for Environmental Information, explains, “Warmer ocean temperatures provide more energy for hurricanes to form and intensify. As the climate continues to warm, we expect to see more instances of rapidly intensifying hurricanes, which can be particularly dangerous because they give coastal communities less time to prepare.”

Increased Water Vapor in the Atmosphere:
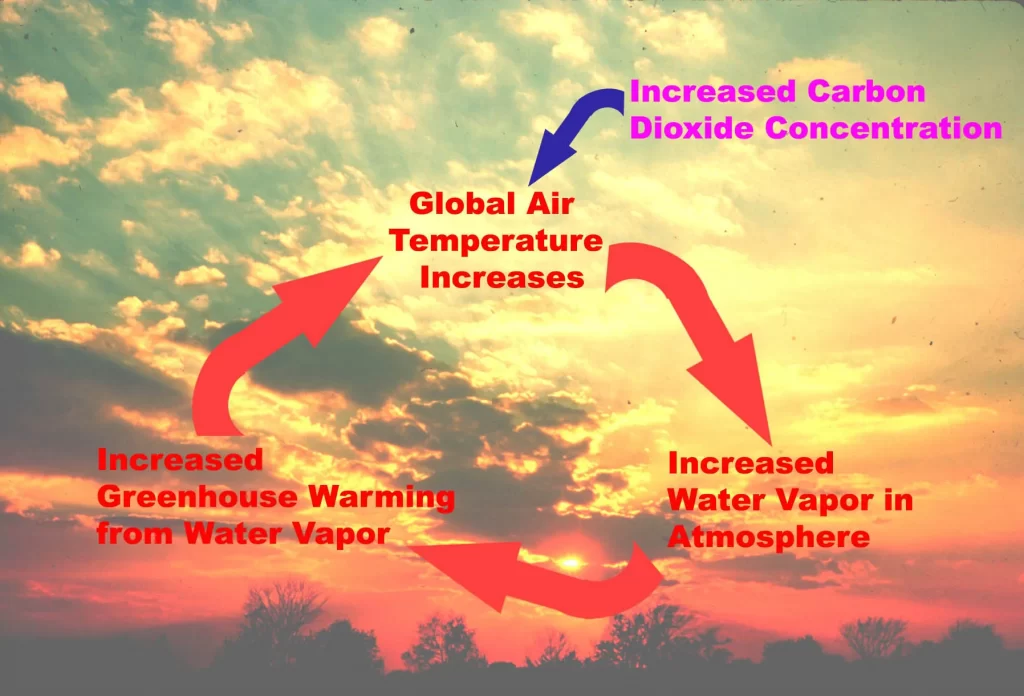
Another factor that may contribute to the intensification of hurricanes is the increased water vapor in the atmosphere due to global warming. As the Earth’s surface temperatures rise, more water evaporates from the oceans and land, leading to higher humidity levels.

Dr. Kerry Emanuel, a professor of atmospheric science at the Massachusetts Institute of Technology, notes, “The amount of water vapor in the atmosphere has increased by about 7% since the 1970s, which is consistent with the expected effect of global warming. This extra moisture can fuel more intense hurricanes, as well as lead to heavier rainfall during these events.”

The Debate on Hurricane Frequency:
While there is growing evidence to suggest that climate change may lead to more intense hurricanes, the question of whether global warming is causing an increase in the frequency of these storms is still a topic of debate among climate scientists.

A 2015 study published in the journal Nature Climate Change found that the frequency of global hurricane activity has remained relatively stable since the 1970s. However, the study also noted that the proportion of Category 4 and 5 hurricanes—the most intense storms on the Saffir-Simpson scale—has increased significantly during this period.

Dr. Tom Knutson, a research meteorologist at NOAA’s Geophysical Fluid Dynamics Laboratory, cautions, “While we have not seen a clear trend in the overall frequency of hurricanes, it’s important to recognize that even a small increase in the proportion of the most intense storms can have devastating consequences for coastal communities.”

Recent Hurricane Seasons:
The 2020 Atlantic hurricane season was one of the most active on record, with 30 named storms, 13 of which reached hurricane strength. This season also saw a record-breaking 12 landfalling storms in the United States, causing billions of dollars in damage and claiming dozens of lives.

While it’s difficult to attribute any single hurricane season to climate change, Dr. Kossin points out, “The 2020 season exhibited many of the characteristics we expect to see more of in a warming world, such as rapidly intensifying storms and increased rainfall rates. It’s a reminder that we need to be prepared for more extreme hurricane seasons in the future.”

The Need for Further Research:
Despite the growing body of evidence suggesting a link between climate change and hurricane intensity, climate scientists stress the need for continued research to better understand this complex relationship.

Dr. Emanuel emphasizes, “While we have made significant progress in understanding how global warming may affect hurricanes, there are still many uncertainties. We need to invest in more advanced modeling techniques and observational tools to improve our ability to predict and prepare for these storms.”

Recent hurricanes:

  1. 2023: 8 hurricanes, highest category – Category 5 (Hurricane Lee)
  2. 2022: 8 hurricanes, highest category – Category 4 (Hurricane Ian)
  3. 2021: 7 hurricanes, highest category – Category 4 (Hurricane Ida)
  4. 2020: 14 hurricanes, highest category – Category 4 (Hurricane Iota)
  5. 2019: 3 hurricanes, highest category – Category 5 (Hurricane Dorian)
  6. 2018: 8 hurricanes, highest category – Category 5 (Hurricane Michael)
  7. 2017: 10 hurricanes, highest category – Category 5 (Hurricane Irma and Hurricane Maria)
  8. 2016: 7 hurricanes, highest category – Category 5 (Hurricane Matthew)
  9. 2015: 4 hurricanes, highest category – Category 4 (Hurricane Joaquin)
  10. 2014: 6 hurricanes, highest category – Category 4 (Hurricane Gonzalo)
  11. 2013: 2 hurricanes, highest category – Category 1 (Hurricane Humberto and Hurricane Ingrid)

For comparison here’s the 1980s:

  1. 1989: 7 hurricanes, highest category – Category 4 (Hurricane Hugo)
  2. 1988: 5 hurricanes, highest category – Category 3 (Hurricane Gilbert)
  3. 1987: 3 hurricanes, highest category – Category 3 (Hurricane Emily)
  4. 1986: 4 hurricanes, highest category – Category 3 (Hurricane Bonnie)
  5. 1985: 7 hurricanes, highest category – Category 3 (Hurricane Gloria)
  6. 1984: 5 hurricanes, highest category – Category 4 (Hurricane Diana)
  7. 1983: 4 hurricanes, highest category – Category 3 (Hurricane Alicia)
  8. 1982: 2 hurricanes, highest category – Category 1 (Hurricane Alberto and Hurricane Debby)
  9. 1981: 7 hurricanes, highest category – Category 3 (Hurricane Harvey)
  10. 1980: 9 hurricanes, highest category – Category 4 (Hurricane Allen)

20 Game-Changing Weather Apps You Can’t Afford to Miss

In today’s world, being prepared for changing weather conditions is crucial. Fortunately, there are numerous weather apps available that can help you stay informed and safe. Here are 20 game-changing weather apps you can’t afford to miss:

  • Dark Sky
    This app is known for its accurate hyperlocal forecasts and beautiful radar maps. It provides down-to-the-minute updates and alerts for precipitation, temperature, and severe weather events, making it a reliable choice for staying on top of changing weather conditions.
  • Hail No
    Defend yourself from hailstorms with Hail No, the first hail app to provide real-time tracking and alert notifications. See where the hail is, create a defensive radius around any location, and get automatic alerts. Hail No provides access to the National Severe Storms Laboratory hail algorithm, the most accurate available, ensuring you’re always aware of potential hail threats.
    Apple: https://apps.apple.com/us/app/hail-no/id1469253867
  • WeatherBug
    WeatherBug is a comprehensive weather app that offers real-time weather data, radar maps, and severe weather alerts. It also includes features like pollen and air quality forecasts, making it a great choice for those with allergies or respiratory issues. Stay informed about changing weather conditions and potential health impacts with WeatherBug.
  • Tornado Vision
    See severe weather with augmented reality! Tornado Vision can help you see tornadoes hiding in the rain or at night. Simply point your phone at any severe storm, and you’ll get a heads-up display on what is happening inside the storm. This groundbreaking weather technology provides information on the chance of a tornado, hail size, wind speed, and more, right on your screen.
    iOS: https://apps.apple.com/us/app/tornado-vision/id1469550036
    Android: https://play.google.com/store/apps/details?id=com.tornadovision.app.presentation&hl=en&gl=US&pli=1
  • RadarScope
    Designed for weather enthusiasts and professionals, RadarScope is a powerful radar app that provides high-resolution radar data, storm tracking, and advanced analysis tools. Dive deep into weather data and gain a comprehensive understanding of weather patterns with this feature-rich app.
  • Predict Now
    Predict Now is a powerful weather app that provides hyperlocal forecasts and real-time alerts for severe weather events. With its user-friendly interface and advanced features, you can stay ahead of the game and plan your activities accordingly, ensuring you’re always prepared for changing weather conditions.
    Apple: https://apps.apple.com/us/app/predict-now/id1481839520
  • NOAA Weather Radar Live
    This free app provides access to real-time weather radar data from the National Oceanic and Atmospheric Administration (NOAA). Stay informed about severe weather events in your area with up-to-date radar information from a trusted source.
  • Weather Underground
    Weather Underground is a comprehensive weather app that offers hyperlocal forecasts, radar maps, and severe weather alerts. It also includes a community feature that allows users to share weather observations and photos, creating a collaborative weather-tracking experience.
  • AccuWeather
    AccuWeather is a popular weather app known for its accurate forecasts and user-friendly interface. It provides detailed weather information, including hourly and daily forecasts, radar maps, and severe weather alerts, ensuring you have all the information you need to plan your day.
  • The Weather Channel
    The Weather Channel app is a reliable source for weather information, offering forecasts, radar maps, and severe weather alerts. It also includes features like hurricane tracking and ski resort conditions, making it a versatile choice for various weather-related activities.
  • Clime: NOAA Weather Radar
    Clime: NOAA Weather Radar is a free app that provides access to real-time weather radar data from NOAA. Stay informed about severe weather events in your area with this simple yet effective app.
  • MyRadar Weather Radar
    MyRadar Weather Radar is a powerful app that offers high-resolution radar data, severe weather alerts, and customizable settings. Tailor the app to your specific needs and get a detailed view of weather conditions in your area.
  • Windy
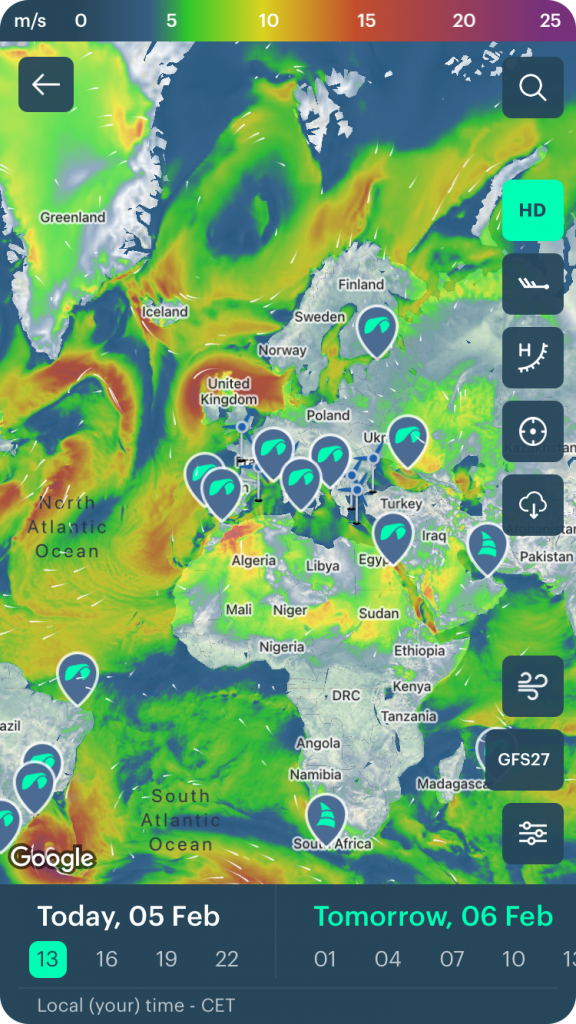
    Windy is a unique weather app that focuses on wind forecasts and patterns. It provides detailed wind maps, as well as forecasts for temperature, precipitation, and other weather conditions, making it an excellent choice for outdoor enthusiasts and those interested in wind-related activities.
  • Weather Mate
    Weather Mate is a comprehensive weather app that offers hyperlocal forecasts, radar maps, and severe weather alerts. It also includes features like air quality and pollen forecasts, making it a great choice for those with allergies or respiratory issues. Stay informed about weather conditions and potential health impacts with this all-in-one app.
  • Carrot Weather
    Carrot Weather is a unique weather app that combines accurate forecasts with a quirky and humorous personality. It provides detailed weather information, including hourly and daily forecasts, radar maps, and severe weather alerts, all delivered with a touch of humor to make weather tracking more enjoyable.
  • Storm Radar
    Storm Radar is a powerful app that provides real-time radar data, severe weather alerts, and storm tracking capabilities. Stay informed about severe weather events in your area and track storms with this comprehensive app.
  • Weather Live
    Weather Live is a comprehensive weather app that offers hyperlocal forecasts, radar maps, and severe weather alerts. It also includes features like air quality and pollen forecasts, making it a great choice for those with allergies or respiratory issues. Stay informed about weather conditions and potential health impacts with this versatile app.
  • Flowx
    Flowx is a unique weather app that focuses on visualizing weather patterns and forecasts. It provides detailed weather information, including wind patterns, precipitation, and temperature, in a visually stunning format, making it an excellent choice for those who appreciate beautiful data visualization.
  • Weather Maps
    Weather Maps is a powerful app that provides detailed weather maps and forecasts for various weather conditions, including precipitation, temperature, wind, and more. Get a comprehensive view of weather patterns with this data-rich app.
  • Weather Radar by ICM
    Weather Radar by ICM is a free app that provides access to real-time weather radar data from various sources, including NOAA and Environment Canada. Stay informed about severe weather events in your area with this simple yet effective app.

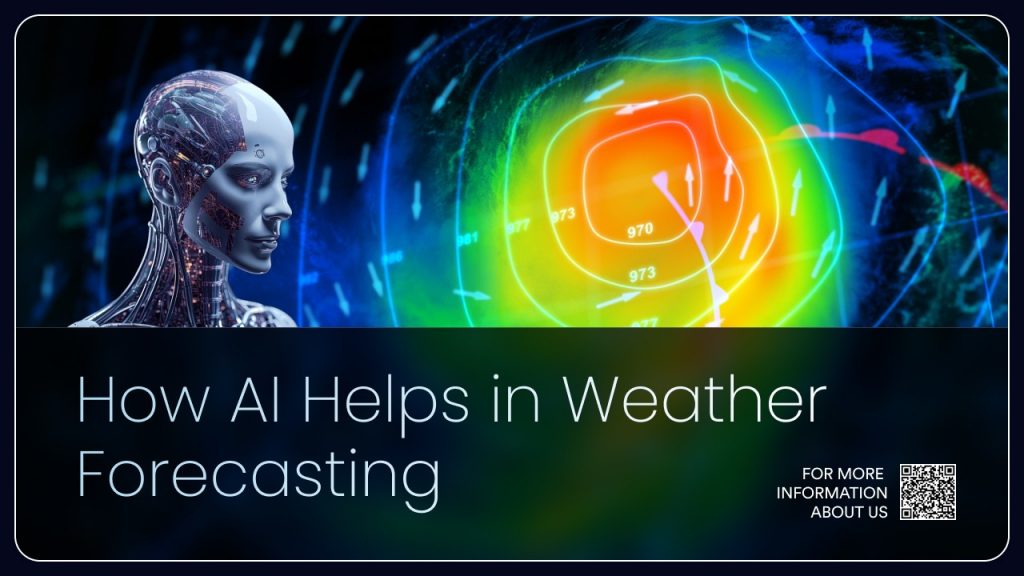
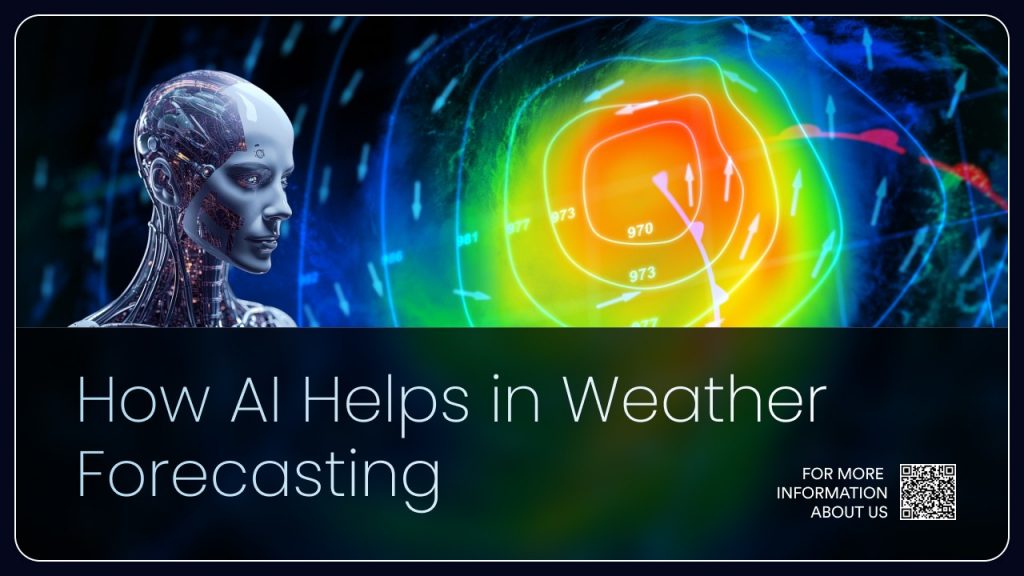
The Future of Weather Forecasting: How AI is Revolutionizing Meteorology

One of the key ways AI is being used in weather forecasting is through machine learning algorithms. These algorithms can analyze vast amounts of historical weather data, including temperature, humidity, wind speed, and precipitation, to identify patterns and make predictions about future weather events. By continuously learning from new data, these algorithms can improve their accuracy over time, leading to more reliable forecasts.

Another area where AI is making a significant impact is in the interpretation of weather satellite imagery. Traditional methods of analyzing satellite data can be time-consuming and prone to human error. However, AI-powered systems can quickly and accurately identify weather patterns and anomalies in satellite images, providing meteorologists with valuable insights into developing weather systems.

AI is also being used to improve the resolution and accuracy of weather models. By incorporating machine learning techniques, researchers can create more detailed and precise models that can simulate weather conditions down to the neighborhood level. This level of granularity can be particularly useful for predicting the impact of severe weather events, such as hurricanes and tornadoes, on specific communities.

In addition to improving the accuracy of weather forecasts, AI is also helping to make them more accessible and user-friendly. Many weather apps and websites now use AI-powered chatbots and virtual assistants to provide personalized weather information and alerts based on a user’s location and preferences. This can help individuals and businesses make more informed decisions about their daily activities and operations.

Title: The Future Potential of AI in Weather Forecasting: Building on Google’s GraphCast

Google’s GraphCast represents a significant advancement in the field of weather forecasting, utilizing artificial intelligence (AI) and Graph Neural Networks (GNNs) to deliver highly accurate 10-day weather predictions in a fraction of the time required by traditional methods. This groundbreaking technology not only improves the accuracy and efficiency of weather forecasts but also demonstrates the potential for AI to revolutionize the field of meteorology.

One of the most promising aspects of GraphCast is its ability to identify and predict extreme weather events, such as cyclones, atmospheric rivers, and heat waves, with greater accuracy and lead time than traditional forecasting models. This early warning capability could prove invaluable in saving lives and minimizing the impact of severe weather on communities. As AI continues to advance, it is likely that models like GraphCast will become even more adept at detecting and predicting these extreme events, allowing for better preparedness and response.

Looking to the future, the potential applications of AI in weather forecasting are vast. By building upon the foundation laid by GraphCast, researchers and meteorologists could develop even more sophisticated models that incorporate additional data sources, such as satellite imagery, radar, and weather station observations. These enhanced models could provide even greater accuracy and granularity in weather predictions, allowing for more localized and personalized forecasts. Additionally, AI could be used to develop long-term climate models, helping scientists better understand and predict the impacts of climate change on weather patterns and extreme events. As the world continues to grapple with the challenges posed by a changing climate, the insights provided by AI-powered weather and climate models will become increasingly critical in informing policy decisions and guiding adaptation and mitigation efforts.

Despite the many benefits of AI in weather forecasting, there are also some challenges and limitations to consider. One concern is the potential for AI systems to perpetuate biases or errors in historical weather data, leading to inaccurate predictions. Another challenge is the need for large amounts of high-quality data to train and validate AI models, which can be difficult and expensive to obtain.

Despite these challenges, the future of weather forecasting looks bright thanks to the continued advancement of AI technologies. As more data becomes available and AI algorithms become more sophisticated, we can expect to see even more accurate and detailed weather forecasts in the years to come. This will not only help us better prepare for and respond to severe weather events but also enable us to make more informed decisions about everything from agriculture to transportation to energy production.

How Hurricanes Form: The Genesis of a Cyclone

The birth of a hurricane is a fascinating process, often starting from inconspicuous beginnings that evolve into powerful storms capable of wreaking havoc. Let’s delve into the early stages of hurricane development, where seemingly innocuous atmospheric disturbances transform into organized systems with the potential for destruction.

Tropical Wave: The Seed of a Storm

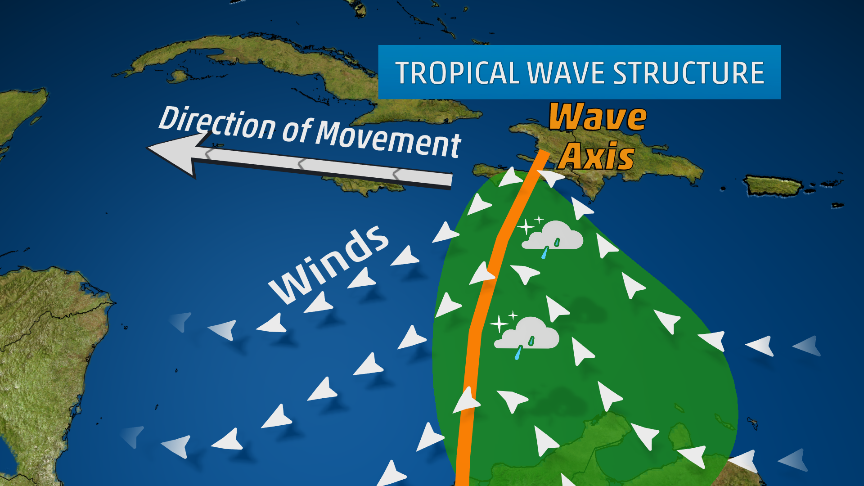
The journey often begins with a tropical wave, an elongated area of low pressure that originates over the warm waters of the tropics, often off the west coast of Africa. These waves, propelled by easterly trade winds, travel westward across the Atlantic Ocean, carrying showers and thunderstorms within their midst. While most tropical waves dissipate harmlessly, some possess the ingredients necessary to evolve into something more ominous.

  • Warm Ocean Waters: Hurricanes draw their energy from warm ocean waters, typically with surface temperatures of at least 80°F (26.5°C). This heat provides the fuel for the storm’s development and intensification.
  • Coriolis Effect: The Earth’s rotation creates a force known as the Coriolis effect, which causes winds to deflect to the right in the Northern Hemisphere and to the left in the Southern Hemisphere. This deflection plays a crucial role in the cyclonic rotation of hurricanes.
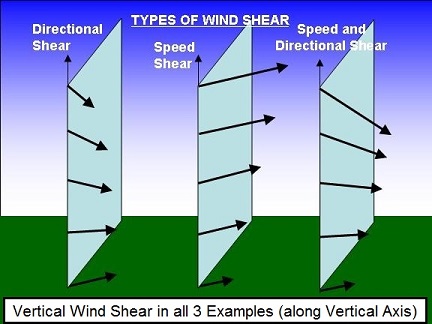
  • Low Vertical Wind Shear: Vertical wind shear refers to the change in wind speed and direction with height. Low wind shear allows the storm to develop and maintain its vertical structure, while high wind shear can disrupt the storm’s organization.
  • Pre-existing Disturbance: A pre-existing weather disturbance, such as a tropical wave or a cluster of thunderstorms, provides the initial seed for hurricane formation.

Evolution from Disturbance to Depression:

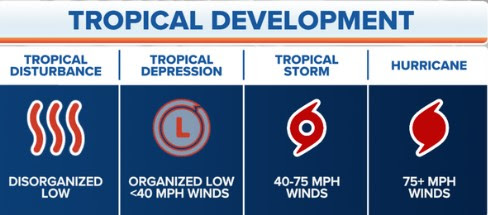
If a tropical wave encounters these favorable conditions, it can begin to organize and intensify. As thunderstorms cluster around the area of low pressure, a tropical disturbance forms. If the circulation becomes more defined and wind speeds reach up to 38 mph (62 kph), it is classified as a tropical depression.

The Critical Transition to Tropical Storm:

The transition from a tropical depression to a tropical storm marks a significant step in the storm’s development. As the wind speeds increase to 39-73 mph (63-118 kph), the storm becomes more organized and develops a distinct cyclonic circulation. At this stage, it receives a name and is officially recognized as a tropical storm, posing a potential threat to land areas within its path.

Stages of Hurricane Development:

  1. Tropical Disturbance: A cluster of thunderstorms with a weak circulation forms over warm ocean waters.
  2. Tropical Depression: The circulation becomes more organized, and wind speeds reach up to 38 mph (62 kph).
  3. Tropical Storm: Wind speeds increase to 39-73 mph (63-118 kph), and the storm receives a name.
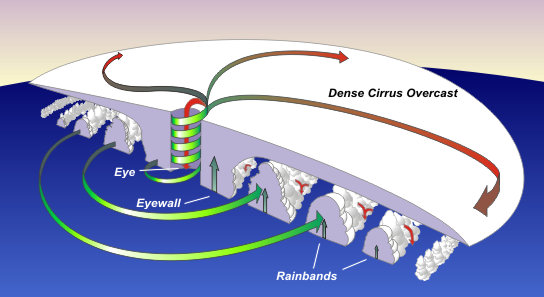
  4. Hurricane: Wind speeds reach 74 mph (119 kph) or higher, and the storm exhibits a well-defined eye surrounded by a ring of intense thunderstorms known as the eyewall.

Eye and Eyewall Dynamics:

The eye of the hurricane is a relatively calm area of low pressure surrounded by the eyewall, the region of highest winds and heaviest rainfall. Air rises rapidly in the eyewall, releasing latent heat and fueling the storm’s intensity. The eye forms as a result of the balance between the inward-flowing air and the upward-rising air in the eyewall.

Factors Influencing Intensity:

Several factors influence hurricane intensity, including:

  • Sea surface temperatures: Warmer waters provide more energy for the storm to intensify.
  • Ocean heat content: The depth of warm water also plays a role, as deeper warm layers provide more sustained energy for the hurricane.
  • Atmospheric moisture: Higher moisture content in the atmosphere can fuel stronger thunderstorms and contribute to intensification.
  • Upper-level atmospheric conditions: Favorable upper-level winds can help vent the storm and promote further intensification.

Understanding Hurricane Categories and Associated Damage

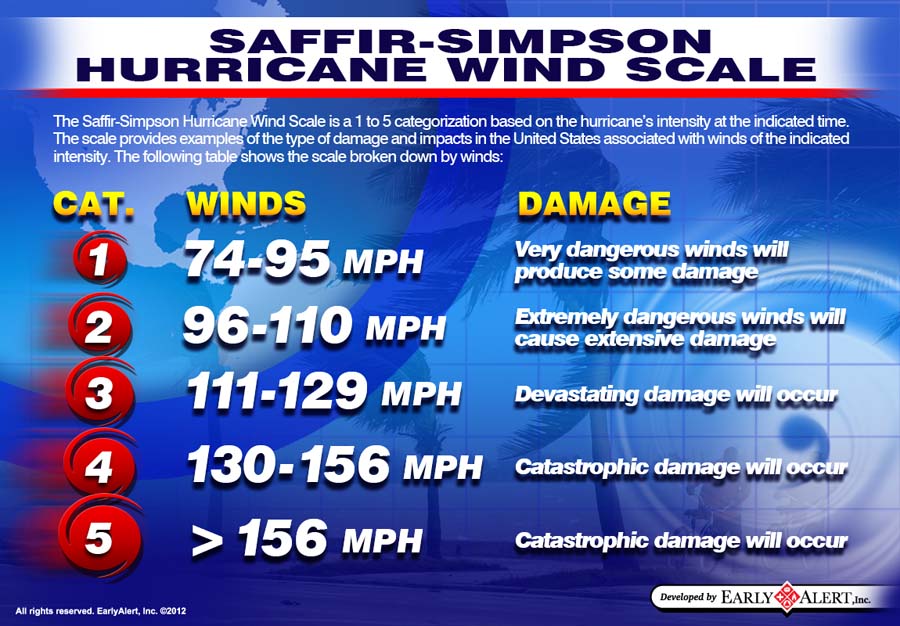
Hurricane categories, based on the Saffir-Simpson Hurricane Wind Scale, classify these storms based on their maximum sustained wind speeds and the potential damage they can inflict. This scale helps communicate the severity of a hurricane and guide preparedness efforts.

Category 1 (74-95 mph):

  • Damage: Primarily to trees and foliage, with some damage to roofs, siding, and unanchored mobile homes. Power outages are likely.
  • Historical Examples: Hurricane Gaston (2004), Hurricane Humberto (2019)

Category 2 (96-110 mph):

  • Damage: Extensive damage to trees and foliage, with significant damage to roofs, siding, and mobile homes. Power outages can last for days or weeks.
  • Historical Examples: Hurricane Frances (2004), Hurricane Zeta (2020)

Category 3 (111-129 mph):

  • Damage: Devastating damage to trees and foliage, with major damage to roofs, siding, and mobile homes. Structural damage to small buildings is possible. Power and water outages can last for extended periods.
  • Historical Examples: Hurricane Katrina (2005), Hurricane Irma (2017)

Category 4 (130-156 mph):

  • Damage: Catastrophic damage to trees and foliage, with severe damage to well-built homes. Roofs can be completely torn off, and exterior walls can collapse. Power outages can last for weeks or even months. Extensive coastal flooding and inland flooding are expected.
  • Historical Examples: Hurricane Harvey (2017), Hurricane Maria (2017)

Category 5 (157 mph or higher):

  • Damage: The most catastrophic damage, with complete roof failure and wall collapse on many residential and industrial buildings. Most trees will be snapped or uprooted. Power outages can last for months, and areas may be uninhabitable for extended periods.
  • Historical Examples: Hurricane Andrew (1992), Hurricane Michael (2018)

The Midwest Derecho: An Unforgettable Tempest’s Trail of Wind Destruction (August 10, 2020)

The date August 10, 2020, is etched in the memories of millions across the Midwest, a day when the skies unleashed a tempest of unimaginable fury. A derecho, a powerful and expansive windstorm, ripped through the heartland, leaving a trail of devastation that stretched from South Dakota to Ohio. This wasn’t just a storm; it was a meteorological monster, its ferocity exceeding expectations and its impact leaving communities reeling in its wake.

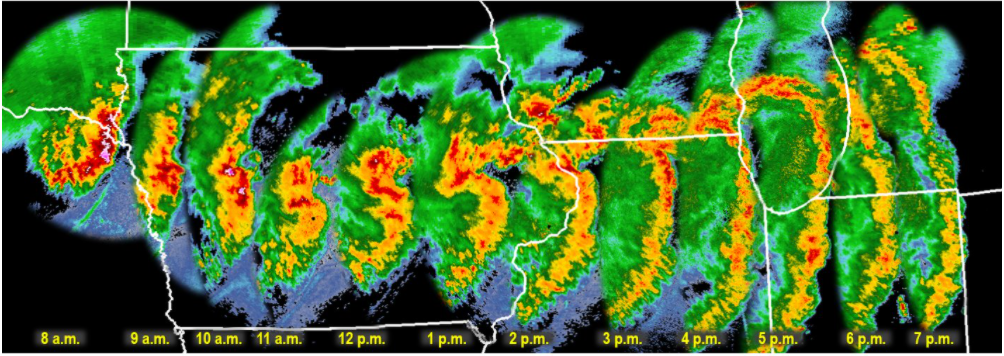
The storm’s genesis lay in the atmospheric instability brewing over South Dakota and Nebraska. Thunderstorms erupted, fueled by a potent mix of warm, moist air and strong upper-level winds. These storms, initially isolated, began to coalesce into a line, forming a squall line, a telltale sign of a developing derecho. This line of storms, propelled by the jet stream, raced eastward at speeds exceeding 70 mph, evolving into a meteorological juggernaut.

Iowa found itself directly in the derecho’s path, bearing the brunt of its wrath. Wind gusts of up to 140 mph, equivalent to a Category 4 hurricane, tore through cities and towns. Cedar Rapids, a city of over 130,000, was particularly devastated. The winds, relentless and unforgiving, peeled roofs off buildings, tossed vehicles like rag dolls, and uprooted centuries-old trees. The city’s landscape was transformed into a scene of utter chaos, with debris littering the streets and power lines dangling precariously.

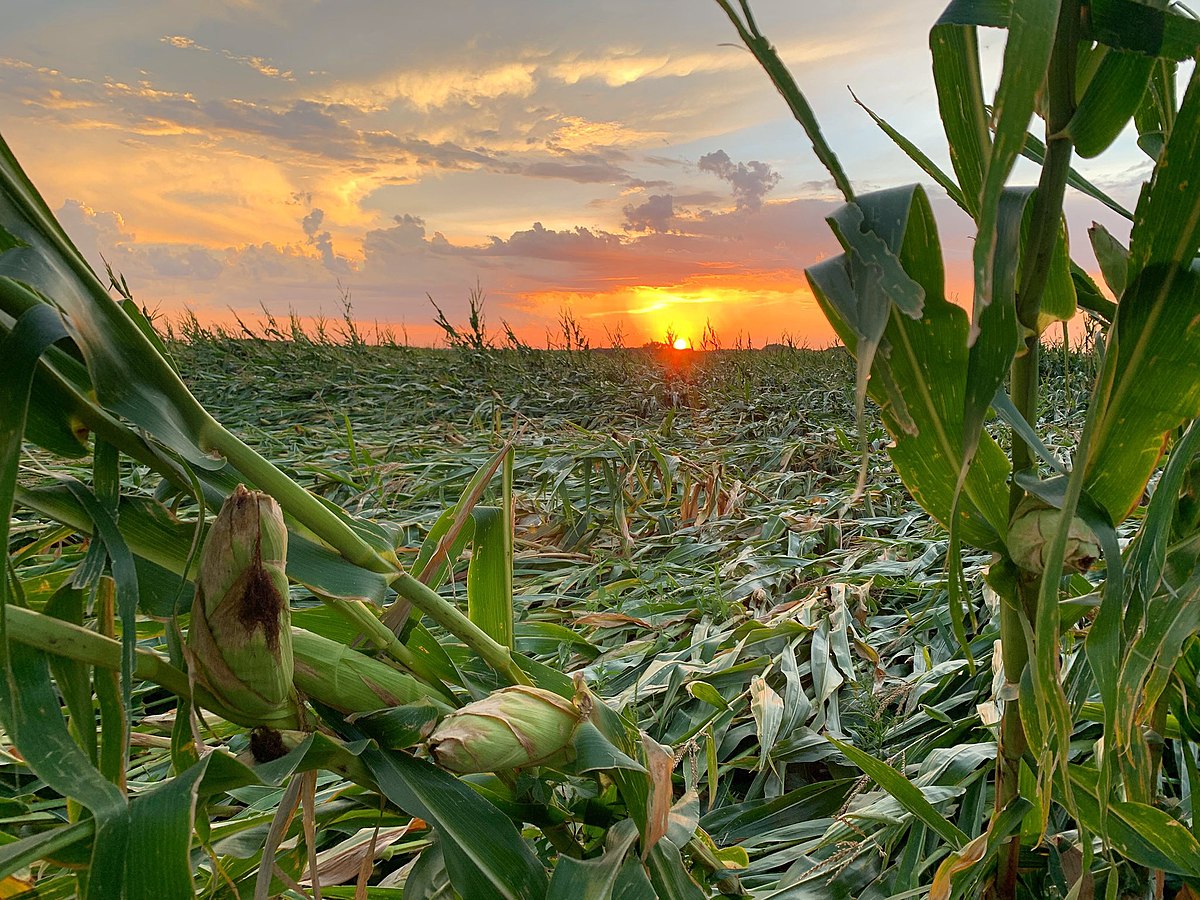
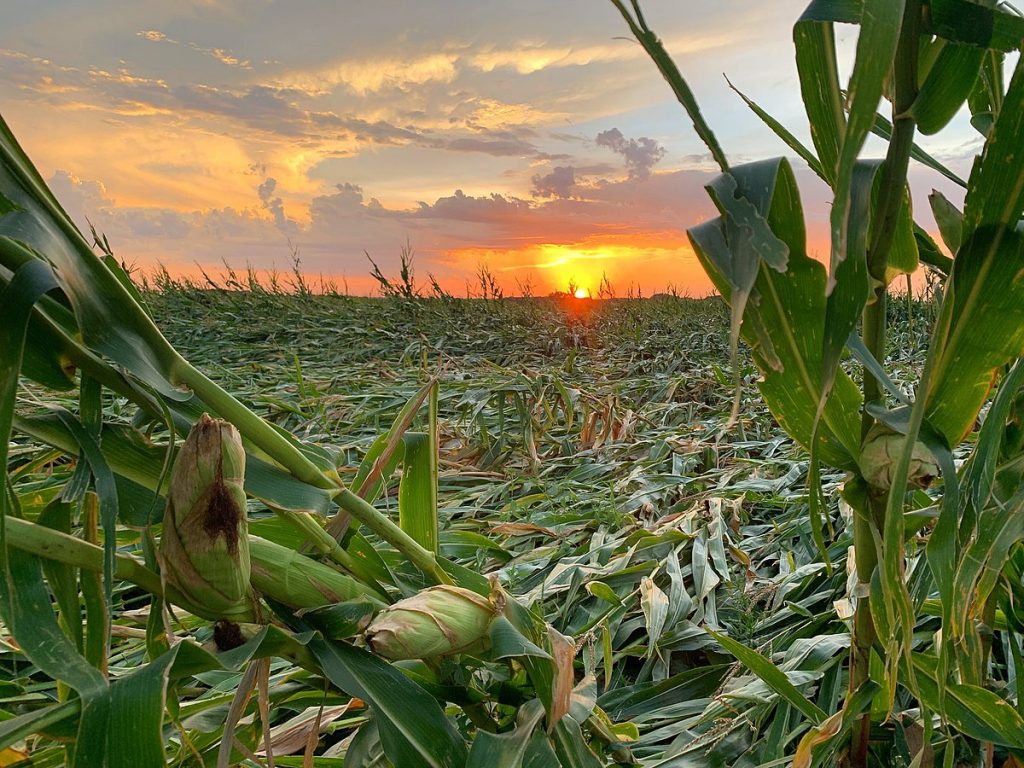
The derecho’s impact extended far beyond Cedar Rapids. Across Iowa, an estimated 14 million acres of cropland were damaged or destroyed, representing roughly a third of the state’s corn and soybean crops. The agricultural industry, the backbone of Iowa’s economy, suffered a staggering blow, with losses estimated in the billions of dollars. The storm’s fury also left millions without power, plunging homes and businesses into darkness and disrupting daily life for weeks.

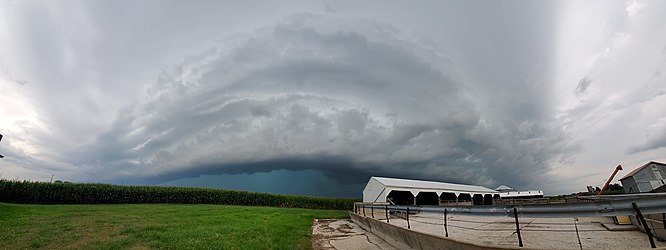
In Cedar Rapids, Iowa, the derecho’s arrival was swift and brutal. At approximately 11:15 am, the sky turned an ominous green as the leading edge of the storm approached. Within minutes, the city was engulfed in a maelstrom of wind and rain. Residents huddled in basements and interior rooms as the deafening roar of the wind filled the air. Trees snapped like twigs, roofs were peeled off buildings, and debris flew through the air like missiles. One resident recounted the terrifying experience of watching a large tree crash through his living room window, narrowly missing him and his family.

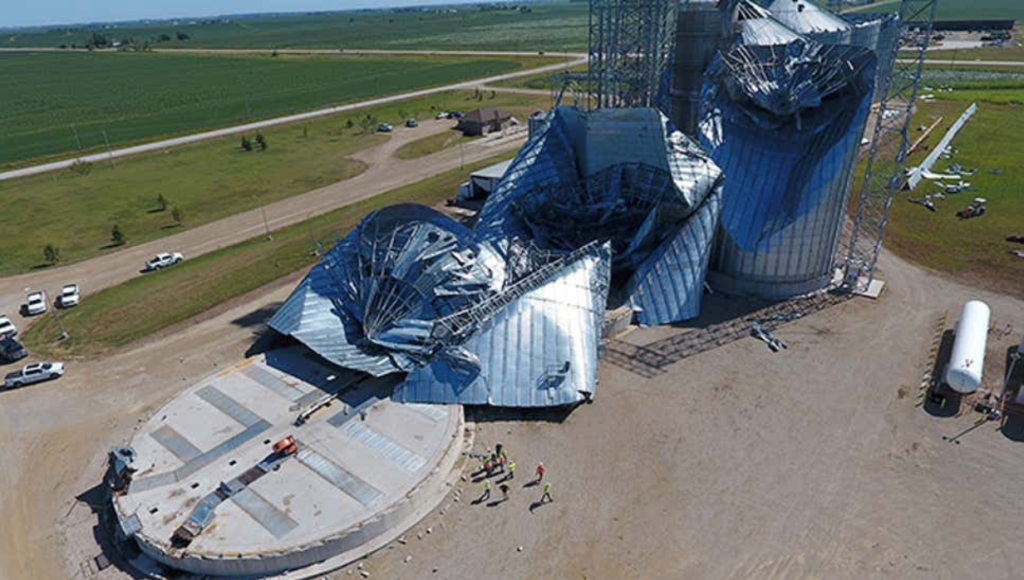
The storm’s impact on rural communities was equally devastating. Farmers watched in disbelief as their corn and soybean fields, once lush and green, were flattened in a matter of minutes. Grain bins were crumpled like soda cans, and barns and outbuildings were reduced to piles of debris. One farmer, who had worked the land for over 50 years, described the scene as “total devastation,” his livelihood wiped away in an instant. The derecho’s impact on agriculture reverberated throughout the region, disrupting supply chains and causing food prices to rise.

As the derecho continued its eastward rampage, it maintained its intensity, leaving its mark on Illinois, Indiana, and Ohio. Chicago experienced wind gusts exceeding 90 mph, causing widespread power outages and bringing the city’s bustling transportation system to a standstill. In Indiana, the storm spawned several tornadoes, adding to the destruction. Even as the derecho weakened, it continued to produce damaging winds and heavy rain, extending its reach over 770 miles and impacting millions.

The meteorological intricacies that birthed and sustained this derecho were complex. A key factor was the presence of a strong upper-level jet stream, which provided the necessary wind shear to organize the thunderstorms into a line and propel them forward at breakneck speeds. Additionally, a pre-existing mesoscale convective system (MCS), a large cluster of thunderstorms, served as the derecho’s building block, providing a source of lift and moisture.

As the derecho matured, it developed a bow echo, a characteristic radar signature associated with destructive straight-line winds. The bow echo, shaped like an archer’s bow, indicated the presence of a powerful downdraft, which spread out upon reaching the ground, generating the hurricane-force winds that ravaged the Midwest. The combination of these factors created a perfect storm, a derecho of unprecedented power and scope.

Derechos have a long and destructive history in the United States, with several notable events leaving their mark on the nation’s memory. One of the most infamous derechos occurred on June 29, 2012, sweeping across the Mid-Atlantic region and causing widespread damage from Indiana to the East Coast. This derecho, known as the “Super Derecho” due to its exceptional intensity and scope, produced wind gusts exceeding 100 mph and left millions without power. The 2012 derecho traveled over 700 miles and caused an estimated $2.9 billion in damage, highlighting the destructive potential of these powerful windstorms.

Another significant derecho event occurred on May 8, 1995, impacting a large portion of the Midwest. This derecho, which originated in Kansas, traveled over 1,000 miles and produced wind gusts of up to 120 mph. The storm caused widespread damage to trees, power lines, and structures, leaving over 2 million people without power. The 1995 derecho was particularly notable for its long duration, lasting for over 12 hours, and its extensive path, which stretched from Kansas to the East Coast.

The Midwest derecho of 2020 stands out for several reasons. Its peak wind gusts of 140 mph were among the highest ever recorded for a derecho, rivaling the intensity of a major hurricane. The storm’s impact on agriculture was particularly severe, with millions of acres of crops damaged or destroyed, causing significant economic losses. Additionally, the derecho’s rapid intensification and relatively short warning time caught many off guard, underscoring the challenges of forecasting and preparing for these powerful windstorms. While derechos are not uncommon in the Midwest, the 2020 event served as a stark reminder of their destructive potential and the importance of remaining vigilant during severe weather events.

The Midwest derecho of 2020 stands as a stark reminder of the unpredictable and destructive nature of severe weather. Its impact extended far beyond the immediate damage to infrastructure and agriculture, leaving a lasting mark on the lives of millions. The storm exposed vulnerabilities in infrastructure and emergency response systems, prompting a reevaluation of preparedness measures and a call for increased investment in resilient infrastructure. As communities rebuild and recover, the memory of the derecho serves as a powerful motivator to strengthen defenses against future storms and ensure the safety and well-being of those who call the Midwest home.