The Hurricane That Changed Everything: How Galveston Reshaped America

In the book of American history, few natural disasters have left as painful a mark as the Great Galveston Hurricane of 1900. This catastrophic storm, which struck the thriving coastal city of Galveston, Texas, on September 8, 1900, remains the deadliest natural disaster in U.S. history, claiming an estimated 6,000 to 12,000 lives. But beyond the staggering loss of life, the Galveston Hurricane also set in motion a series of events and changes that would reshape the nation in profound and lasting ways.

The Rise of Galveston: To understand the full impact of the 1900 hurricane, you must first appreciate Galveston’s prominence at the turn of the 20th century. Located on a barrier island off the Texas coast, Galveston was a booming port city and a center of commerce, culture, and tourism. Its strategic location made it a hub for shipping and trade, with a bustling harbor that rivaled New York and New Orleans.

Galveston’s prosperity was reflected in its grand architecture and vibrant social scene. The city boasted elegant mansions, opulent hotels, and a thriving red-light district that drew visitors from across the country. Its beaches and mild climate made it a popular resort destination, earning it the nickname “The Playground of the South.”

However, Galveston’s low-lying topography also made it vulnerable to hurricanes and flooding. The city had experienced several close calls with major storms in the past, but had always managed to escape catastrophic damage. This luck would run out on September 8, 1900.

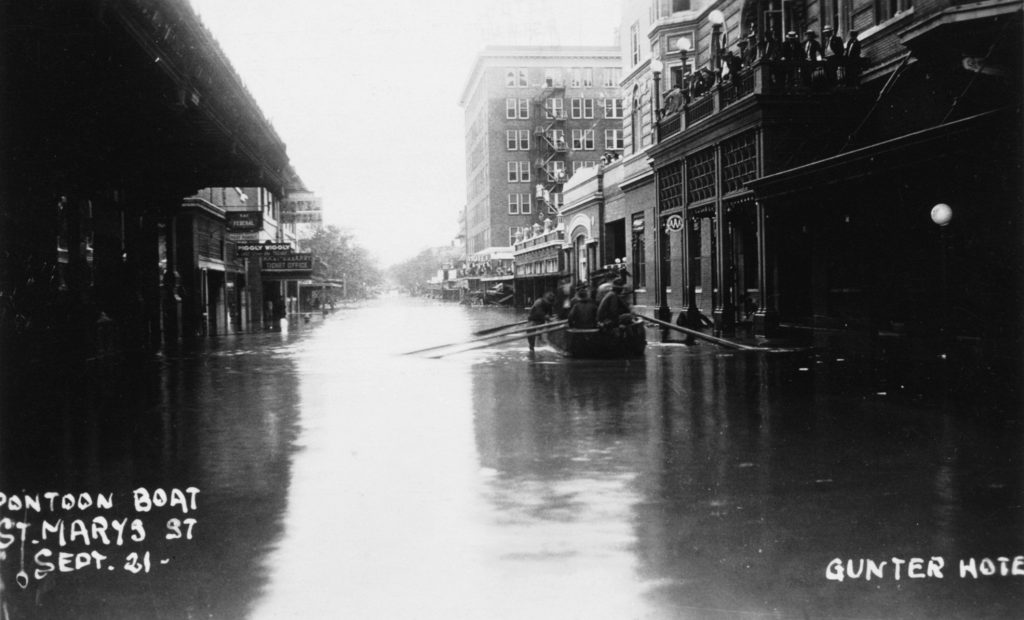
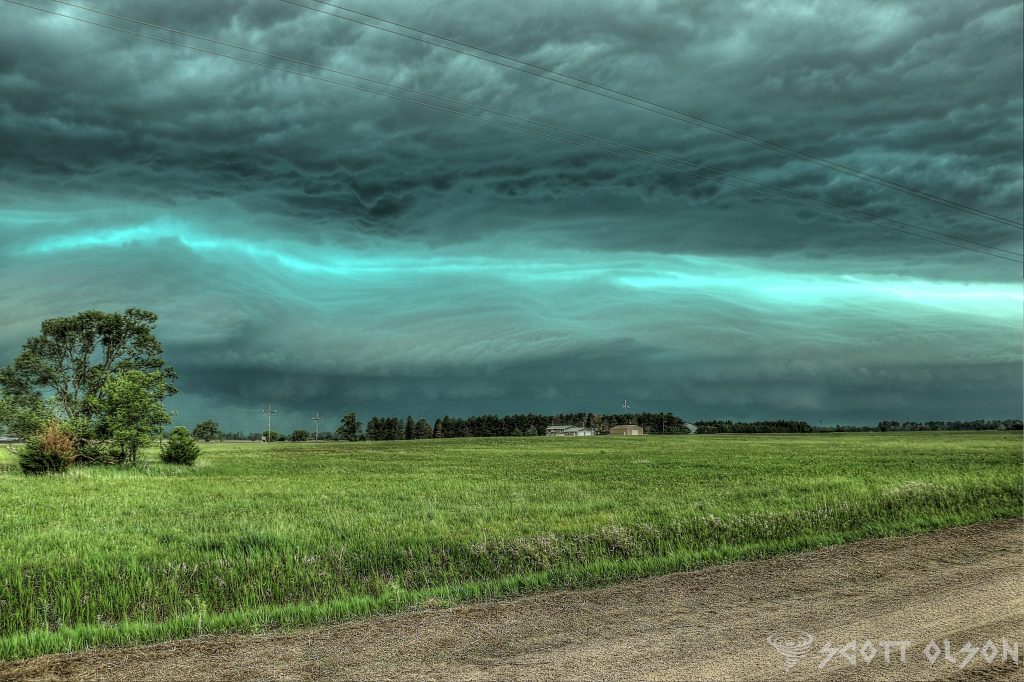
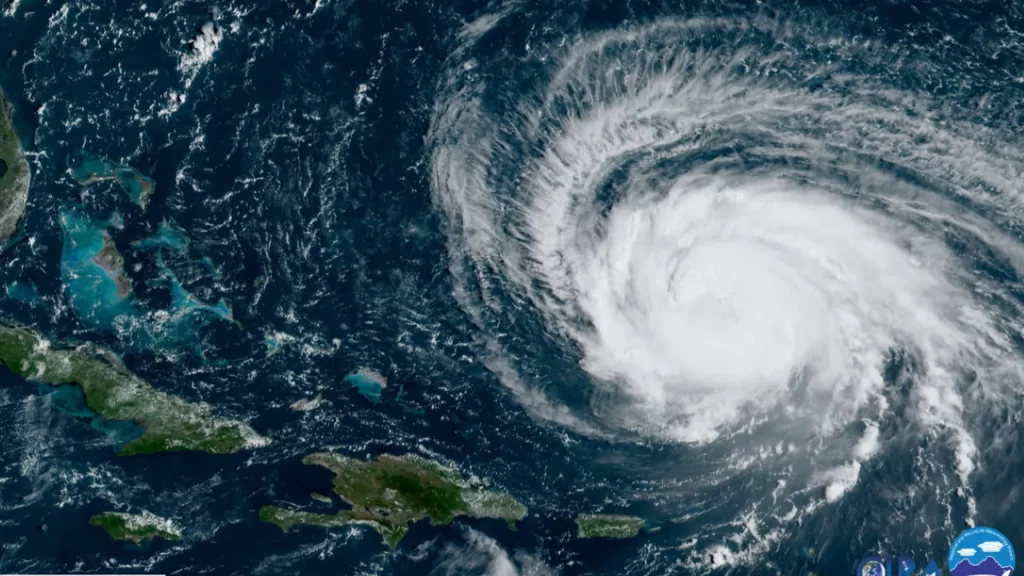
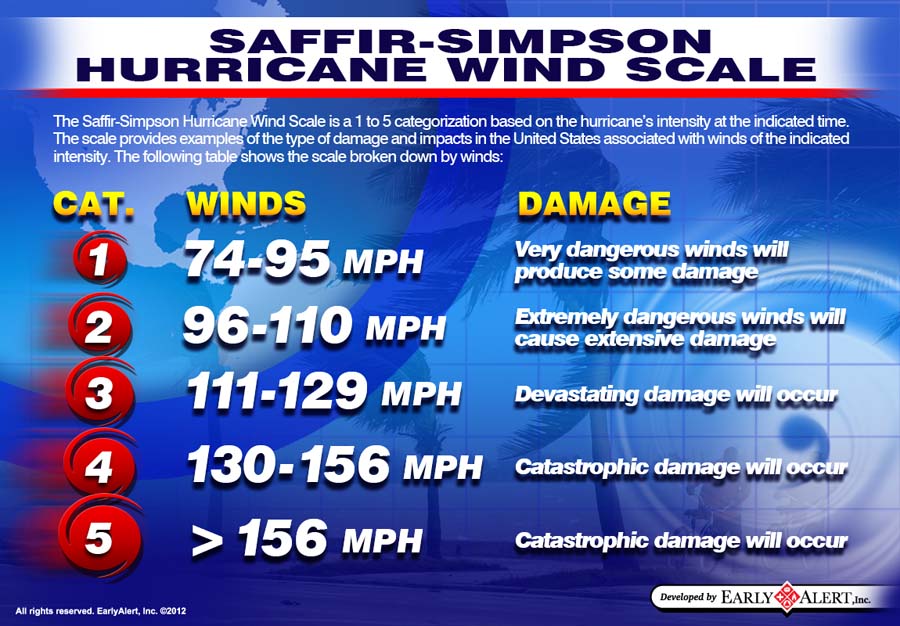
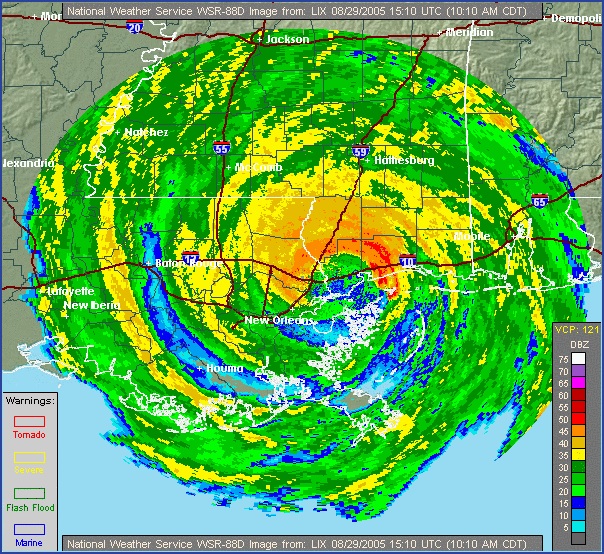
The Storm’s Fury: The hurricane that struck Galveston that fateful September day was a monster by any measure. It packed winds of up to 145 mph (233 km/h) and generated a storm surge of over 15 feet (4.6 meters) that inundated the island. The city, which had an average elevation of just 5 feet (1.5 meters) above sea level, was no match for the storm’s fury.

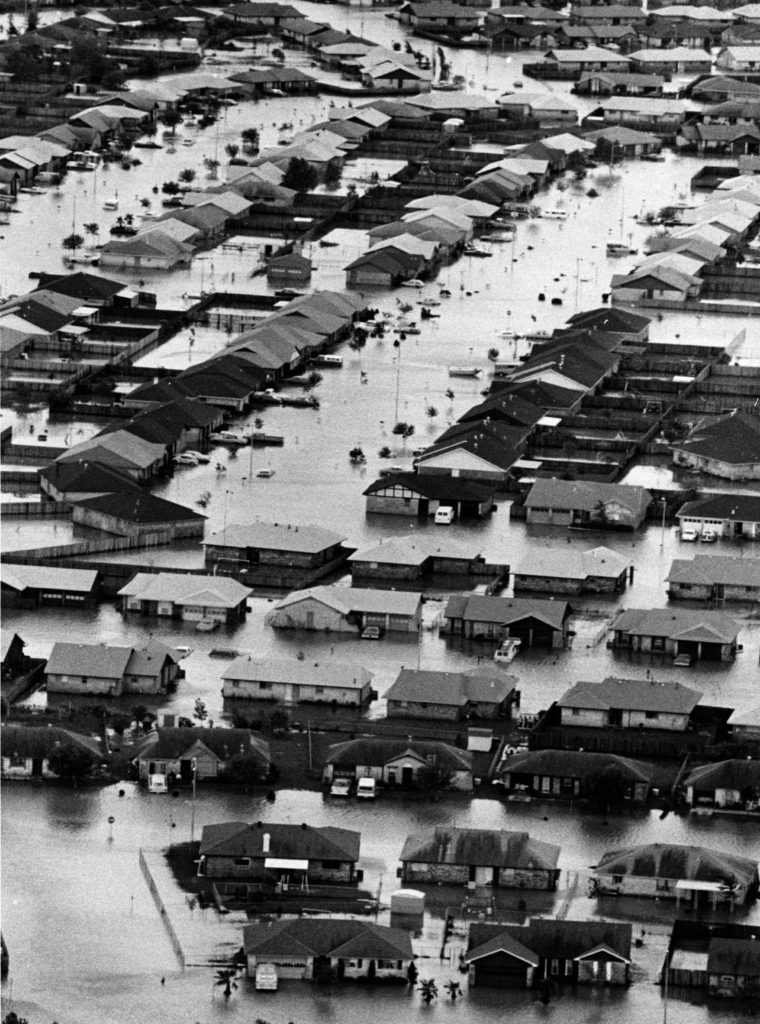
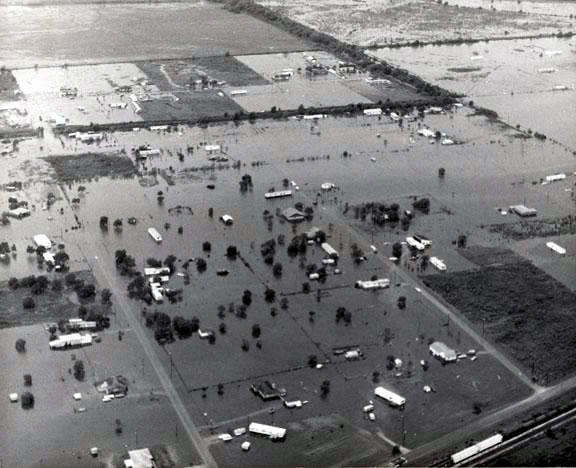
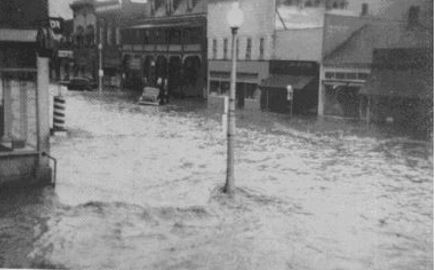
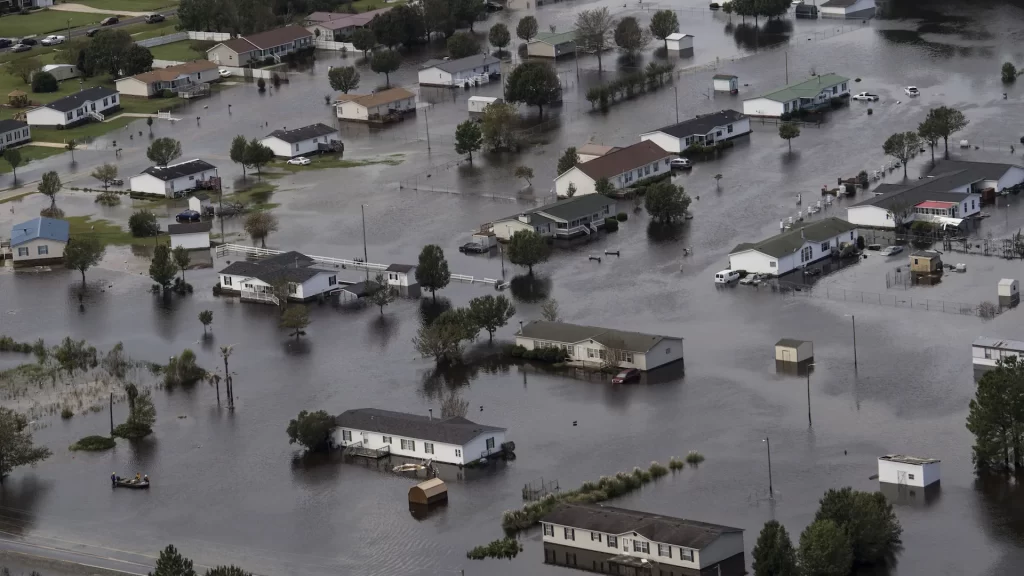
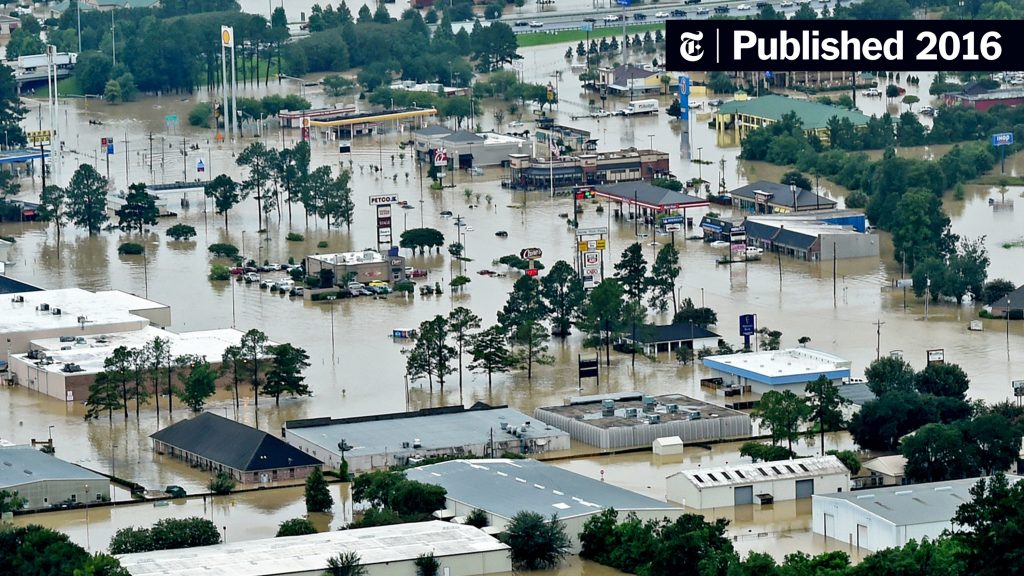
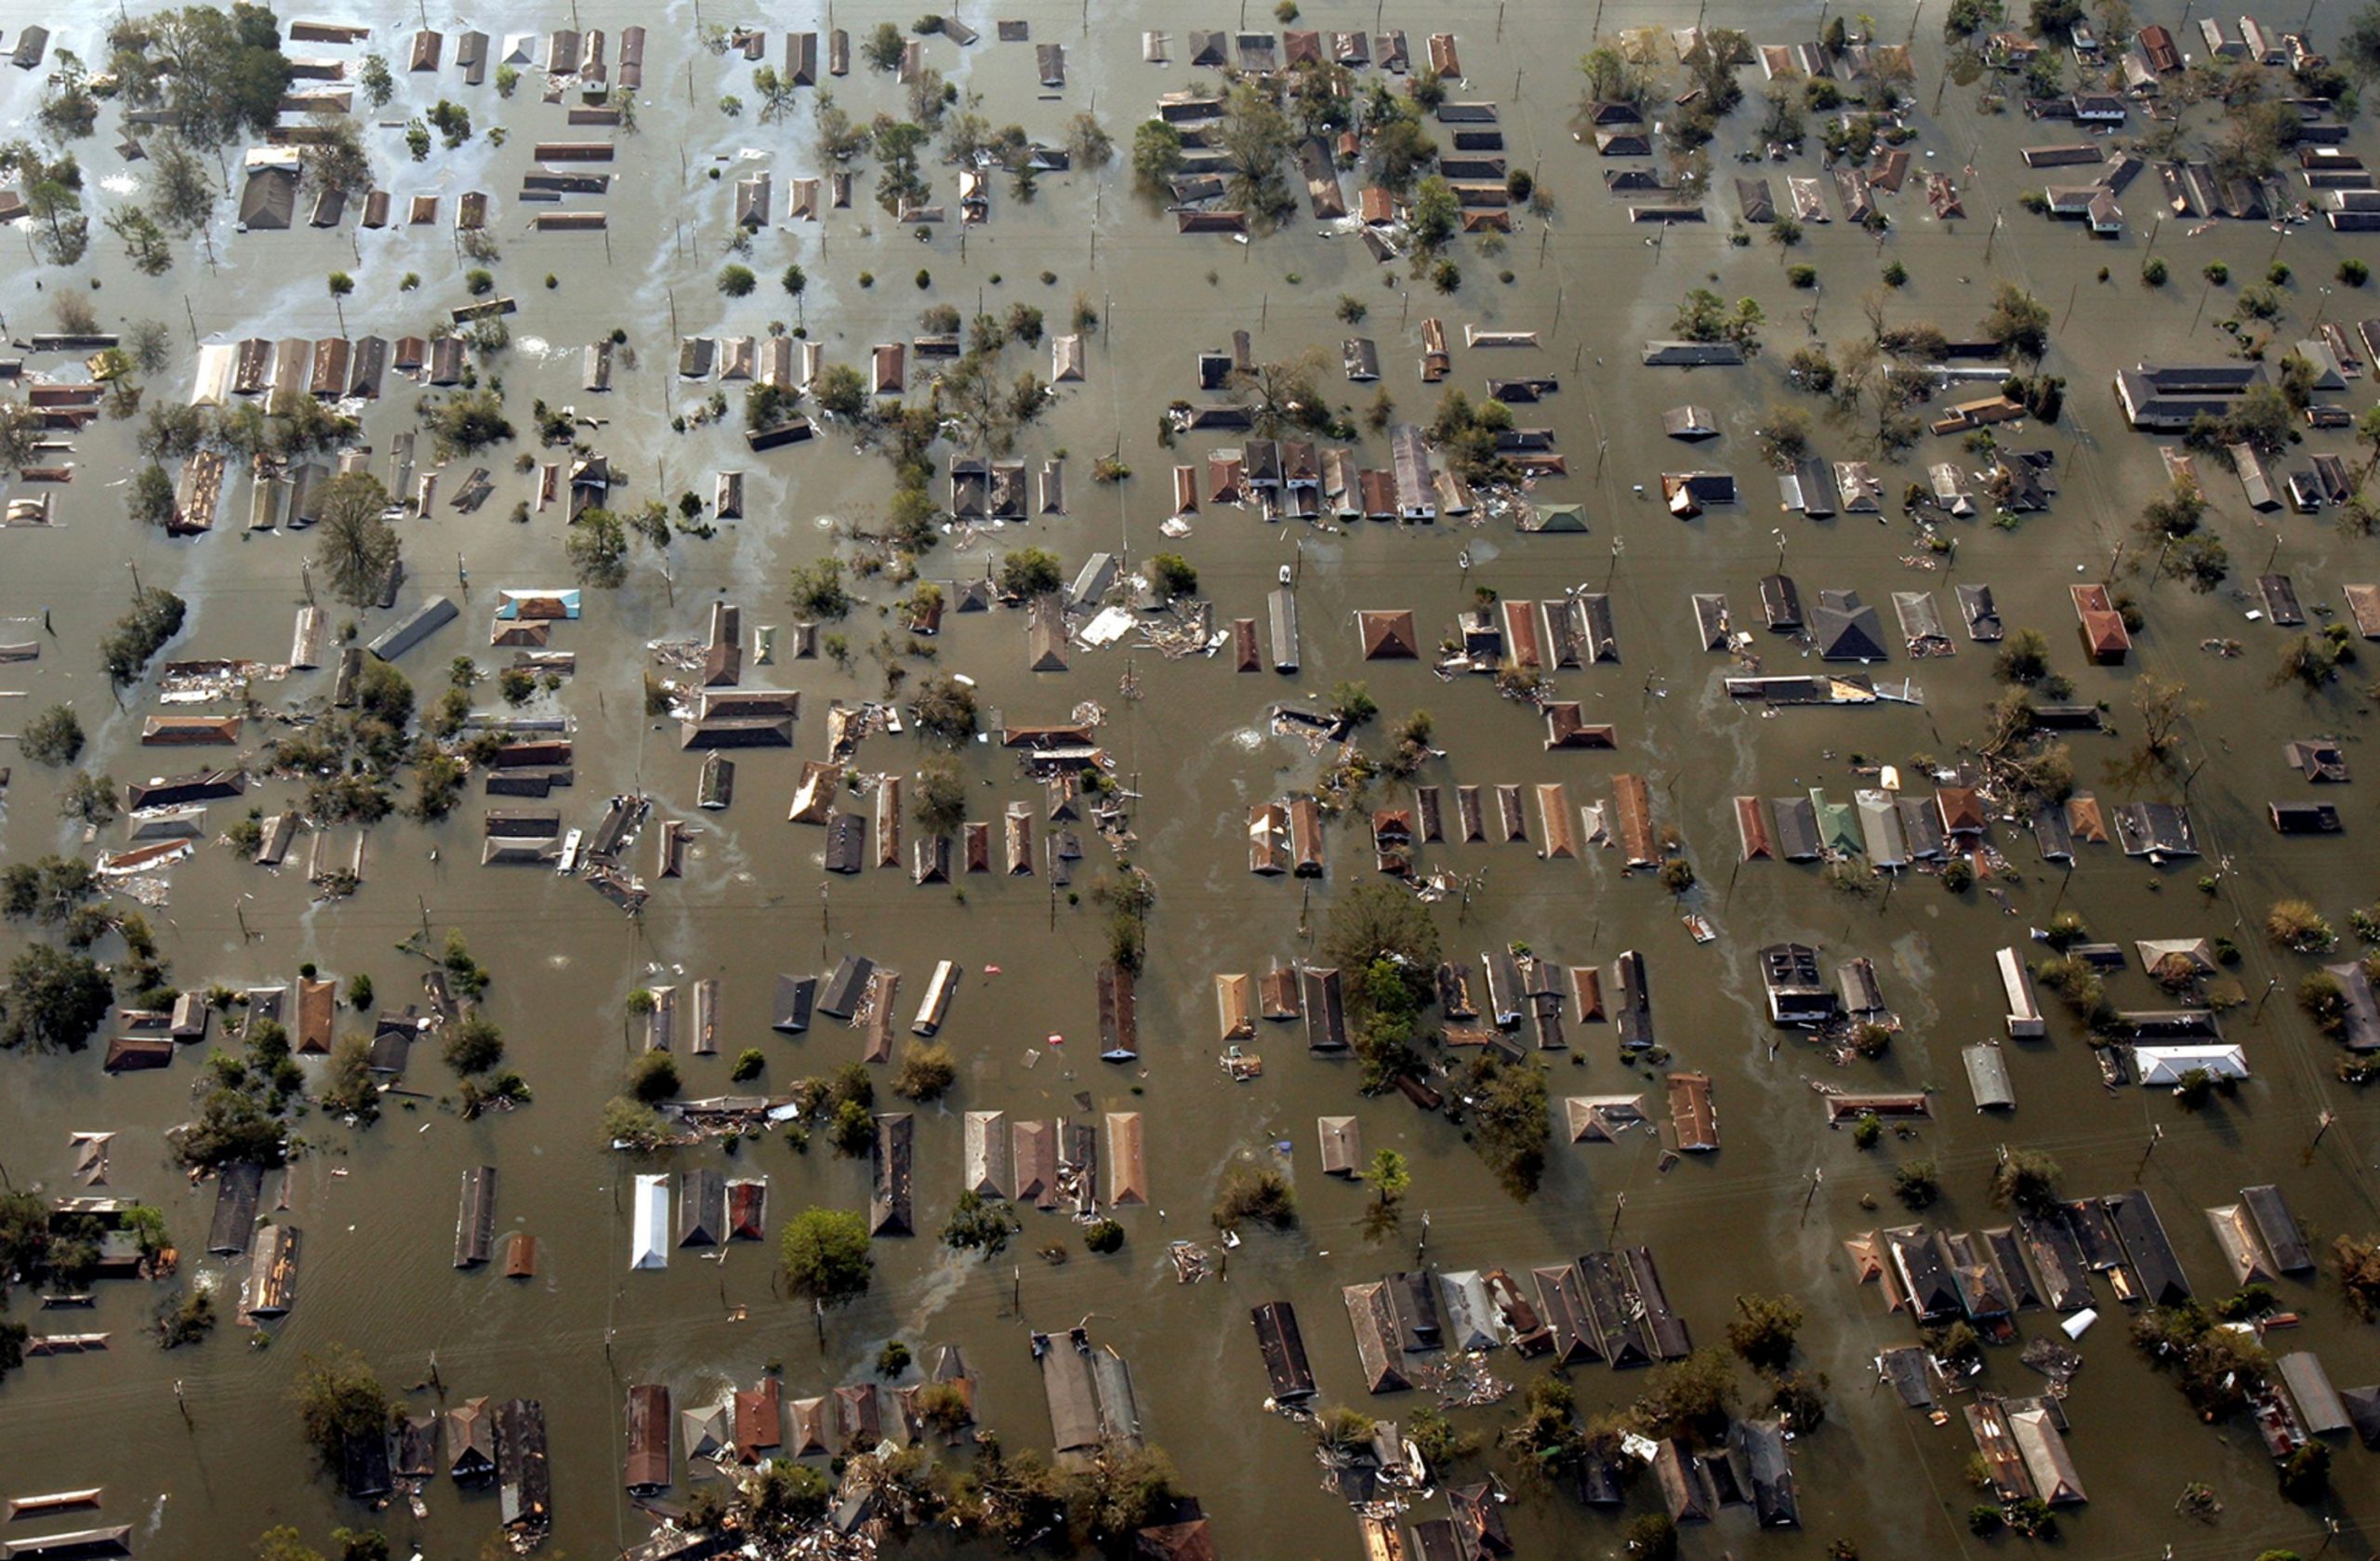
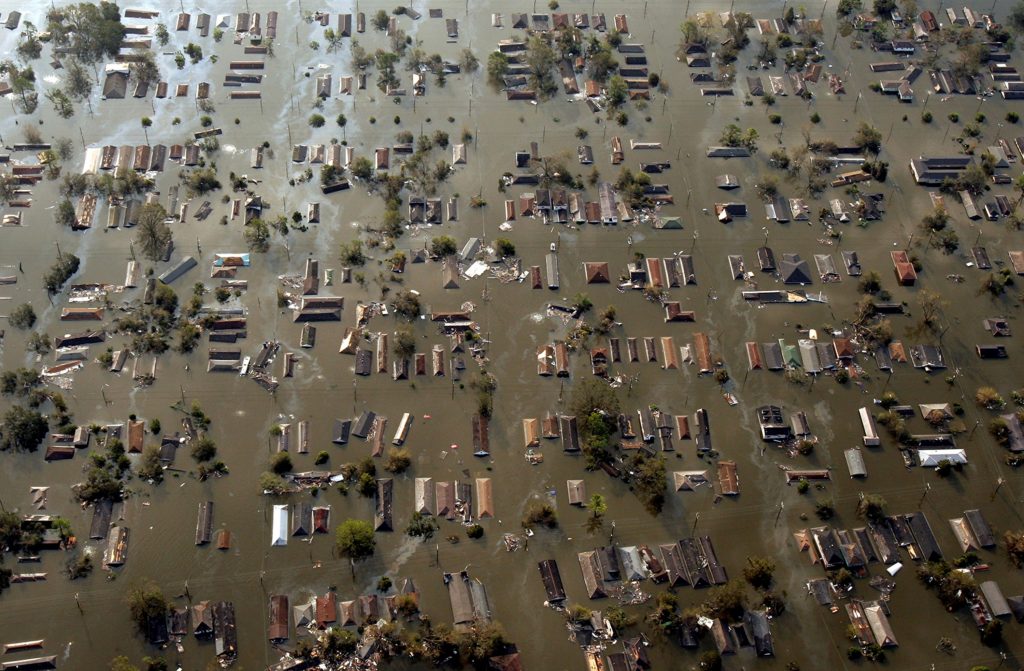
As the hurricane made landfall, it unleashed a cascade of destruction. Wind-driven debris turned into deadly projectiles, while the storm surge swept away entire neighborhoods. The city’s famed beachfront pavilions and bathhouses were reduced to kindling. The grand mansions of the wealthy were not spared, with many collapsing under the onslaught of wind and water.

The human toll was staggering. An estimated 6,000 to 12,000 people lost their lives, making it the deadliest natural disaster in U.S. history. The majority of the victims were residents of the city’s low-lying areas, many of whom were African American and working-class. Their bodies were found scattered across the island, tangled in debris or washed out to sea.

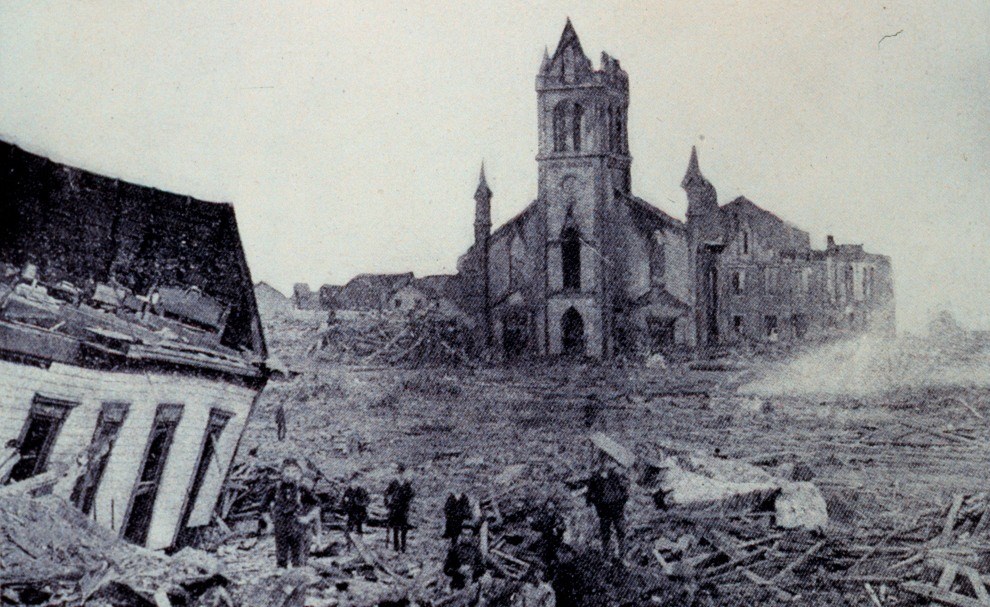
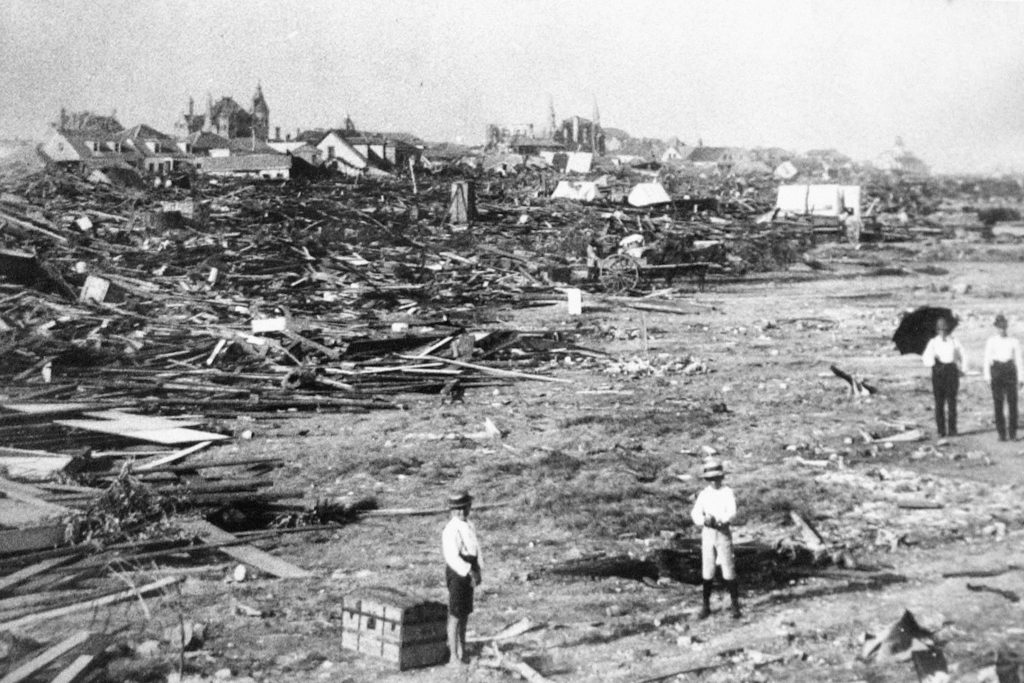
The Aftermath: In the wake of the hurricane, Galveston was a city in ruins. An estimated 3,600 homes were destroyed, and many more were damaged beyond repair. The city’s infrastructure, including its water and sewer systems, was crippled. The once-thriving port was choked with debris and sunken ships.

The scale of the disaster was hard to fathom, even for those who had lived through it. Clara Barton, the founder of the American Red Cross, arrived in Galveston shortly after the storm and described the scene as “one of the most horrifying sights that ever met my eyes.”

Despite the devastation, the people of Galveston proved resilient. Almost immediately, they began the daunting task of rebuilding their city. Volunteers from across the country poured in to help with the recovery effort, and donations of money and supplies arrived from as far away as Europe and Australia.

However, it soon became clear that rebuilding alone would not be enough to protect Galveston from future storms. The city’s leaders knew that they needed to take drastic measures to ensure the island’s long-term survival.

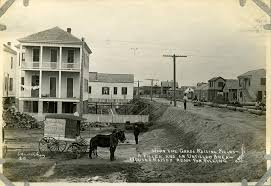
The Raising of Galveston: One of the most ambitious and innovative responses to the 1900 hurricane was the decision to literally raise the city of Galveston. Engineers proposed a plan to lift the entire grade of the city by several feet, using a combination of dredged sand and a network of seawalls and retaining walls.

The scale of the project was unprecedented. Over the course of several years, more than 2,000 buildings were jacked up on stilts while sand was pumped underneath to raise the ground level. The process was painstaking and expensive, but it proved remarkably effective. By 1911, the grade of the city had been raised by as much as 17 feet (5.2 meters) in some areas.

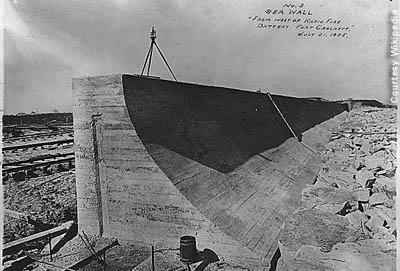
In addition to raising the city, Galveston also constructed a massive seawall along its beachfront. The 17-foot-tall (5.2-meter) structure, which stretched for over 10 miles (16 kilometers), was designed to protect the city from future storm surges. The seawall proved its worth in 1915, when another major hurricane struck the island. While the storm caused significant damage, the loss of life was a fraction of what it had been in 1900.

A National Wake-Up Call: The Galveston Hurricane of 1900 was not just a local tragedy; it was a national wake-up call. The storm exposed the woeful inadequacy of the country’s weather forecasting and disaster preparedness systems. At the time, there was no national weather service, and the few weather stations that did exist were poorly equipped and understaffed.

The Galveston disaster spurred a major overhaul of the nation’s weather infrastructure. In 1901, Congress passed the Organic Act, which created the U.S. Weather Bureau (the predecessor to today’s National Weather Service). The new agency was tasked with improving weather forecasting and providing timely warnings of impending storms.

The lessons of Galveston also led to significant changes in building codes and land-use policies in coastal areas. Many cities began to adopt stricter building standards and zoning regulations to minimize the risk of storm damage. The use of reinforced concrete and steel became more widespread, as did the practice of elevating structures above potential flood levels.

A Turning Point for American Philanthropy: The Galveston Hurricane also marked a turning point in American philanthropy. The outpouring of support and donations in the aftermath of the storm was unprecedented, and it helped to establish the modern framework for disaster relief and charitable giving.

One of the most significant developments was the emergence of the American Red Cross as the nation’s premier disaster relief organization. Under the leadership of Clara Barton, the Red Cross played a crucial role in the Galveston recovery effort, providing food, shelter, and medical care to thousands of survivors.

The success of the Red Cross in Galveston helped to cement its reputation as a trusted and effective charity, and it paved the way for the organization’s expansion in the decades that followed. Today, the Red Cross remains one of the most recognizable and respected humanitarian organizations in the world.

Galveston’s Legacy: More than a century after the Great Galveston Hurricane, the legacy of the storm can still be felt across the United States. The changes and innovations that emerged in the wake of the disaster – from improved weather forecasting to stronger building codes to more effective disaster relief – have helped to make the nation more resilient in the face of natural hazards.

The 5 Greatest Floods in US History

Throughout the history of the United States, several devastating floods have occurred due to record-breaking 24-hour rainfall totals. These events have caused immense damage to infrastructure, homes, and tragically, human lives. In this article, we will explore the five most significant 24-hour rainfall events and the resulting floods in US history.

1.Alvin, Texas – July 25-26, 1979 On July 25 and 26, 1979, the small town of Alvin, Texas, experienced an astonishing 43 inches of rain within a 24-hour period, setting the record for the highest 24-hour rainfall total in US history. This unprecedented rainfall was caused by the remnants of Tropical Storm Claudette, which stalled over the area, unleashing a relentless deluge. The resulting flood inundated the town, causing widespread damage to homes, businesses, and infrastructure. The Chocolate Bayou, a typically tranquil stream, transformed into a raging torrent, sweeping away everything in its path. Miraculously, no lives were lost during this event, but the economic impact was substantial, with damages estimated at over $100 million (adjusted for inflation).

2. Tropical Storm Claudette, Texas – July 1979 In addition to the record-breaking rainfall in Alvin, Tropical Storm Claudette also caused severe flooding in other parts of Texas in July 1979. An area near Alvin recorded 42 inches of rain within a 24-hour period, making it the second-highest 24-hour rainfall total in US history. The storm’s slow movement and abundant moisture supply contributed to the extreme rainfall, which led to extensive flooding and damage throughout the affected regions.

3. Thrall, Texas – September 9-10, 1921 On September 9 and 10, 1921, the small town of Thrall, Texas, experienced a staggering 38.2 inches of rain within a 24-hour period. The intense rainfall was the result of a slow-moving tropical disturbance that had formed in the Gulf of Mexico. As the system moved inland, it unleashed torrential rains, causing the San Gabriel River and its tributaries to swell rapidly. The ensuing flood destroyed homes, farms, and bridges, leaving the town in ruins. The loss of life was significant, with at least 215 people perishing in the floodwaters. The Thrall flood remains one of the deadliest in Texas history.

4. Yankeetown, Florida – September 5-6, 1950 In early September 1950, the small fishing village of Yankeetown, Florida, bore the brunt of a powerful hurricane that had formed in the Gulf of Mexico. As the storm made landfall, it unleashed a staggering 38.7 inches of rain within a 24-hour period. The resulting flood inundated the low-lying areas of the town, destroying homes and businesses. The storm surge, combined with the heavy rainfall, caused the Withlacoochee River to rise rapidly, submerging vast swaths of land. Fortunately, due to the small population of Yankeetown, the loss of life was minimal, but the economic impact was significant, with damages estimated at over $50 million (adjusted for inflation).

5. Smethport, Pennsylvania – July 17-18, 1942 Moving to the northeastern United States, the small borough of Smethport, Pennsylvania, holds the record for the fifth-highest 24-hour rainfall total in US history. On July 17 and 18, 1942, an astounding 34.5 inches of rain fell upon the area, causing catastrophic flooding along the Allegheny River and its tributaries. The deluge was the result of a stationary front that had become situated over the region, drawing moisture from the Atlantic Ocean and producing relentless rainfall. The flood claimed the lives of 30 people and caused extensive damage to the town and surrounding areas. The event also triggered numerous landslides, further compounding the destruction.

In recent years, the United States has experienced several significant rainfall events that have led to devastating floods. These events serve as reminders that extreme weather can strike at any time, and communities must remain vigilant and prepared. In this article, we will examine some of the most notable 24-hour rainfall floods that have occurred in the US within the last decade.

1.Hurricane Harvey, Texas – August 2017 In August 2017, Hurricane Harvey made landfall in Texas, bringing with it an unprecedented amount of rainfall. The storm stalled over the Houston metropolitan area, dumping a staggering 60.58 inches of rain in Nederland, Texas, over a five-day period. The maximum 24-hour rainfall total recorded during the event was 25.6 inches in Pearland, Texas. The resulting floods inundated hundreds of thousands of homes, displaced over 30,000 people, and caused an estimated $125 billion in damages, making it one of the costliest natural disasters in US history.

2. Hurricane Lane, Hawaii – August 2018 In August 2018, Hurricane Lane brought record-breaking rainfall to the Hawaiian Islands. The storm’s slow movement and proximity to the islands resulted in prolonged periods of heavy rainfall. The 24-hour rainfall total reached 31.85 inches at Mountain View on the Big Island, setting a new record for the state. The excessive rainfall caused severe flooding, landslides, and road closures across the islands, with damages estimated at over $250 million.

3. Tropical Storm Imelda, Texas – September 2019 Tropical Storm Imelda made landfall in Texas in September 2019, bringing torrential rainfall to the region. The storm’s slow movement allowed for the accumulation of extreme rainfall totals, with some areas receiving over 40 inches of rain. The maximum 24-hour rainfall total recorded during the event was 21.51 inches near Sargent, Texas. The resulting floods caused widespread damage to homes, businesses, and infrastructure, with estimated damages exceeding $5 billion.

4. Hurricane Florence, North Carolina – September 2018 In September 2018, Hurricane Florence made landfall in North Carolina, bringing with it record-breaking rainfall. The storm’s slow movement and prolonged impact resulted in rainfall totals exceeding 30 inches in some areas. The maximum 24-hour rainfall total recorded during the event was 23.63 inches in Elizabethtown, North Carolina. The floods caused by Hurricane Florence led to widespread damage, with over 50 deaths and an estimated $24 billion in damages.

5. Louisiana Floods – August 2016 In August 2016, a slow-moving low-pressure system brought heavy rainfall to southern Louisiana, resulting in catastrophic flooding. The maximum 24-hour rainfall total recorded during the event was 21.86 inches in Watson, Louisiana. The floods affected over 100,000 homes, displaced thousands of residents, and caused an estimated $10-15 billion in damages.

Unraveling the Mystery: Why Severe Storms Have Green, Teal, and Blue Colors

Supercell thunderstorms are among the most awe-inspiring and powerful weather phenomena on Earth. These storms are characterized by their rotating updrafts, known as mesocyclones, which can produce severe weather conditions such as large hail, damaging winds, and even tornadoes. One of the most striking features of supercells is the occasional appearance of a green or teal color in the sky, particularly near the storm’s base. This unique coloration has fascinated both weather enthusiasts and scientists alike, prompting numerous studies to unravel the mystery behind this phenomenon.

The presence of these large water droplets is crucial to the formation of the green or teal color. Water droplets are particularly effective at absorbing red light, which is at the longer wavelength end of the visible spectrum. As sunlight enters the storm and interacts with these water droplets, a significant portion of the red light is absorbed, leaving the remaining light dominated by shorter wavelengths, which correspond to blue and green colors.

However, the absorption of red light by water droplets alone is not sufficient to explain the intense green or teal hue sometimes observed. Another critical factor is the presence of ice crystals in the upper portions of the storm, particularly in the updraft and the rear flank downdraft (RFD). The RFD is another area of descending air, located on the back side of the storm, often associated with strong winds and large hail.

Ice crystals in the upper portions of the storm can scatter the remaining blue light, further enhancing the green appearance. The combination of red light absorption by water droplets in the lower levels and blue light scattering by ice crystals in the upper levels creates the distinctive green or teal color.

The green coloration is most likely to be observed when the sun is at a low angle on the horizon, typically during the late afternoon or early evening. During this time, sunlight has to travel through more of the Earth’s atmosphere, which can further filter out red light and enhance the green appearance. Additionally, the presence of large amounts of hail in the storm can intensify the green color, as hail can also absorb and scatter light in a manner similar to water droplets and ice crystals. Most storm chasers have experienced the largest hail when storms take on green and teal colors.

It is important to note that not all supercells exhibit a green or teal color, and the absence of this coloration does not necessarily indicate a less severe storm. The appearance of the green hue depends on a delicate balance of factors, including the storm’s structure, the concentration and size of hydrometeors, and the angle of the sun.

While the green or teal color in supercells is a fascinating phenomenon, it is important to remember that it is often associated with the most severe and dangerous storms. Supercells that exhibit this coloration are likely to be producing large hail, damaging winds, and possibly even tornadoes. If you find yourself in the vicinity of a supercell with a green or teal hue, it is crucial to seek shelter immediately and follow the advice of local weather authorities.

The Future of Weather Forecasting: How AI is Revolutionizing Meteorology

One of the key ways AI is being used in weather forecasting is through machine learning algorithms. These algorithms can analyze vast amounts of historical weather data, including temperature, humidity, wind speed, and precipitation, to identify patterns and make predictions about future weather events. By continuously learning from new data, these algorithms can improve their accuracy over time, leading to more reliable forecasts.

Another area where AI is making a significant impact is in the interpretation of weather satellite imagery. Traditional methods of analyzing satellite data can be time-consuming and prone to human error. However, AI-powered systems can quickly and accurately identify weather patterns and anomalies in satellite images, providing meteorologists with valuable insights into developing weather systems.

AI is also being used to improve the resolution and accuracy of weather models. By incorporating machine learning techniques, researchers can create more detailed and precise models that can simulate weather conditions down to the neighborhood level. This level of granularity can be particularly useful for predicting the impact of severe weather events, such as hurricanes and tornadoes, on specific communities.

In addition to improving the accuracy of weather forecasts, AI is also helping to make them more accessible and user-friendly. Many weather apps and websites now use AI-powered chatbots and virtual assistants to provide personalized weather information and alerts based on a user’s location and preferences. This can help individuals and businesses make more informed decisions about their daily activities and operations.

Title: The Future Potential of AI in Weather Forecasting: Building on Google’s GraphCast

Google’s GraphCast represents a significant advancement in the field of weather forecasting, utilizing artificial intelligence (AI) and Graph Neural Networks (GNNs) to deliver highly accurate 10-day weather predictions in a fraction of the time required by traditional methods. This groundbreaking technology not only improves the accuracy and efficiency of weather forecasts but also demonstrates the potential for AI to revolutionize the field of meteorology.

One of the most promising aspects of GraphCast is its ability to identify and predict extreme weather events, such as cyclones, atmospheric rivers, and heat waves, with greater accuracy and lead time than traditional forecasting models. This early warning capability could prove invaluable in saving lives and minimizing the impact of severe weather on communities. As AI continues to advance, it is likely that models like GraphCast will become even more adept at detecting and predicting these extreme events, allowing for better preparedness and response.

Looking to the future, the potential applications of AI in weather forecasting are vast. By building upon the foundation laid by GraphCast, researchers and meteorologists could develop even more sophisticated models that incorporate additional data sources, such as satellite imagery, radar, and weather station observations. These enhanced models could provide even greater accuracy and granularity in weather predictions, allowing for more localized and personalized forecasts. Additionally, AI could be used to develop long-term climate models, helping scientists better understand and predict the impacts of climate change on weather patterns and extreme events. As the world continues to grapple with the challenges posed by a changing climate, the insights provided by AI-powered weather and climate models will become increasingly critical in informing policy decisions and guiding adaptation and mitigation efforts.

Despite the many benefits of AI in weather forecasting, there are also some challenges and limitations to consider. One concern is the potential for AI systems to perpetuate biases or errors in historical weather data, leading to inaccurate predictions. Another challenge is the need for large amounts of high-quality data to train and validate AI models, which can be difficult and expensive to obtain.

Despite these challenges, the future of weather forecasting looks bright thanks to the continued advancement of AI technologies. As more data becomes available and AI algorithms become more sophisticated, we can expect to see even more accurate and detailed weather forecasts in the years to come. This will not only help us better prepare for and respond to severe weather events but also enable us to make more informed decisions about everything from agriculture to transportation to energy production.

How Hurricanes Form: The Genesis of a Cyclone

The birth of a hurricane is a fascinating process, often starting from inconspicuous beginnings that evolve into powerful storms capable of wreaking havoc. Let’s delve into the early stages of hurricane development, where seemingly innocuous atmospheric disturbances transform into organized systems with the potential for destruction.

Tropical Wave: The Seed of a Storm

The journey often begins with a tropical wave, an elongated area of low pressure that originates over the warm waters of the tropics, often off the west coast of Africa. These waves, propelled by easterly trade winds, travel westward across the Atlantic Ocean, carrying showers and thunderstorms within their midst. While most tropical waves dissipate harmlessly, some possess the ingredients necessary to evolve into something more ominous.

  • Warm Ocean Waters: Hurricanes draw their energy from warm ocean waters, typically with surface temperatures of at least 80°F (26.5°C). This heat provides the fuel for the storm’s development and intensification.
  • Coriolis Effect: The Earth’s rotation creates a force known as the Coriolis effect, which causes winds to deflect to the right in the Northern Hemisphere and to the left in the Southern Hemisphere. This deflection plays a crucial role in the cyclonic rotation of hurricanes.
  • Low Vertical Wind Shear: Vertical wind shear refers to the change in wind speed and direction with height. Low wind shear allows the storm to develop and maintain its vertical structure, while high wind shear can disrupt the storm’s organization.
  • Pre-existing Disturbance: A pre-existing weather disturbance, such as a tropical wave or a cluster of thunderstorms, provides the initial seed for hurricane formation.

Evolution from Disturbance to Depression:

If a tropical wave encounters these favorable conditions, it can begin to organize and intensify. As thunderstorms cluster around the area of low pressure, a tropical disturbance forms. If the circulation becomes more defined and wind speeds reach up to 38 mph (62 kph), it is classified as a tropical depression.

The Critical Transition to Tropical Storm:

The transition from a tropical depression to a tropical storm marks a significant step in the storm’s development. As the wind speeds increase to 39-73 mph (63-118 kph), the storm becomes more organized and develops a distinct cyclonic circulation. At this stage, it receives a name and is officially recognized as a tropical storm, posing a potential threat to land areas within its path.

Stages of Hurricane Development:

  1. Tropical Disturbance: A cluster of thunderstorms with a weak circulation forms over warm ocean waters.
  2. Tropical Depression: The circulation becomes more organized, and wind speeds reach up to 38 mph (62 kph).
  3. Tropical Storm: Wind speeds increase to 39-73 mph (63-118 kph), and the storm receives a name.
  4. Hurricane: Wind speeds reach 74 mph (119 kph) or higher, and the storm exhibits a well-defined eye surrounded by a ring of intense thunderstorms known as the eyewall.

Eye and Eyewall Dynamics:

The eye of the hurricane is a relatively calm area of low pressure surrounded by the eyewall, the region of highest winds and heaviest rainfall. Air rises rapidly in the eyewall, releasing latent heat and fueling the storm’s intensity. The eye forms as a result of the balance between the inward-flowing air and the upward-rising air in the eyewall.

Factors Influencing Intensity:

Several factors influence hurricane intensity, including:

  • Sea surface temperatures: Warmer waters provide more energy for the storm to intensify.
  • Ocean heat content: The depth of warm water also plays a role, as deeper warm layers provide more sustained energy for the hurricane.
  • Atmospheric moisture: Higher moisture content in the atmosphere can fuel stronger thunderstorms and contribute to intensification.
  • Upper-level atmospheric conditions: Favorable upper-level winds can help vent the storm and promote further intensification.

Understanding Hurricane Categories and Associated Damage

Hurricane categories, based on the Saffir-Simpson Hurricane Wind Scale, classify these storms based on their maximum sustained wind speeds and the potential damage they can inflict. This scale helps communicate the severity of a hurricane and guide preparedness efforts.

Category 1 (74-95 mph):

  • Damage: Primarily to trees and foliage, with some damage to roofs, siding, and unanchored mobile homes. Power outages are likely.
  • Historical Examples: Hurricane Gaston (2004), Hurricane Humberto (2019)

Category 2 (96-110 mph):

  • Damage: Extensive damage to trees and foliage, with significant damage to roofs, siding, and mobile homes. Power outages can last for days or weeks.
  • Historical Examples: Hurricane Frances (2004), Hurricane Zeta (2020)

Category 3 (111-129 mph):

  • Damage: Devastating damage to trees and foliage, with major damage to roofs, siding, and mobile homes. Structural damage to small buildings is possible. Power and water outages can last for extended periods.
  • Historical Examples: Hurricane Katrina (2005), Hurricane Irma (2017)

Category 4 (130-156 mph):

  • Damage: Catastrophic damage to trees and foliage, with severe damage to well-built homes. Roofs can be completely torn off, and exterior walls can collapse. Power outages can last for weeks or even months. Extensive coastal flooding and inland flooding are expected.
  • Historical Examples: Hurricane Harvey (2017), Hurricane Maria (2017)

Category 5 (157 mph or higher):

  • Damage: The most catastrophic damage, with complete roof failure and wall collapse on many residential and industrial buildings. Most trees will be snapped or uprooted. Power outages can last for months, and areas may be uninhabitable for extended periods.
  • Historical Examples: Hurricane Andrew (1992), Hurricane Michael (2018)

Hurricane Katrina: The Destruction of New Orleans

The date August 29, 2005, remains etched in the annals of American history, a day when Hurricane Katrina, a tempest of unimaginable fury, unleashed its wrath upon the Gulf Coast. New Orleans, a city celebrated for its vibrant culture, rich history, and unique spirit, found itself at the epicenter of the disaster. As Katrina’s winds howled and storm surge swelled, the city’s levee system, a supposed bulwark against the encroaching waters, failed catastrophically.

Meteorological Timeline:

  • August 23, 2005: A tropical depression forms over the Bahamas, later strengthening into Tropical Storm Katrina.
  • August 25, 2005: Katrina intensifies into a Category 1 hurricane and makes landfall in southern Florida, causing flooding and wind damage.
  • August 26-27, 2005: Katrina emerges into the Gulf of Mexico and undergoes rapid intensification, reaching Category 5 strength with sustained winds of 160 mph.
  • August 28, 2005: Katrina weakens slightly to a Category 3 hurricane but remains a formidable storm as it approaches the Gulf Coast.

Landfall and Immediate Aftermath:

  • August 29, 2005: Hurricane Katrina makes landfall near Buras-Triumph, Louisiana, as a Category 3 hurricane with sustained winds of 125 mph. The storm surge, exceeding 20 feet in some areas, breaches levees in New Orleans, leading to catastrophic flooding.
  • August 29-30, 2005: Floodwaters inundate New Orleans, submerging entire neighborhoods and stranding residents. The Superdome, serving as a shelter, becomes overcrowded and conditions deteriorate. Rescue efforts begin, but the scale of the disaster overwhelms response capabilities.

Unfolding Disaster and Response Efforts:

  • August 31 – September 4, 2005: The magnitude of the disaster becomes increasingly apparent as floodwaters remain stagnant and rescue efforts continue. The Lower Ninth Ward and other low-lying areas of New Orleans remain submerged, with residents trapped and desperate for help. Criticism mounts over the slow and inadequate response from federal, state, and local authorities.
  • September 5-10, 2005: Floodwaters begin to recede slowly, revealing the extent of the devastation. Search and rescue efforts transition to recovery operations, as debris removal and damage assessments begin. The death toll rises, and the displacement of hundreds of thousands of residents creates a humanitarian crisis.

The consequences were immediate and devastating. Floodwaters surged through breaches in the levees, transforming streets into raging rivers and submerging entire neighborhoods. The iconic French Quarter, with its historic architecture and lively atmosphere, became an island amidst a sea of brown, polluted water. The Superdome, a massive stadium that had served as a shelter of last resort for thousands of evacuees, became a symbol of the city’s plight, its roof peeled back and its interior conditions deteriorating rapidly.

Across the city, tales of survival and heartbreak unfolded. Residents trapped in attics and on rooftops awaited rescue, desperate for any sign of help. Families were separated, loved ones lost, and homes destroyed. The Lower Ninth Ward, a predominantly African American neighborhood, suffered some of the worst flooding, its residents left stranded and forgotten for days. The stories that emerged from Katrina’s aftermath were a testament to the human spirit’s resilience in the face of unimaginable adversity.

Katrina’s impact extended far beyond New Orleans. Coastal communities across Mississippi, Alabama, and the Florida Panhandle were battered by the storm’s fury. In Biloxi, Mississippi, a once-thriving tourist destination, the storm surge swept away homes, businesses, and casinos, leaving behind a desolate landscape of debris and destruction. Gulfport, Mississippi, another coastal city, faced similar devastation, its harbor and waterfront areas obliterated by the storm’s power.

As Katrina moved inland, it weakened but continued to unleash torrential rains, leading to widespread flooding across the Southeast. Rivers and streams overflowed their banks, inundating homes and businesses and displacing thousands. The storm’s impact on infrastructure was equally devastating, with power outages affecting millions and transportation networks crippled. The economic toll of Katrina was staggering, estimated at over $100 billion, making it one of the costliest natural disasters in U.S. history.

The meteorological factors that contributed to Katrina’s formation and intensification were a perfect storm of conditions. Warm waters in the Gulf of Mexico provided ample fuel for the storm’s growth, while low wind shear allowed it to maintain its structure and strengthen rapidly. A high-pressure system over the southeastern United States steered Katrina on a direct path towards the Gulf Coast, giving residents little time to prepare for the impending disaster.

Katrina’s legacy is complex and multifaceted. The storm exposed deep-seated social and economic inequalities, as marginalized communities disproportionately bore the brunt of the disaster. The failure of the levee system in New Orleans raised questions about infrastructure investment and disaster preparedness, prompting a national conversation about the nation’s vulnerability to extreme weather events. The storm’s aftermath was marked by a slow and often chaotic response, leading to criticism of government agencies at all levels and calls for reform.

Hurricane Katrina serves as a stark reminder of the destructive power of nature and the importance of preparedness, infrastructure investment, and social equity in mitigating the impact of such catastrophic events. The storm’s legacy continues to shape policy and planning, as communities strive to build resilience and ensure that the lessons learned from Katrina are not forgotten. The stories of survival, loss, and community spirit that emerged from the storm’s aftermath continue to inspire and remind us of the indomitable human spirit in the face of adversity.

Predict Now – The Ultimate Weather Forecasting App for Enthusiasts

As the creator of Predict Now, I wanted an app that fit the needs of meteorologists, storm chasers, and weather enthusiasts who are passionate about forecasting severe weather. Predict Now is the result of thousands of hours of research, development, and conversations with people who forecast weather.

One of the standout features of Predict Now is its detailed radar maps. I have ensured that the app provides a comprehensive view of radar activity across the entire United States, enabling users to easily track storms and precipitation. Whether you’re monitoring a local thunderstorm or following the path of a hurricane, Predict Now’s radar maps will keep you informed and ahead of the game with updates every 2 minutes.

In addition to radar, I have incorporated a powerful front tracking feature in Predict Now. This allows users to visualize the movement of warm fronts, cold fronts, and other weather systems, providing valuable insights into upcoming changes in the weather pattern. By staying informed about frontal movements, users can make more accurate predictions and better prepare for potential severe weather events.

I am particularly proud of the integration of the Storm Prediction Center’s mesoanalysis tool in Predict Now. This feature grants users access to a wealth of data and visualizations, offering insights into current weather conditions and severe weather potential. Users can explore various indices like CAPE, wind shear, and more, empowering them to make well-informed forecasts and assess the likelihood of severe weather outbreaks.

Predict Now also includes a comprehensive surface observations feature, displaying detailed METARs from numerous locations across different regions, including the infamous Tornado Alley. This allows users to access real-time weather updates and monitor conditions on the ground, which is crucial for storm chasers and those in areas prone to severe weather. There are thousands of surface observations available in Predict Now.

To provide users with the most advanced satellite imagery available, I have integrated data from the cutting-edge GOES-16 satellite into Predict Now. This offers high-resolution visuals of water vapor, infrared, and visible satellite data, giving users a comprehensive understanding of atmospheric conditions. The GOES-16 imagery is a game-changer for weather enthusiasts, enabling them to analyze and predict weather patterns with unprecedented accuracy.

Predict Now also leverages the power of the High-Resolution Rapid Refresh (HRRR) model, which is particularly useful for tracking rapidly changing weather events. The HRRR provides short-term, high-resolution forecasts, allowing users to stay on top of evolving weather situations. Additionally, the app includes other weather models like the NAM and NSSL WRF, offering users a variety of forecasting perspectives to enhance their understanding and prediction capabilities.

I have designed Predict Now with the specific goal of aiding individuals interested in monitoring and preparing for severe weather events like tornadoes, hailstorms, hurricanes and flash floods. The app’s high-resolution data, sourced from advanced models and satellite imagery, ensures accurate and detailed weather visualization. Moreover, Predict Now is optimized for iPhone, providing a smooth and efficient user experience while minimizing data usage.

With its wide coverage spanning the United States and Southern Canada, Predict Now caters to a large user base, making it the go-to app for weather enthusiasts across the region.

I am confident that Predict Now will revolutionize the way you track, analyze, and forecast severe weather. Whether you’re a seasoned meteorologist, a passionate storm chaser, or simply someone who wants to stay informed about the weather, Predict Now is the ultimate tool to elevate your forecasting skills.

Download Predict Now today and join the community of weather enthusiasts who rely on this powerful app to stay one step ahead of the storm. I am committed to continuously improving and updating Predict Now based on user feedback, ensuring that it remains the leading choice for severe weather forecasting.