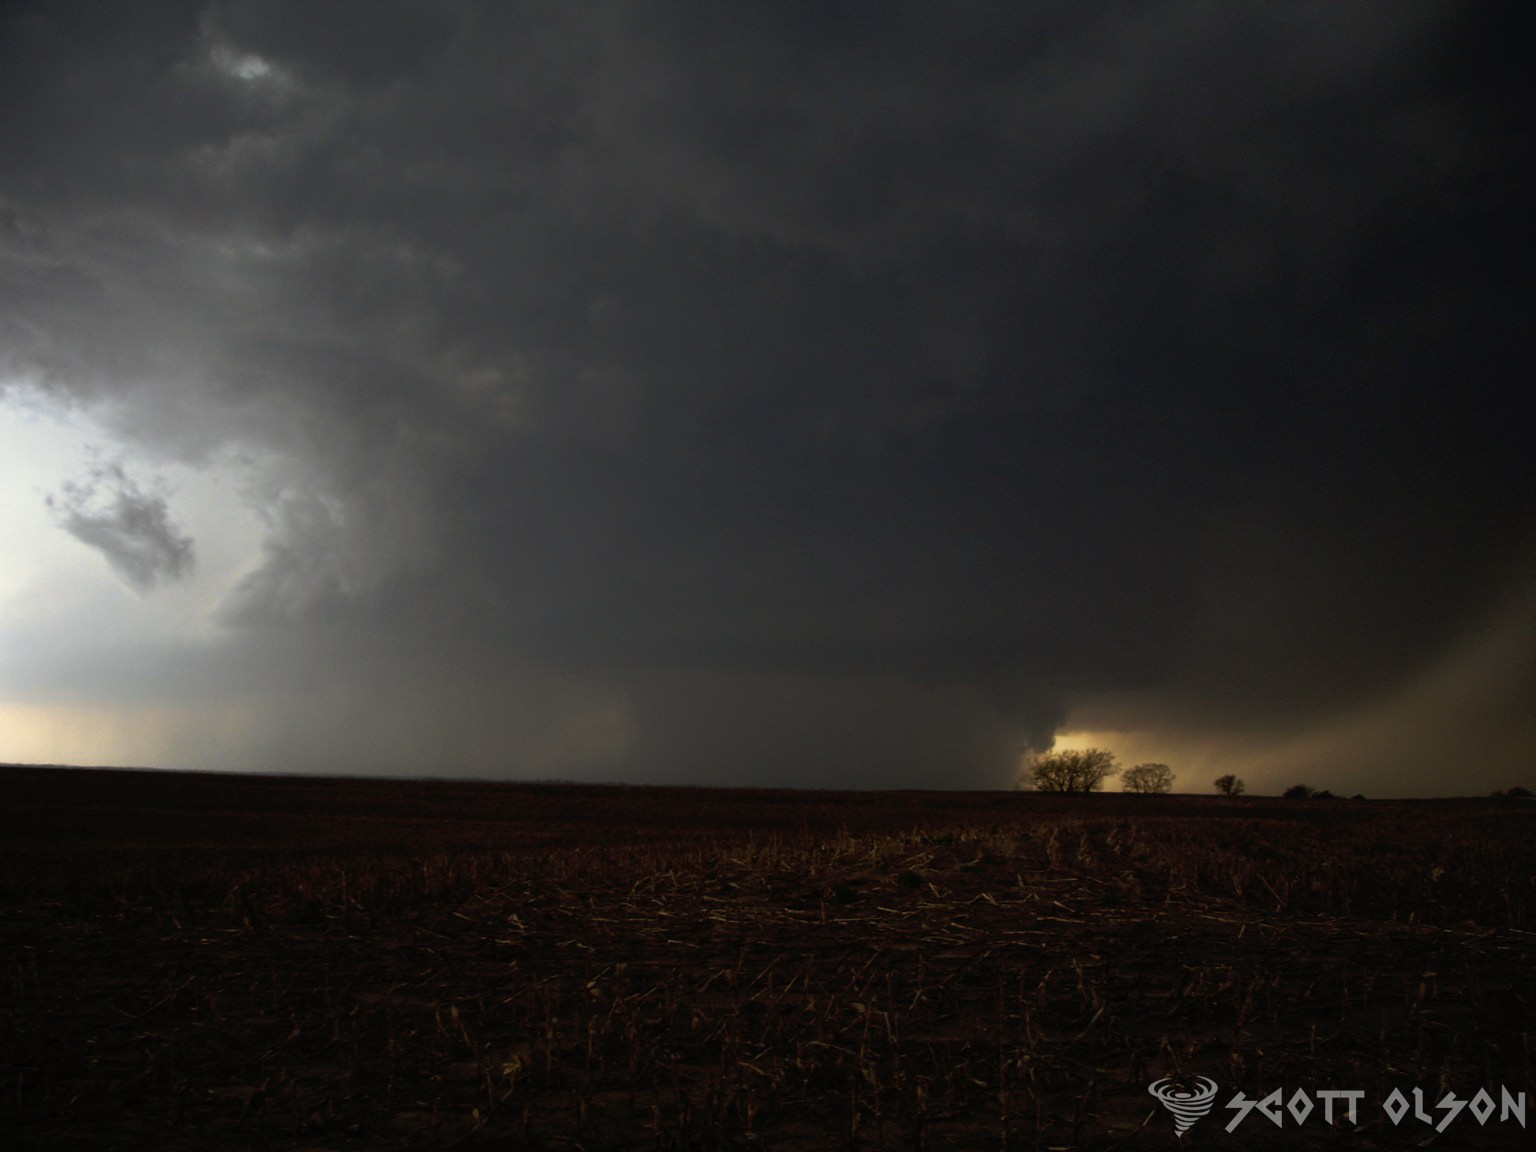
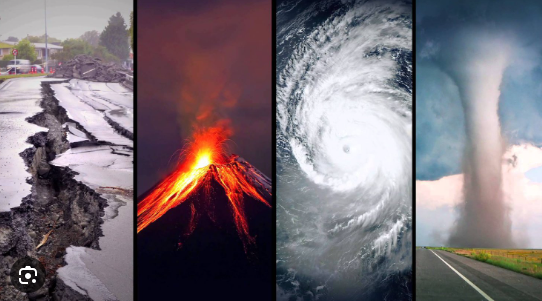
In the world of meteorology, forecasting severe weather events is a complex and challenging task. To help predict the likelihood of severe thunderstorms and tornadoes, meteorologists rely on various tools and indices. One such tool is the Supercell Composite Parameter (SCP), a powerful indicator that combines multiple atmospheric variables to assess the potential for supercell thunderstorm development. In this article, we will dive deep into the Supercell Composite Parameter, exploring its components, its significance in severe weather forecasting, and how it helps protect lives and property.
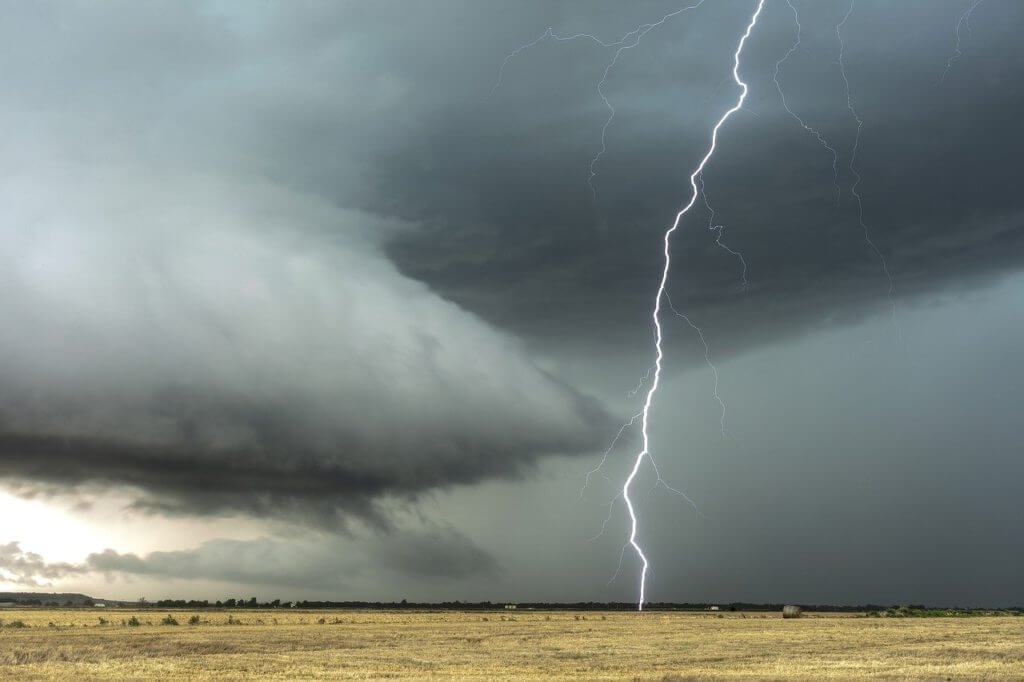
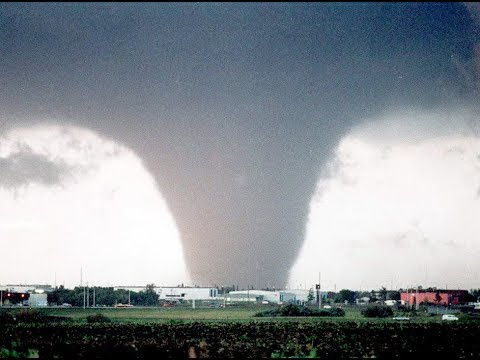
Understanding Supercell Thunderstorms: Before delving into the Supercell Composite Parameter, it’s essential to understand what supercell thunderstorms are and why they are so dangerous. Supercell thunderstorms are highly organized, rotating storms that can produce severe weather hazards such as large hail, damaging winds, and tornadoes. These storms are characterized by a persistent rotating updraft called a mesocyclone, which allows them to maintain their intensity for extended periods. Supercell thunderstorms are responsible for some of the most destructive and deadly severe weather events in history, making their accurate prediction a top priority for meteorologists.
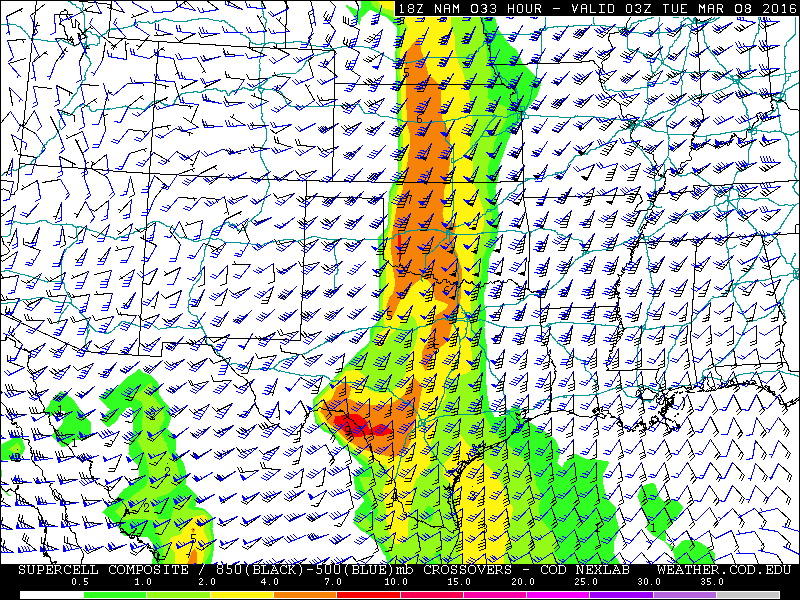
The Components of the Supercell Composite Parameter: The Supercell Composite Parameter is a mathematical formula that combines several key atmospheric variables to assess the potential for supercell thunderstorm development. The main components of the SCP are:
Convective Available Potential Energy (CAPE): CAPE is a measure of the atmospheric instability, representing the amount of energy available for thunderstorm development. Higher CAPE values indicate a greater potential for strong updrafts and severe weather.
Storm-Relative Helicity (SRH): SRH is a measure of the wind shear in the lower atmosphere, which is crucial for the formation of rotating updrafts in supercell thunderstorms. Higher SRH values suggest a greater likelihood of mesocyclone development and tornado potential.
Bulk Wind Difference (BWD): BWD represents the change in wind speed and direction with height, another important factor in supercell development. Strong wind shear, as indicated by high BWD values, helps to create an environment conducive to supercell formation.
Lifting Condensation Level (LCL): The LCL is the height at which air becomes saturated and condensation begins, leading to cloud formation. Lower LCL heights are associated with a greater potential for tornadoes, as they allow for a more concentrated and intense rotation near the ground.
The SCP formula combines these variables in a specific way to create a single value that represents the overall potential for supercell thunderstorm development. Higher SCP values indicate a greater risk of severe weather, particularly supercell thunderstorms and tornadoes.
The Significance of the Supercell Composite Parameter in Severe Weather Forecasting: The Supercell Composite Parameter is a crucial tool for meteorologists in their efforts to predict and warn the public about severe weather events. By analyzing SCP values, forecasters can identify areas where the atmospheric conditions are most favorable for supercell thunderstorm development. This information allows them to issue timely and accurate severe weather watches and warnings, giving people in affected areas the opportunity to take necessary precautions and seek shelter.
One of the key advantages of the SCP is its ability to provide a comprehensive assessment of the severe weather potential. By combining multiple atmospheric variables into a single value, the SCP offers a more holistic view of the overall risk, rather than relying on individual factors alone. This approach helps to reduce the likelihood of false alarms or missed events, improving the overall accuracy and reliability of severe weather forecasts.
Real-World Applications and Success Stories: The Supercell Composite Parameter has proven its value in numerous real-world severe weather events. Meteorologists have successfully used the SCP to anticipate and warn the public about impending supercell thunderstorms and tornadoes, saving countless lives and minimizing property damage.
For example, during the devastating tornado outbreak of April 27, 2011, which affected multiple states in the southeastern United States, the SCP played a crucial role in the forecasting process. Meteorologists recognized the extremely high SCP values across the region, indicating an exceptionally high risk of violent, long-track tornadoes. This information allowed forecasters to issue strongly worded warnings and urge people to take immediate action to protect themselves. While the outbreak still resulted in significant damage and loss of life, the accurate and timely warnings based on the SCP undoubtedly saved many lives.
Similarly, during the May 20, 2013, tornado outbreak in central Oklahoma, the SCP once again demonstrated its value. Forecasters identified the high SCP values in the region, suggesting a significant risk of strong to violent tornadoes. The warnings issued based on this information allowed people to seek shelter and prepare for the impending severe weather. The accurate forecasting and timely warnings were credited with saving numerous lives, even as the powerful tornadoes caused extensive damage.
Limitations and Ongoing Research: While the Supercell Composite Parameter is a valuable tool in severe weather forecasting, it is not without its limitations. The SCP is designed specifically to assess the potential for supercell thunderstorm development and does not account for other types of severe weather, such as non-supercell tornadoes or severe wind events. Additionally, the SCP is based on atmospheric conditions at a specific time and location and may not capture the full evolution of a severe weather event over time.
To address these limitations and further improve severe weather forecasting, ongoing research is focused on refining the SCP and developing new tools and techniques. Meteorologists and atmospheric scientists are working to incorporate additional variables, such as high-resolution radar data and machine learning algorithms, to enhance the accuracy and lead time of severe weather predictions.
One area of active research is the development of probabilistic forecasting methods that provide a range of possible outcomes based on the uncertainty in the atmospheric conditions. By presenting severe weather forecasts in terms of probabilities, meteorologists can better communicate the level of risk to the public and support more informed decision-making.
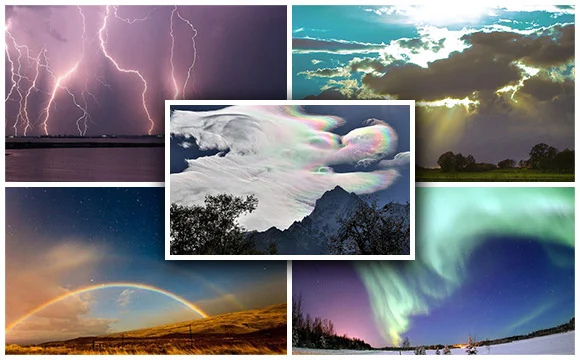
The Earth is a fascinating planet, filled with an incredible array of weather phenomena that can take your breath away. From the Northern Lights to the Morning Glory clouds, there are countless natural wonders that showcase the beauty and power of our planet’s atmosphere. In this article, we will explore the top 10 most beautiful places in the world to witness unique weather phenomena. These destinations offer a chance to experience some of the most awe-inspiring and unforgettable weather events on Earth, from the comfort of stunning natural landscapes. So pack your bags, grab your camera, and get ready to embark on a journey to witness the incredible beauty of our planet’s weather.
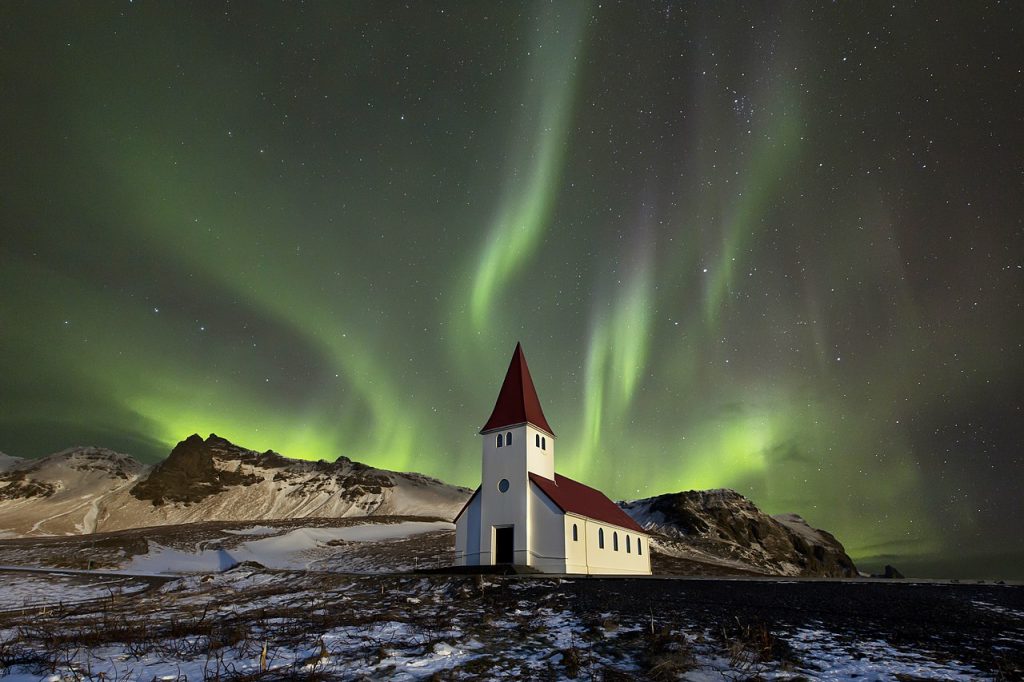
1.Aurora Borealis in Iceland The Aurora Borealis, also known as the Northern Lights, is one of the most spectacular natural phenomena in the world. This incredible light show is caused by charged particles from the sun colliding with the Earth’s atmosphere, creating a dazzling display of colorful lights in the night sky. While the Northern Lights can be seen from many places in the world, Iceland is one of the best destinations to witness this incredible phenomenon. With its stunning landscapes, including glaciers, waterfalls, and geothermal hot springs, Iceland offers a truly unforgettable backdrop for this celestial light show. The best time to see the Northern Lights in Iceland is from September to March, when the nights are long and dark.
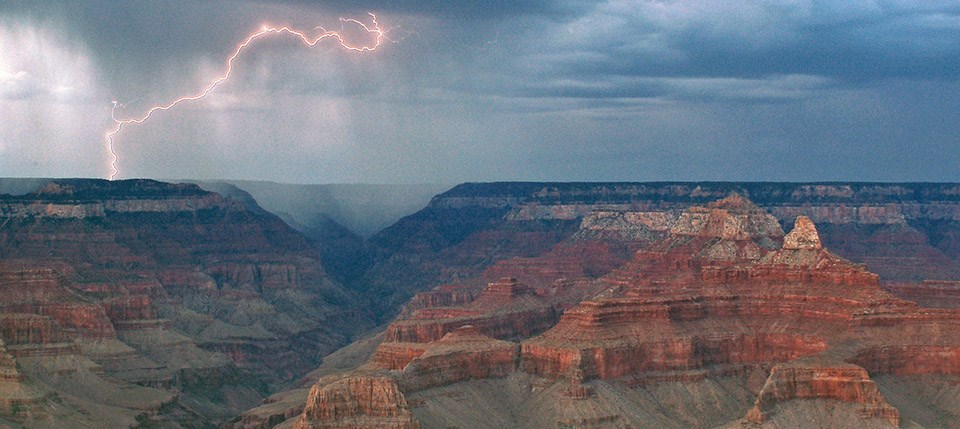
2.Thunderstorms in the Grand Canyon, USA The Grand Canyon is one of the most iconic natural wonders in the world, known for its stunning red rock formations and vast expanses of desert landscape. However, what many people don’t know is that the Grand Canyon is also one of the best places in the world to witness incredible thunderstorms. During the summer months, the heat of the day can trigger intense thunderstorms that light up the sky with lightning and fill the canyon with the sound of thunder. Watching a thunderstorm roll in over the Grand Canyon is an unforgettable experience, as the lightning illuminates the red rock walls and the thunder echoes through the vast expanse of the canyon.
3.Rainbows in Hawaii, USA Hawaii is known for its stunning beaches, lush landscapes, and incredible natural beauty. However, one of the most spectacular weather phenomena that can be witnessed in Hawaii is the appearance of vibrant rainbows. Due to the island’s unique geography and climate, rainbows are a common sight in Hawaii, often appearing after a brief rain shower. The best place to see rainbows in Hawaii is on the island of Kauai, known as the “Garden Isle” for its lush landscapes and incredible natural beauty. Whether you’re hiking through the island’s stunning valleys or simply relaxing on the beach, keep an eye out for these incredible natural wonders.
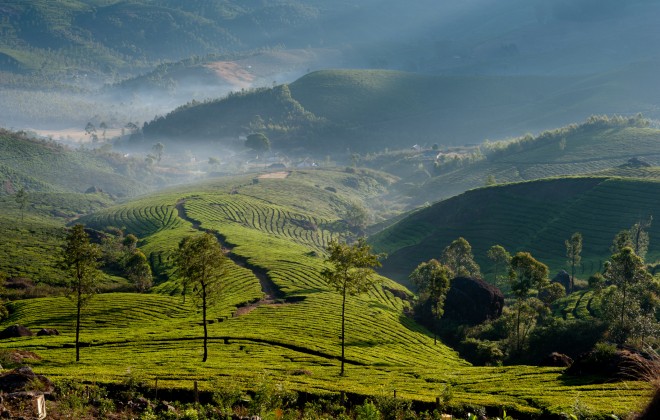
4.Monsoon Season in India India is a country of incredible diversity, with a wide range of landscapes and cultures that make it a truly unique destination. However, one of the most spectacular weather phenomena that can be witnessed in India is the annual monsoon season. From June to September, the country is drenched in heavy rains that transform the landscape into a lush, green paradise. The best place to experience the monsoon season in India is in the state of Kerala, known for its stunning backwaters and incredible natural beauty. Watching the rain pour down over the lush landscapes of Kerala is an unforgettable experience, as the sound of the rain mixes with the calls of exotic birds and the scent of spices in the air.
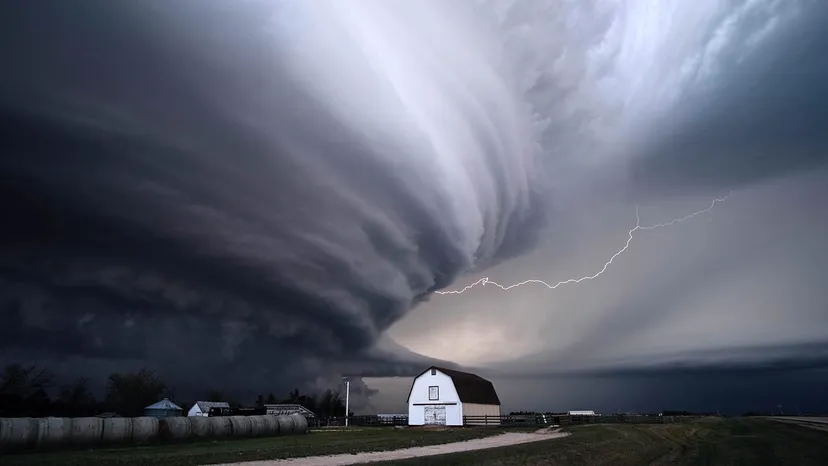
6.Tornado Alley in the USA Tornado Alley is a region in the central United States that is known for its high frequency of tornadoes. While tornadoes can be incredibly dangerous and destructive, they are also a fascinating and awe-inspiring weather phenomenon to witness. The best place to see tornadoes in Tornado Alley is in the state of Oklahoma, where the flat, open landscapes provide the perfect conditions for these incredible storms to form. While it is never safe to chase tornadoes, there are many tour companies that offer guided tours of Tornado Alley, allowing visitors to witness these incredible storms from a safe distance.
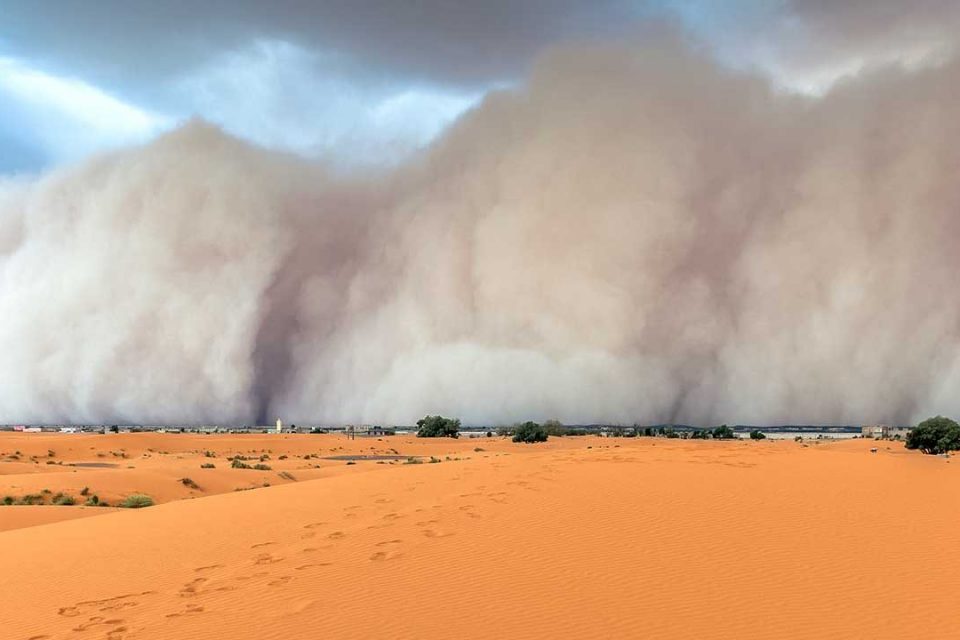
7.Sahara Desert Dust Storms in Morocco The Sahara Desert is one of the most iconic landscapes in the world, known for its vast expanses of sand and incredible natural beauty. However, one of the most spectacular weather phenomena that can be witnessed in the Sahara Desert is the appearance of dust storms. These incredible storms can reach heights of up to 10,000 feet and can travel for hundreds of miles, blanketing the landscape in a haze of red dust. The best place to witness Sahara Desert dust storms is in the country of Morocco, where the stunning landscapes of the Sahara Desert meet the rugged coastline of the Atlantic Ocean. Watching a dust storm roll in over the desert is an unforgettable experience, as the red haze of the storm mixes with the golden light of the setting sun.
8.Midnight Sun in Norway The Midnight Sun is a natural phenomenon that occurs in the Arctic and Antarctic regions during the summer months, when the sun remains visible in the sky for 24 hours a day. While this phenomenon can be witnessed in many places around the world, one of the most beautiful destinations to experience the Midnight Sun is in the country of Norway. With its stunning fjords, rugged coastline, and incredible natural beauty, Norway offers a truly unforgettable backdrop for this incredible weather event. The best time to witness the Midnight Sun in Norway is from May to July, when the sun never sets below the horizon.
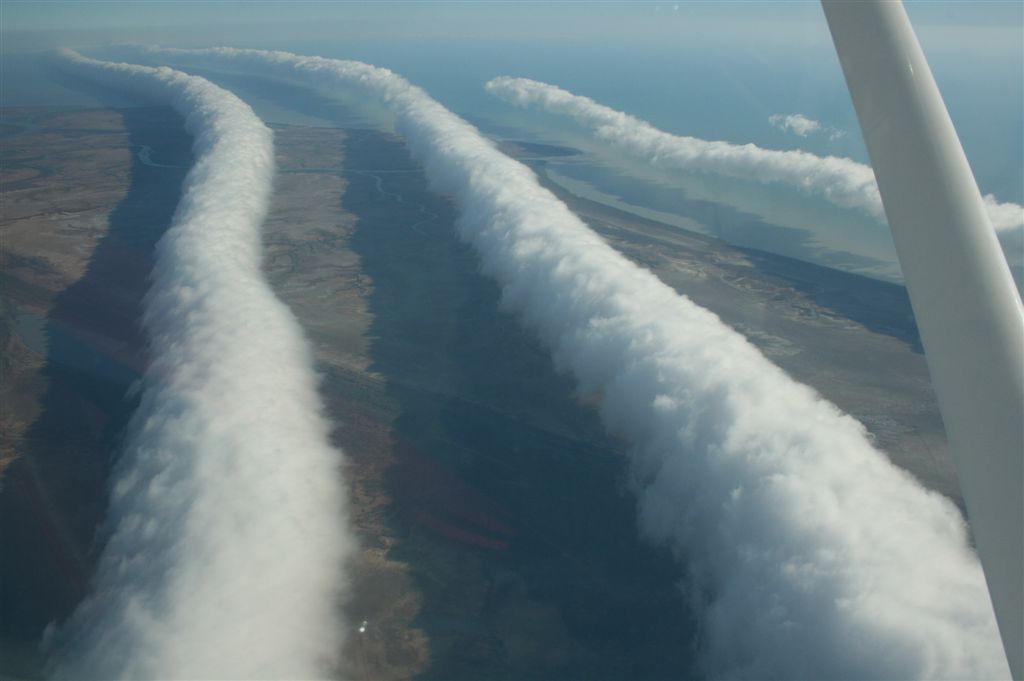
9.Morning Glory Clouds in Australia Morning Glory clouds are a rare and incredible weather phenomenon that can only be witnessed in a few places around the world. These long, tubular clouds can stretch for hundreds of miles and are often accompanied by strong winds and turbulence. The best place to witness Morning Glory clouds is in the Gulf of Carpentaria in northern Australia, where they typically appear during the months of September and October. Watching these incredible clouds roll in over the stunning landscapes of northern Australia is an unforgettable experience, as the tubular clouds stretch out across the horizon like a celestial highway.
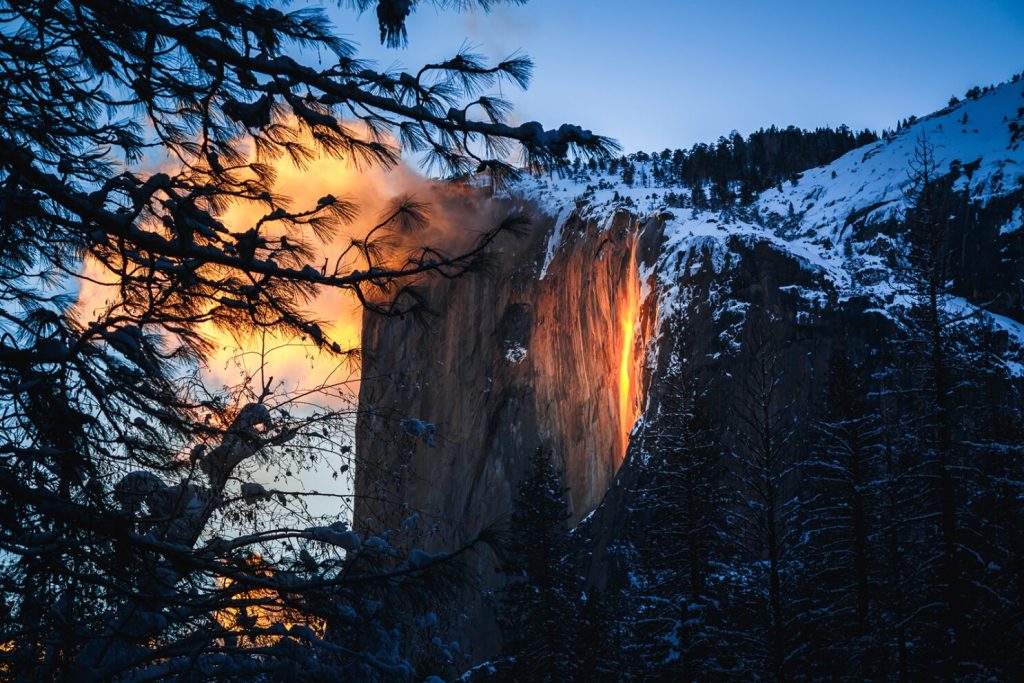
10. Yosemite Firefall in California, USA The Yosemite Firefall is a rare and incredible weather phenomenon that occurs in Yosemite National Park in California. During the last two weeks of February, the setting sun illuminates the Horsetail Fall waterfall, creating the illusion of a glowing, fiery cascade. This incredible phenomenon only occurs when the conditions are just right, with clear skies and the sun at the perfect angle. Watching the Yosemite Firefall is an unforgettable experience, as the stunning landscapes of Yosemite National Park are transformed into a glowing, otherworldly paradise.
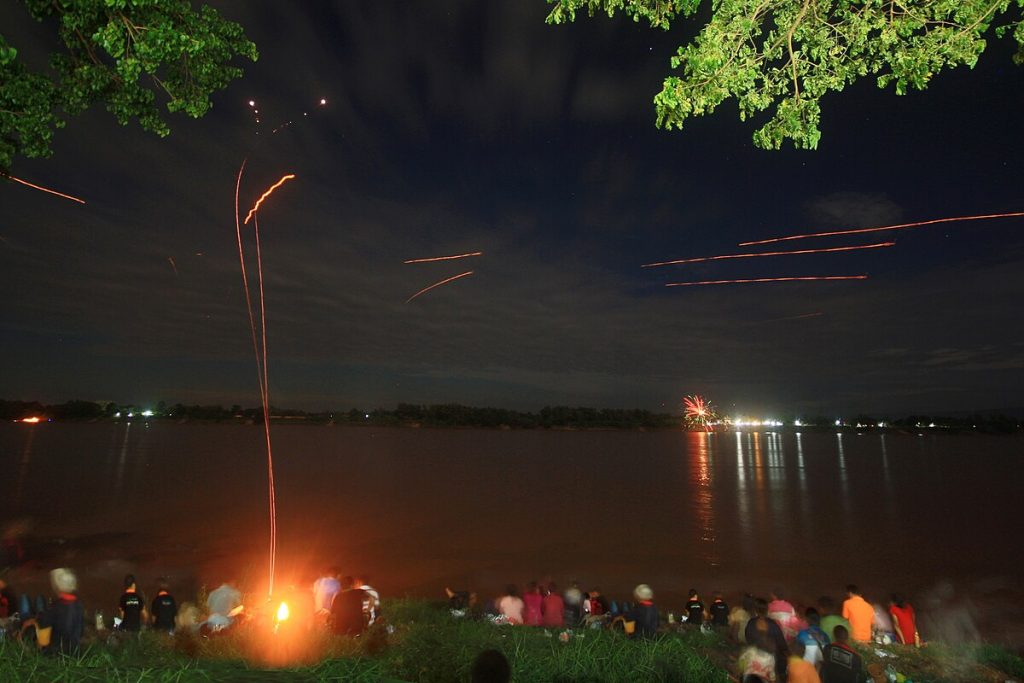
11. Naga Fireballs in Thailand The Naga Fireballs are a mysterious and incredible weather phenomenon that occurs along the Mekong River in Thailand and Laos. During the full moon in October, thousands of glowing orbs rise from the river and float into the night sky, creating an incredible display of light and color. While the exact cause of this phenomenon is still unknown, it is believed to be related to the release of methane gas from the river. Watching the Naga Fireballs rise from the Mekong River is an unforgettable experience, as the stunning landscapes of Southeast Asia are transformed into a glowing, mystical wonderland.
The Earth’s atmosphere is a complex and dynamic system that can produce some of the most awe-inspiring and rare weather phenomena. From mesmerizing light shows to terrifying natural disasters, these events are so extraordinary that most people will only witness them once in their lifetime, if at all. In this article, we will explore ten of the most incredible and rare weather phenomena that have left even the most experienced meteorologists in awe.
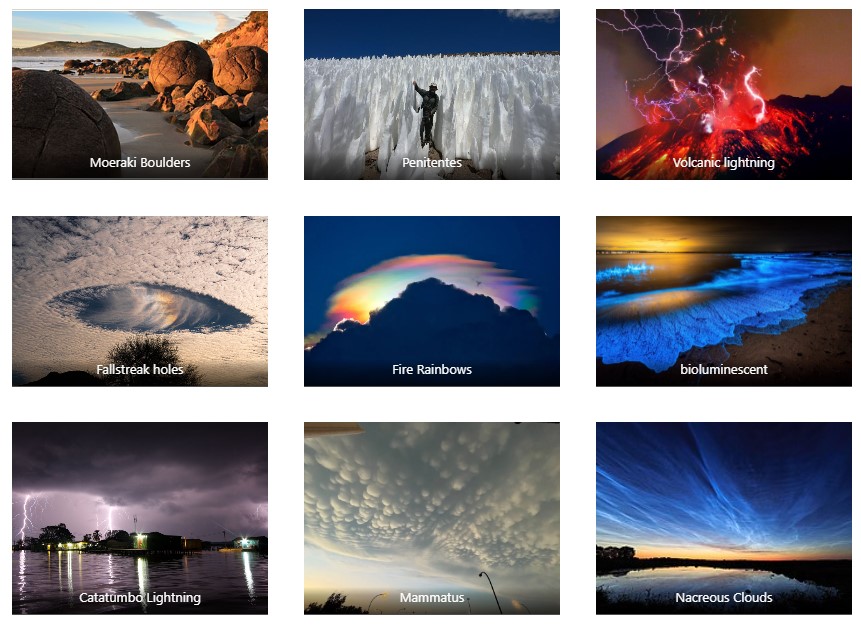
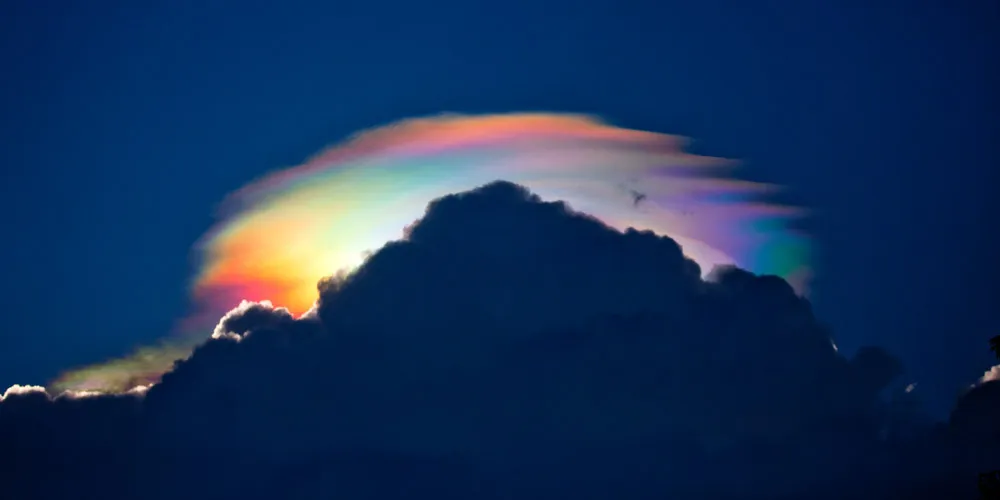
Fire Rainbows Fire rainbows, also known as circumhorizontal arcs, are a rare and breathtaking optical phenomenon that occurs when the sun is higher than 58° above the horizon. This creates a halo-like effect that appears to be a rainbow on fire, with colors ranging from red to violet. The conditions necessary for fire rainbows to form are incredibly specific, requiring cirrus clouds that are made up of plate-shaped ice crystals. These crystals act as prisms, refracting the sunlight and creating the illusion of a burning rainbow in the sky. Fire rainbows are most commonly seen in the summer months and are a true spectacle to behold.
Bioluminescent Waves Imagine walking along a beach at night and suddenly seeing the waves glowing a brilliant blue. This incredible phenomenon is known as bioluminescent waves and is caused by tiny marine microbes called dinoflagellates. When these microbes are disturbed by the movement of the waves, they emit a bright blue light as a defense mechanism. Bioluminescent waves are most commonly seen in warm, tropical waters and are truly a sight to behold. Witnessing this phenomenon is a once-in-a-lifetime experience that will leave you in awe of the natural world.
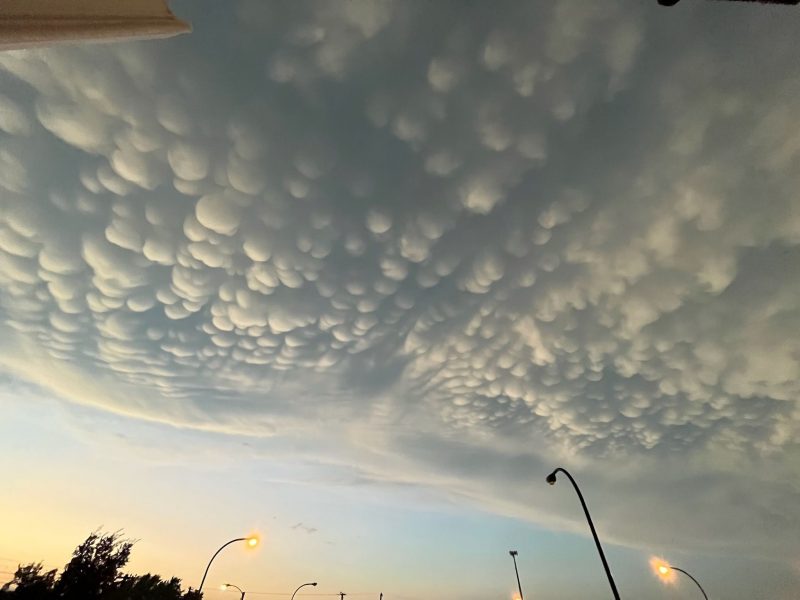
Mammatus Clouds Mammatus clouds are a rare and unusual type of cloud formation that look like pouches or udders hanging from the underside of a thunderstorm cloud. These clouds are formed when cold air sinks into warmer air, creating a series of bulges and pouches. Mammatus clouds are often associated with severe thunderstorms and can be a sign of impending hail or tornadoes. While they may look ominous, mammatus clouds are a fascinating and rare sight that most people will only witness once in their lifetime.
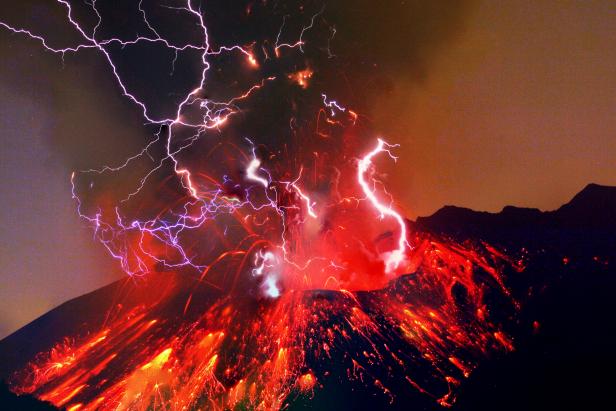
Volcanic Lightning Volcanic lightning is one of the most awe-inspiring and terrifying weather phenomena on Earth. This rare event occurs when a volcano erupts, sending ash and other particles into the atmosphere. As these particles collide with each other, they create an electrical charge that can result in lightning strikes within the volcanic plume. Volcanic lightning is incredibly dangerous and can reach temperatures of up to 30,000°C (54,000°F). Witnessing this phenomenon is a once-in-a-lifetime experience that requires being in the right place at the right time.
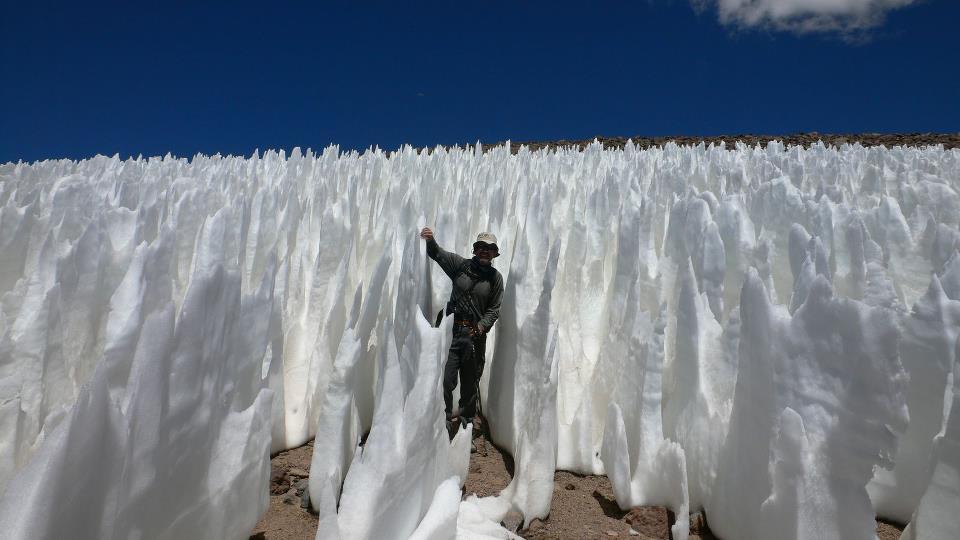
Penitentes Penitentes are a rare and eerie snow formation that can be found in high-altitude regions of the Andes Mountains. These tall, thin spires of hardened snow can reach heights of up to 4 meters (13 feet) and are formed by a combination of strong winds, dry air, and intense sunlight. As the sun melts the snow, the wind carves it into strange, towering shapes that resemble hooded monks. Penitentes are named after the pointed hoods worn by penitent monks during Easter processions and are a true wonder of the natural world.
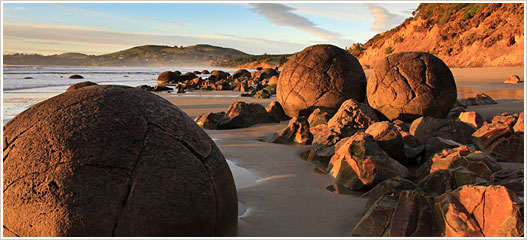
Moeraki Boulders The Moeraki Boulders are a collection of large, spherical boulders that can be found along the Otago coast of New Zealand. These boulders are made of mud, fine silt, and clay, and are believed to have formed around 60 million years ago. Over time, the boulders were exposed by erosion and have become a popular tourist attraction. What makes the Moeraki Boulders truly unique is their almost perfectly spherical shape and the intricate patterns on their surface that resemble turtle shells. Seeing these boulders in person is a once-in-a-lifetime experience that will leave you in awe of the power of nature.
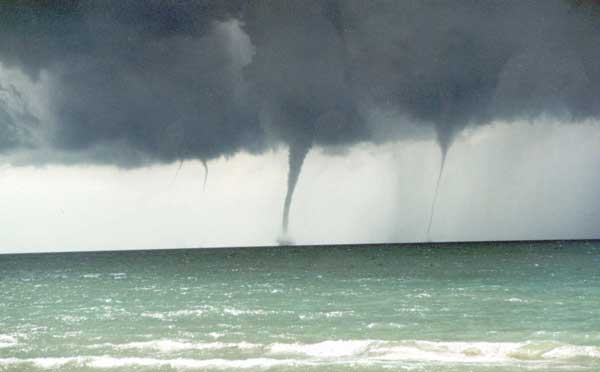
Waterspouts Waterspouts are a type of tornado that forms over water and can be just as dangerous as their land-based counterparts. These swirling vortexes of water and air are most commonly seen in tropical and subtropical waters and can reach heights of up to 100 meters (330 feet). Waterspouts are formed when a column of rotating air comes into contact with a body of water, creating a funnel-shaped cloud that can suck up water and debris. Witnessing a waterspout is a rare and unforgettable experience that requires being in the right place at the right time.
Nacreous Clouds Nacreous clouds, also known as mother-of-pearl clouds, are a rare and beautiful type of cloud that can only be seen in polar regions during the winter months. These clouds form in the lower stratosphere at altitudes of around 20 kilometers (12 miles) and are made up of tiny ice crystals. What makes nacreous clouds so special is their iridescent appearance, which is caused by the way the ice crystals refract and reflect sunlight. Nacreous clouds are a true wonder of the natural world and are a sight that most people will only witness once in their lifetime.
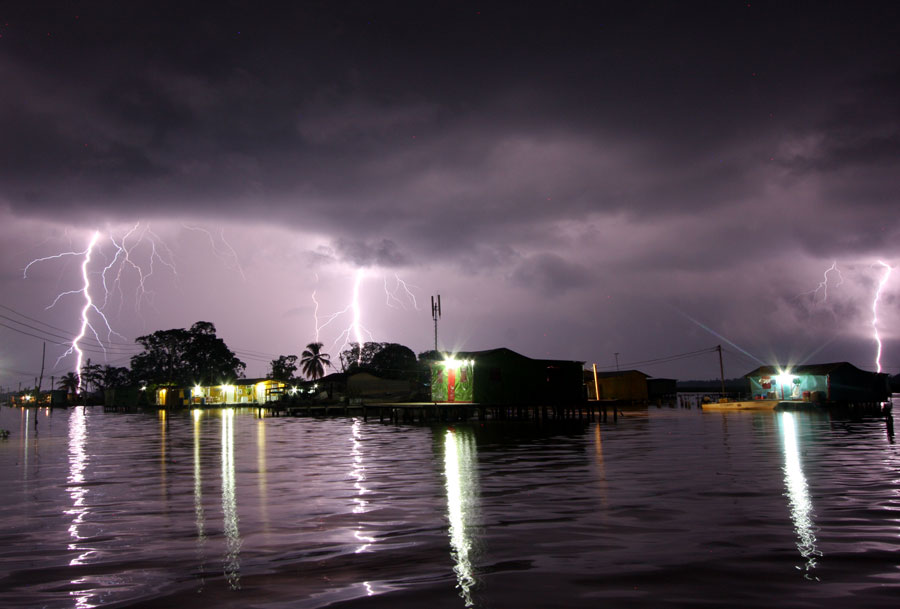
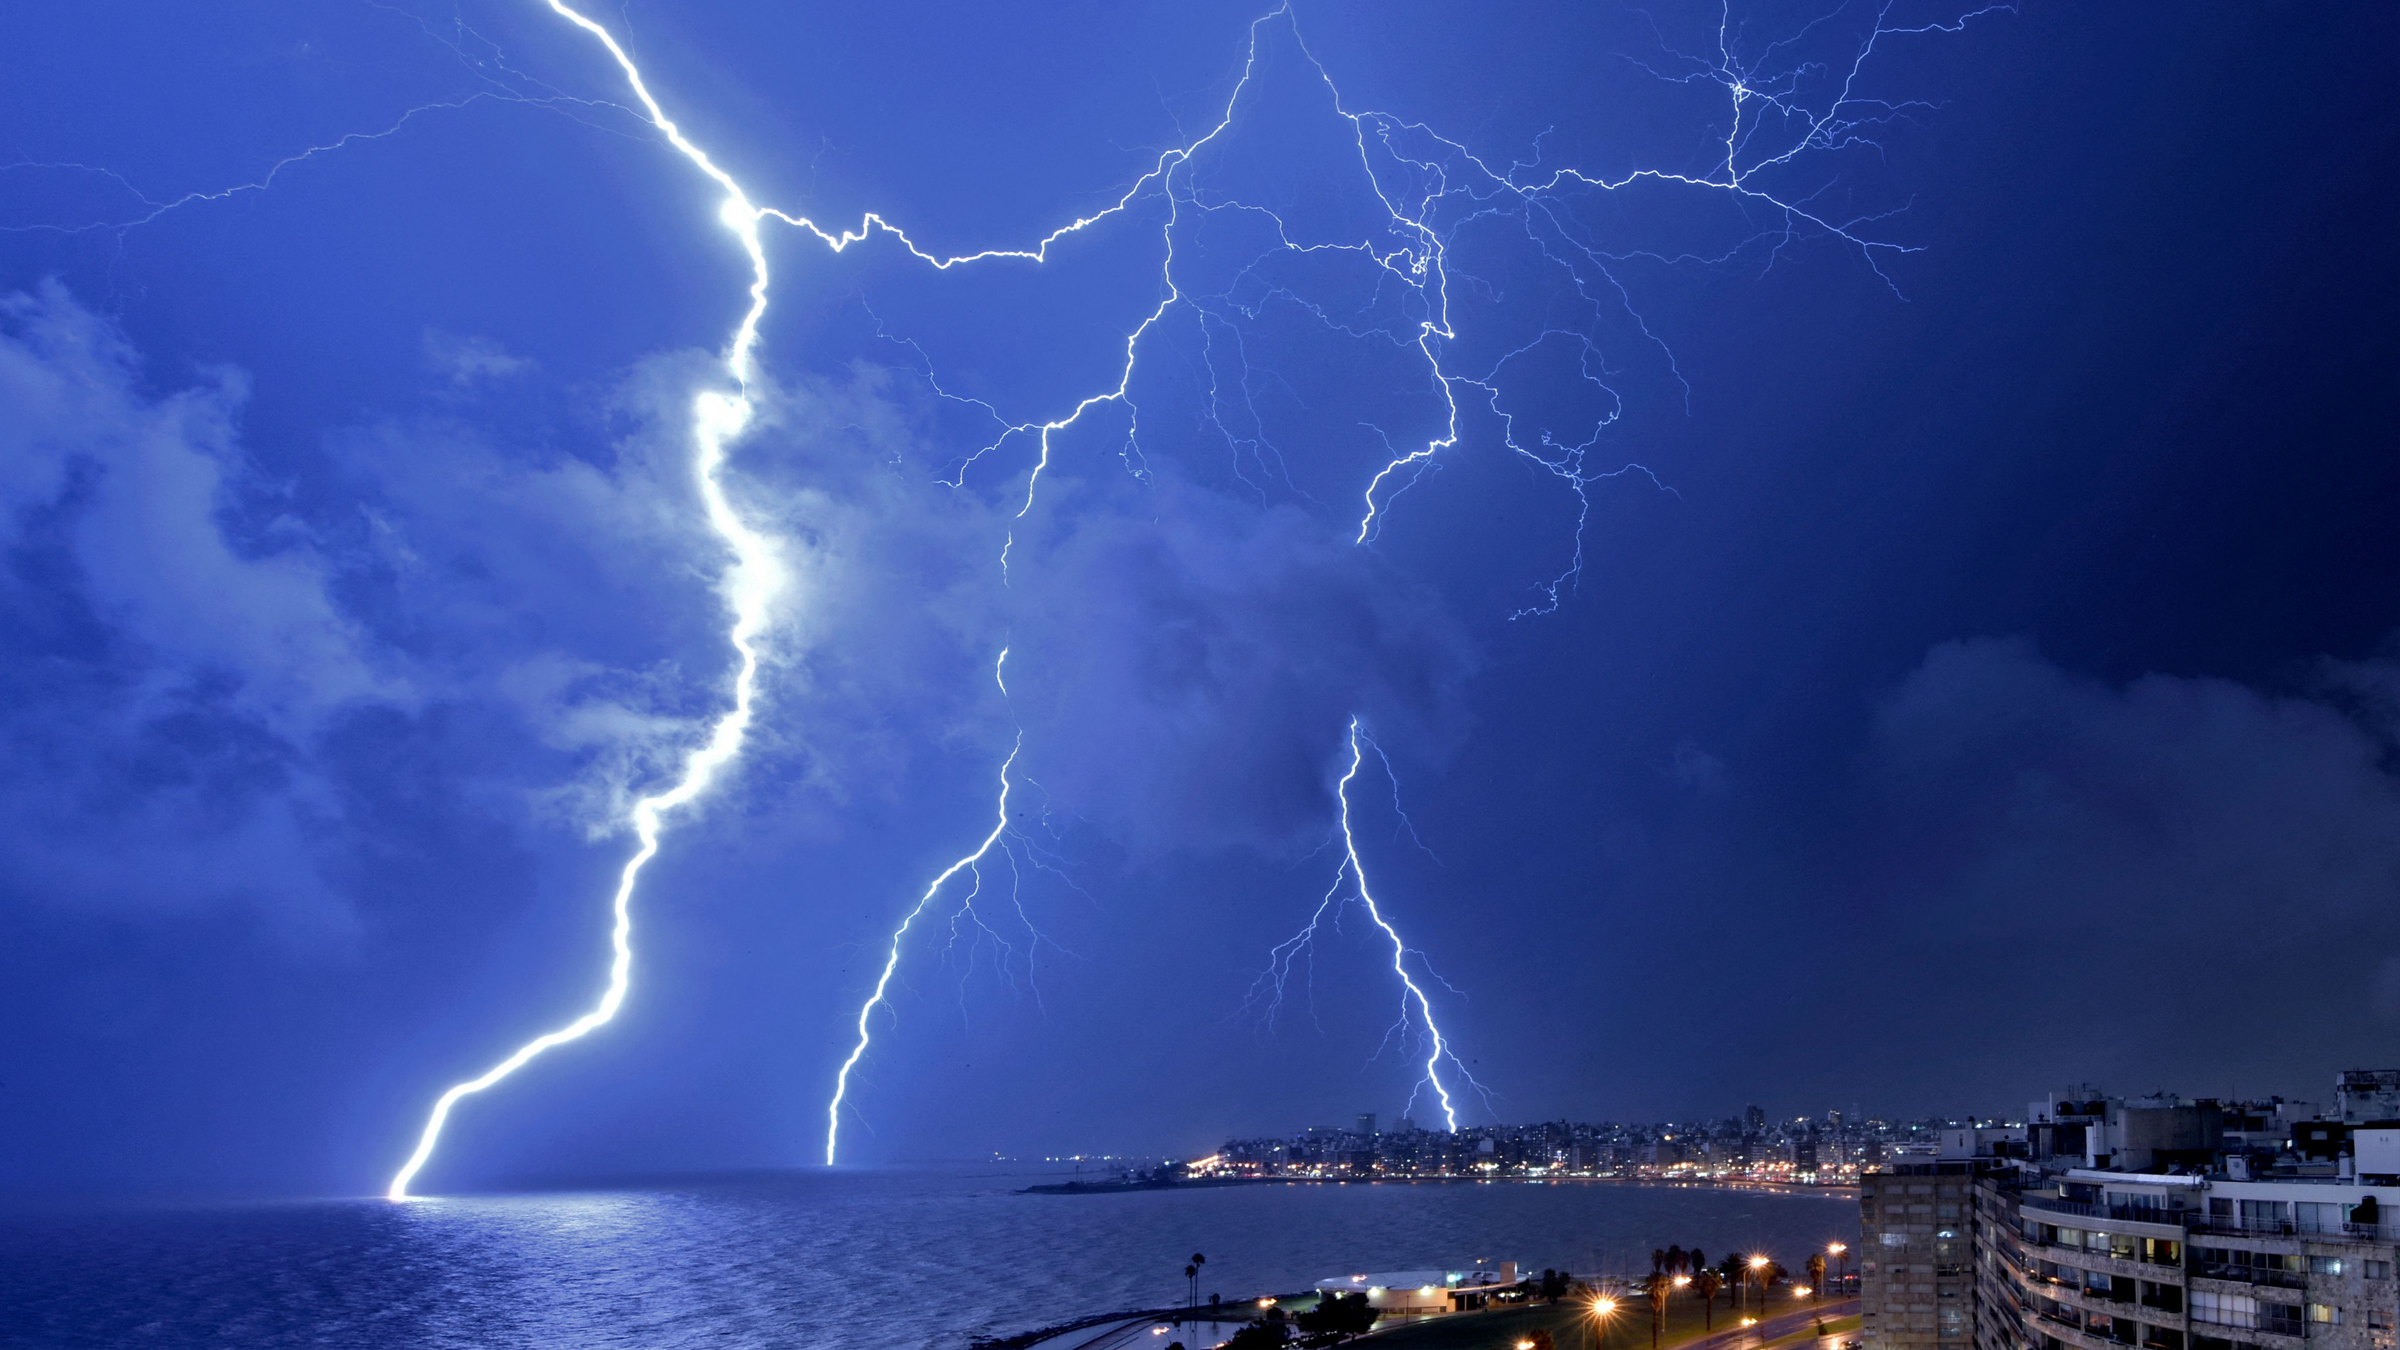
Catatumbo Lightning Catatumbo lightning is a unique and persistent lightning storm that occurs over the mouth of the Catatumbo River in Venezuela. This lightning storm is so consistent that it has been named the “Eternal Storm” and can produce up to 28 lightning strikes per minute. The exact cause of Catatumbo lightning is still unknown, but it is believed to be related to the unique topography and wind patterns in the area. Witnessing this incredible lightning storm is a once-in-a-lifetime experience that will leave you in awe of the raw power of nature.
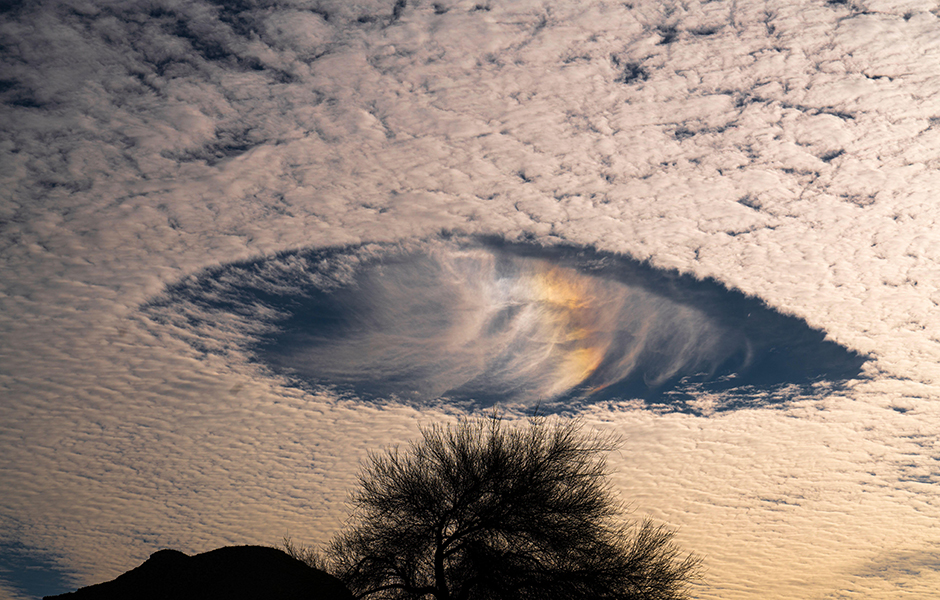
Fallstreak Holes Fallstreak holes, also known as hole-punch clouds, are a rare and fascinating cloud formation that looks like a circular hole in the sky. These holes are formed when the water droplets in a cloud layer freeze into ice crystals and begin to fall, leaving a circular gap in the cloud cover. As the ice crystals fall, they often create a streamer of wispy clouds that can resemble a jellyfish or a UFO. Fallstreak holes are most commonly seen in mid-level clouds and are a true wonder of the natural world.
While the ten weather phenomena mentioned above are some of the most incredible and rare, there are countless other weather events that are just as awe-inspiring. Here are three runner-up weather phenomena that deserve an honorable mention:
Sun HalosLenticular CloudsNoctilucent Clouds
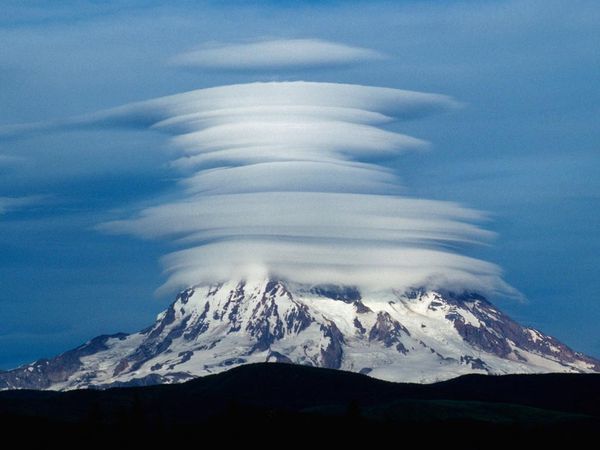
Lenticular Clouds Lenticular clouds are a type of stationary cloud that forms when moist air flows over a mountain or other obstacle. These clouds are often mistaken for UFOs due to their smooth, saucer-like shape and their ability to remain stationary in the sky. Lenticular clouds are most commonly seen near mountain ranges and are a favorite among photographers and cloud enthusiasts. While they may not be as rare as some of the other phenomena on this list, lenticular clouds are still a sight to behold and are sure to leave a lasting impression on anyone who witnesses them.
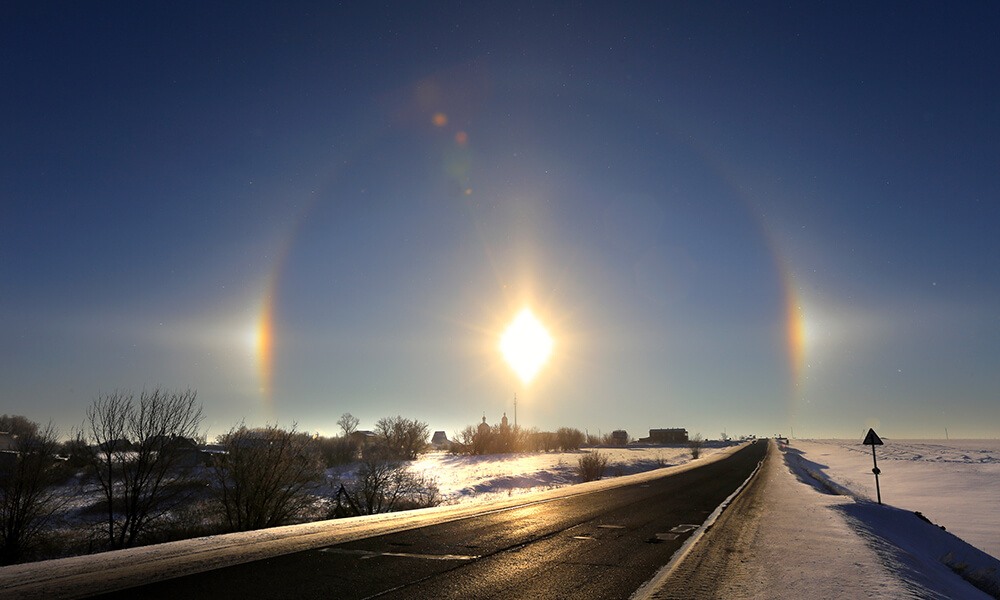
Sun Halos Sun halos are a beautiful and ethereal optical phenomenon that occurs when sunlight is refracted by ice crystals in the atmosphere. These halos appear as a circular rainbow around the sun and can sometimes be accompanied by sun dogs, which are bright spots on either side of the halo. Sun halos are most commonly seen in cold, polar regions where ice crystals are abundant in the atmosphere. While they may not be as rare as some of the other phenomena on this list, sun halos are still a breathtaking sight that is sure to leave a lasting impression on anyone who witnesses them.
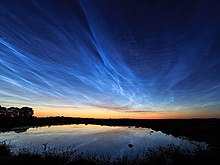
Noctilucent Clouds Noctilucent clouds are a rare and mysterious type of cloud that can only be seen during the summer months in polar regions. These clouds form at incredibly high altitudes of around 80 kilometers (50 miles) and are made up of tiny ice crystals that reflect sunlight long after the sun has set. Noctilucent clouds are often described as having a bright, electric blue color and can be seen glowing in the night sky. While the exact cause of these clouds is still unknown, they are believed to be related to changes in the Earth’s atmosphere and climate. Witnessing noctilucent clouds is a truly unforgettable experience that is sure to leave a lasting impression on anyone who is lucky enough to see them.
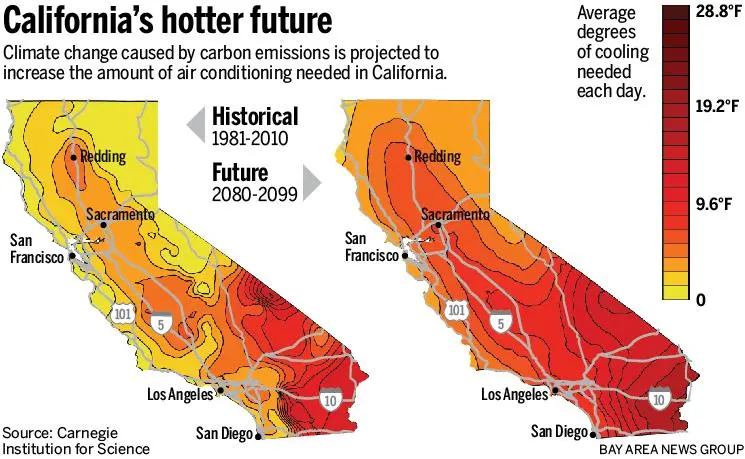
When it comes to choosing a place to live, climate and weather conditions are important factors to consider. The right climate can provide comfort, enjoyment, and even health benefits, while the wrong climate can lead to discomfort, inconvenience, and potential health risks. In this article, we’ll explore some of the best and worst places to live based on their climate and weather conditions.
Best Places to Live
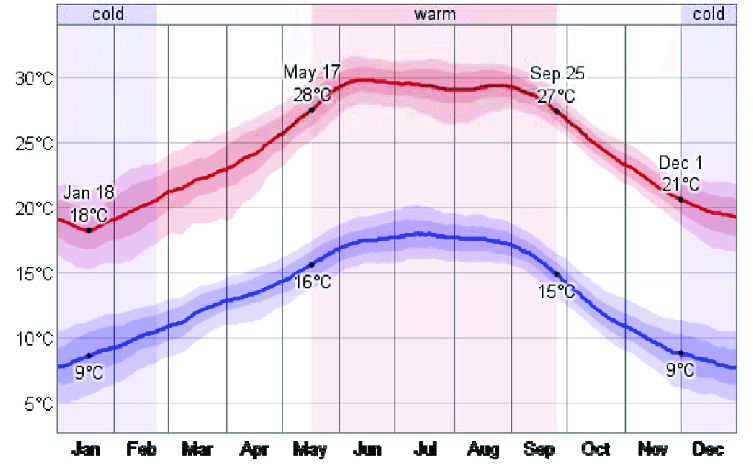
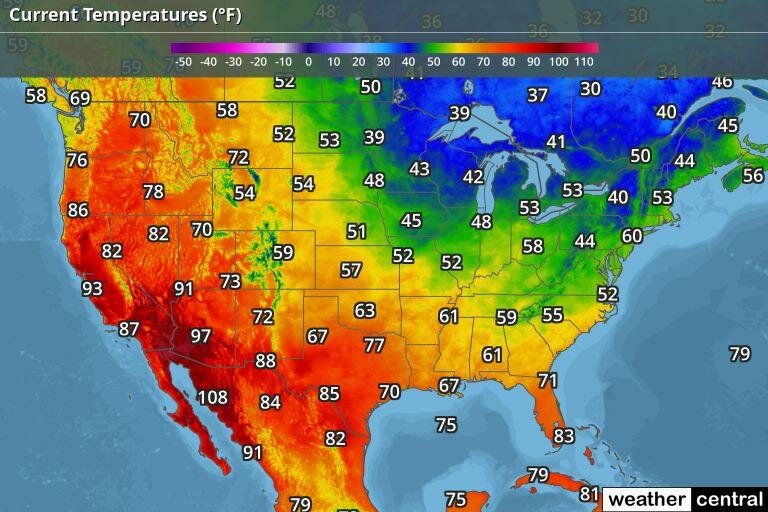
San Diego, California San Diego is often considered one of the best places to live in the United States, thanks in large part to its near-perfect weather. With an average temperature of 70°F (21°C) and minimal rainfall, San Diego enjoys a Mediterranean climate that is comfortable year-round. The city experiences an average of 266 sunny days per year, making it an ideal location for outdoor activities like hiking, surfing, and golfing. Additionally, the low humidity levels in San Diego make it a great place for people with respiratory issues.
Honolulu, Hawaii Honolulu, the capital city of Hawaii, is another top contender for best weather in the United States. With an average temperature of 80°F (27°C) and consistent trade winds, Honolulu enjoys a tropical climate that is warm and pleasant throughout the year. The city experiences an average of 90 rainy days per year, but most of the rainfall occurs in the winter months and is brief and light. Honolulu’s climate is perfect for beach-goers, as the water temperature rarely drops below 75°F (24°C).
Malaga, Spain Moving across the globe, Malaga is a city on the southern coast of Spain that boasts an ideal climate for those who enjoy warm, sunny weather. With an average temperature of 69°F (20°C) and over 300 days of sunshine per year, Malaga is a popular destination for tourists and expats alike. The city’s location on the Mediterranean Sea moderates its temperature, preventing it from getting too hot in the summer or too cold in the winter. Malaga’s climate is perfect for outdoor activities like hiking, cycling, and swimming.
Medellin, Colombia Medellin, the second-largest city in Colombia, has been dubbed the “City of Eternal Spring” due to its pleasant weather year-round. With an average temperature of 72°F (22°C) and minimal temperature fluctuations throughout the year, Medellin’s climate is comfortable and consistent. The city experiences a rainy season from April to November, but the rain is usually brief and occurs in the afternoon or evening. Medellin’s climate is ideal for outdoor activities like hiking, paragliding, and exploring the city’s many parks and green spaces.
Kunming, China Kunming, the capital city of China’s Yunnan Province, is known as the “Spring City” due to its mild climate and year-round greenery. With an average temperature of 59°F (15°C) and low humidity levels, Kunming’s climate is comfortable and pleasant. The city experiences a rainy season from May to October, but the rainfall is usually light and occurs in the afternoon or evening. Kunming’s climate is perfect for outdoor activities like hiking, cycling, and exploring the city’s many parks and gardens.
Worst Places to Live
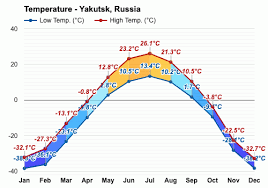
Yakutsk, Russia Yakutsk, located in the Russian Far East, is the coldest city in the world, with temperatures regularly dropping below -40°F (-40°C) in the winter months. The city’s average annual temperature is just 16°F (-9°C), and it experiences over 200 days of sub-zero temperatures each year. In addition to the extreme cold, Yakutsk also experiences heavy snowfall and limited daylight hours during the winter months. Living in Yakutsk requires special adaptations, such as wearing multiple layers of clothing and using specialized vehicles that can operate in extreme cold.
Mecca, Saudi Arabia On the opposite end of the spectrum, Mecca, located in the desert region of Saudi Arabia, is one of the hottest places on Earth. With summer temperatures regularly exceeding 110°F (43°C) and minimal rainfall throughout the year, Mecca’s climate is extremely hot and dry. The city’s location in a valley surrounded by mountains traps heat and makes it even more unbearable. Living in Mecca requires constant hydration, air conditioning, and limited outdoor activities during the hottest parts of the day.
Cherrapunji, India Cherrapunji, located in the northeastern state of Meghalaya in India, is one of the wettest places on Earth. The city receives an average of 463 inches (11,777 mm) of rainfall per year, with most of it occurring during the monsoon season from June to September. The heavy rainfall can lead to landslides, flooding, and damage to infrastructure. Living in Cherrapunji requires adaptations such as raised houses, covered walkways, and a reliance on rain harvesting for water supply.
Tornado Alley, United States Tornado Alley is a region in the central United States that is prone to frequent and severe tornadoes. The area includes parts of Texas, Oklahoma, Kansas, Nebraska, and South Dakota, among others. Tornadoes can occur at any time of year but are most common in the spring and summer months. Living in Tornado Alley requires constant vigilance and preparation, including having a designated storm shelter and an emergency plan in place.
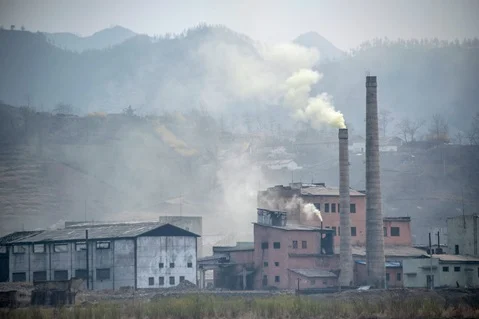
Dhaka, Bangladesh Dhaka, the capital city of Bangladesh, is one of the most polluted cities in the world, with air quality levels that regularly exceed World Health Organization guidelines. The city’s rapid industrialization and population growth have led to high levels of air pollution from sources such as vehicle emissions, brick kilns, and waste burning. Living in Dhaka can lead to respiratory issues, cardiovascular disease, and other health problems associated with air pollution.
Factors to Consider When evaluating the best and worst places to live based on climate and weather conditions, there are several factors to consider:
Temperature
Temperature: Consider the average temperature range throughout the year, as well as the frequency and severity of extreme temperatures.
Precipitation
Precipitation: Look at the average amount and distribution of rainfall or snowfall throughout the year, as well as the potential for extreme weather events like hurricanes or monsoons.
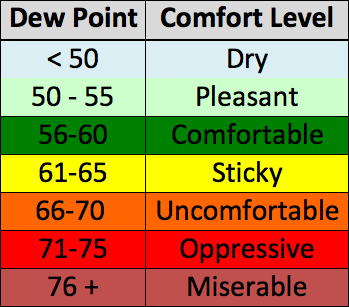
Humidity: High humidity levels can make hot temperatures feel even more oppressive, while low humidity can lead to dry skin and respiratory issues.
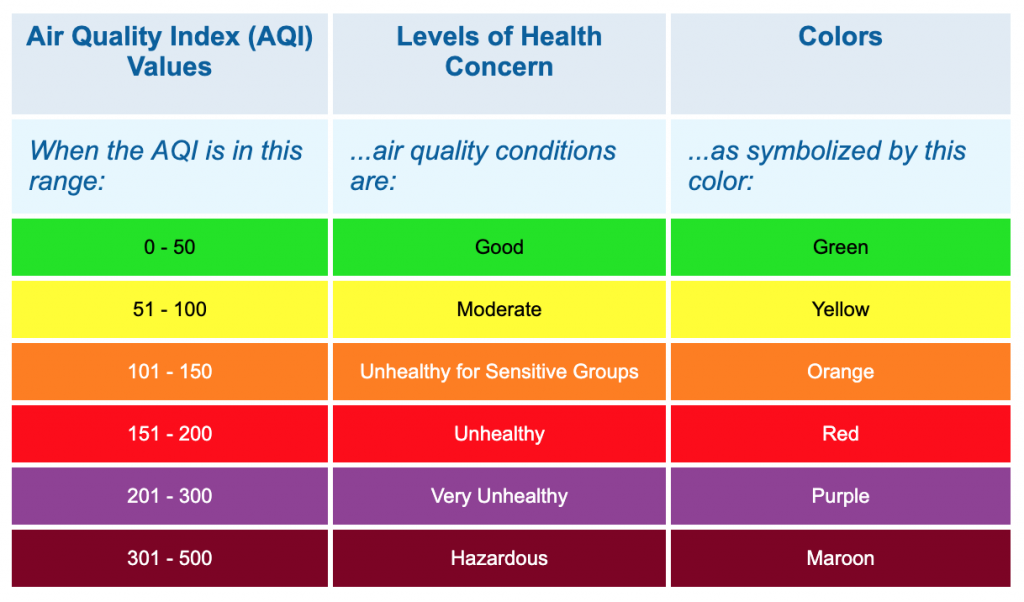
Air Quality: Poor air quality due to pollution or natural factors like dust or pollen can have negative impacts on health and quality of life.
Natural Disasters: Some areas are more prone to natural disasters like earthquakes, wildfires, or tsunamis, which can pose significant risks to life and property.
Seasonal Changes: Consider the length and severity of different seasons, as well as the potential for seasonal affective disorder (SAD) in areas with limited daylight hours during the winter.
Outdoor Activities: Think about the types of outdoor activities that are important to you and whether the climate and weather conditions in a particular location will allow you to enjoy them year-round.
Extreme Heat and Dehydration Prolonged exposure to high temperatures can lead to heat-related illnesses like heat exhaustion and heat stroke. As your body works harder to cool itself down, you lose fluids through sweating which can result in dehydration if those fluids are not replaced. Symptoms of dehydration include thirst, fatigue, dizziness, and dark urine. To prevent dehydration in hot weather:
Drink plenty of water and electrolyte-rich fluids, especially if you’re active outdoors
Take frequent breaks in the shade or air conditioning
Wear light, loose-fitting clothing
Avoid strenuous activity during the hottest parts of the day
Cold Temperatures and Heart Health Cold weather can be hard on your heart. When temperatures drop, your blood vessels constrict to conserve heat, which increases blood pressure. This extra strain on the cardiovascular system may trigger a heart attack, especially in people with pre-existing heart disease. To protect your heart in the cold:
Bundle up in warm layers before going outside
Avoid sudden exertion, like shoveling snow, without warming up first
Talk to your doctor about safe activity levels if you have a heart condition
Know the warning signs of a heart attack and seek emergency care if needed
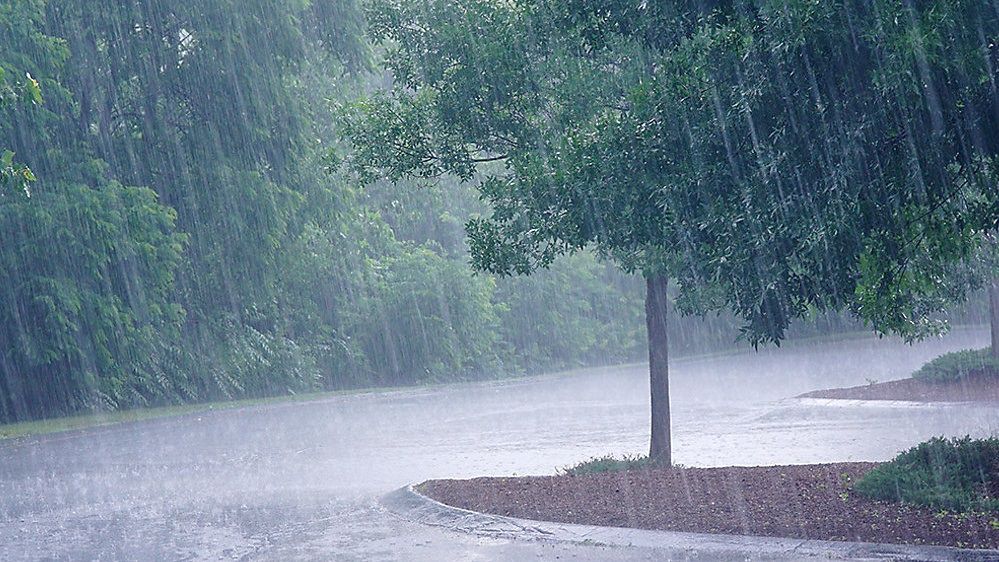
Thunderstorms and Asthma Attacks Changes in humidity, temperature, and barometric pressure during a thunderstorm can cause asthma attacks in some people. Experts believe this “thunderstorm asthma” occurs when strong winds disperse high concentrations of pollen and mold spores in the air. Breathing in these irritants inflames the airways and makes it difficult to breathe. If you have asthma:
Stay indoors with the windows closed during a thunderstorm
Use your preventive medications as prescribed
Keep your rescue inhaler with you at all times
Seek medical help if your symptoms worsen or don’t improve with treatment
Rainy Days and Joint Pain Many people with arthritis report increased joint pain and stiffness when it rains. One theory is that a drop in barometric pressure causes the tissues around the joints to swell and press on nerves. While there’s no surefire way to prevent weather-related joint pain, these strategies may help:
Stay warm and dry
Use heat therapy to relax muscles and ease stiffness
Try gentle range-of-motion exercises to keep joints flexible
Take over-the-counter pain relievers as needed
Talk to your doctor about adjusting your medication regimen
Dry Air and Respiratory Infections Cold, dry air can irritate the respiratory tract and make you more susceptible to infections like the common cold and flu. Low humidity dries out the protective mucous membranes in your nose and throat, making it easier for viruses to invade. To combat dry air:
Use a humidifier to add moisture to your home or office
Stay hydrated by drinking plenty of fluids
Practice good hand hygiene to avoid picking up germs
Get your annual flu vaccine
See your doctor if you develop severe symptoms
Sunny Days and Skin Cancer Risk While some sun exposure is necessary for vitamin D production, too much UV radiation can damage your skin and increase your risk of skin cancer. This risk is highest during the summer months when the sun’s rays are most intense. To protect your skin:
Use a broad-spectrum sunscreen with an SPF of at least 30 every day
Wear protective clothing, like long sleeves, pants, and a wide-brimmed hat
Seek shade during peak sun hours (10 a.m. to 4 p.m.)
Check your skin regularly for new or changing moles
See a dermatologist for an annual skin exam
Extreme Weather and Mental Health Severe weather events like hurricanes, tornadoes, and floods can take a toll on mental health. The stress of dealing with property damage, displacement, and financial losses can lead to anxiety, depression, and post-traumatic stress disorder (PTSD). If you’re struggling after a natural disaster:
Reach out to loved ones for support
Stick to a routine as much as possible
Engage in healthy coping mechanisms like exercise and journaling
Seek professional help if your symptoms are severe or persistent
Call a crisis hotline if you’re having thoughts of self-harm
Air Pollution and Cognitive Function Exposure to air pollution has been linked to a decline in cognitive function, particularly in older adults. Fine particulate matter can enter the bloodstream and cause inflammation throughout the body, including the brain. Over time, this may contribute to the development of dementia and Alzheimer’s disease. To reduce your exposure to air pollution:
Check the air quality index before going outside
Limit outdoor activities on high pollution days
Use an air purifier with a HEPA filter indoors
Support policies that reduce emissions from vehicles and industry
Talk to your doctor if you have concerns about your cognitive health
Seasonal Allergies and Quality of Life For many people, the arrival of spring means the start of allergy season. Pollen from trees, grasses, and weeds can trigger symptoms like sneezing, runny nose, and itchy eyes. While not usually life-threatening, allergies can significantly impact quality of life and lead to missed work or school days. To manage seasonal allergies:
Keep windows and doors closed to keep pollen out
Shower and change clothes after being outdoors
Use an over-the-counter antihistamine or nasal spray as needed
Consider immunotherapy (allergy shots) for long-term relief
See an allergist for personalized treatment recommendations
Climate Change and Global Health The effects of climate change on human health are far-reaching and complex. Rising temperatures, more frequent natural disasters, and changes in disease patterns pose serious risks to public health. Vulnerable populations, such as the elderly, children, and those with chronic illnesses, are particularly at risk. To mitigate the health impacts of climate change:
Support policies that reduce greenhouse gas emissions
Prepare for extreme weather events with an emergency plan and supply kit
Stay informed about local health risks and advisories
Take steps to reduce your own carbon footprint
Advocate for equitable access to healthcare and resources
The Earth’s weather can be both fascinating and terrifying, with extreme conditions that push the boundaries of our imagination. From scorching heat to bone-chilling cold, here are 10 insane weather records that you won’t believe are real.
Highest Temperature: 56.7°C (134°F) – Death Valley, California, USA On July 10, 1913, the Furnace Creek Ranch in Death Valley recorded a blistering temperature of 56.7°C (134°F), which remains the highest officially recorded temperature on Earth. This record has been the subject of some debate, but it still stands as the hottest temperature ever measured.
Lowest Temperature: -89.2°C (-128.6°F) – Vostok Station, Antarctica On July 21, 1983, the Vostok Station in Antarctica recorded an astonishing temperature of -89.2°C (-128.6°F), making it the coldest temperature ever recorded on Earth. This record was measured using ground-based thermometers and has been verified by satellite data.
Highest Rainfall in One Minute: 38 mm (1.5 inches) – Barot, Guadeloupe On November 26, 1970, the town of Barot in Guadeloupe experienced an incredible 38 mm (1.5 inches) of rainfall in just one minute. This record-breaking downpour is the result of the town’s unique topography and its location in the path of frequent tropical storms.
Highest Rainfall in 24 Hours: 1,825 mm (71.8 inches) – Foc-Foc, La Réunion From January 7-8, 1966, the village of Foc-Foc on the island of La Réunion was drenched with an astounding 1,825 mm (71.8 inches) of rainfall in just 24 hours. This record-shattering event was caused by the island’s steep topography and its location in the path of powerful tropical cyclones.
Longest Lightning Bolt: 768 km (477 miles) – Oklahoma to Mississippi, USA On April 29, 2020, a lightning bolt stretched an incredible 768 km (477 miles) from southeast Oklahoma to southwest Mississippi in the United States. This record-breaking lightning bolt was detected by the National Oceanic and Atmospheric Administration’s Geostationary Lightning Mapper and confirmed by the World Meteorological Organization.
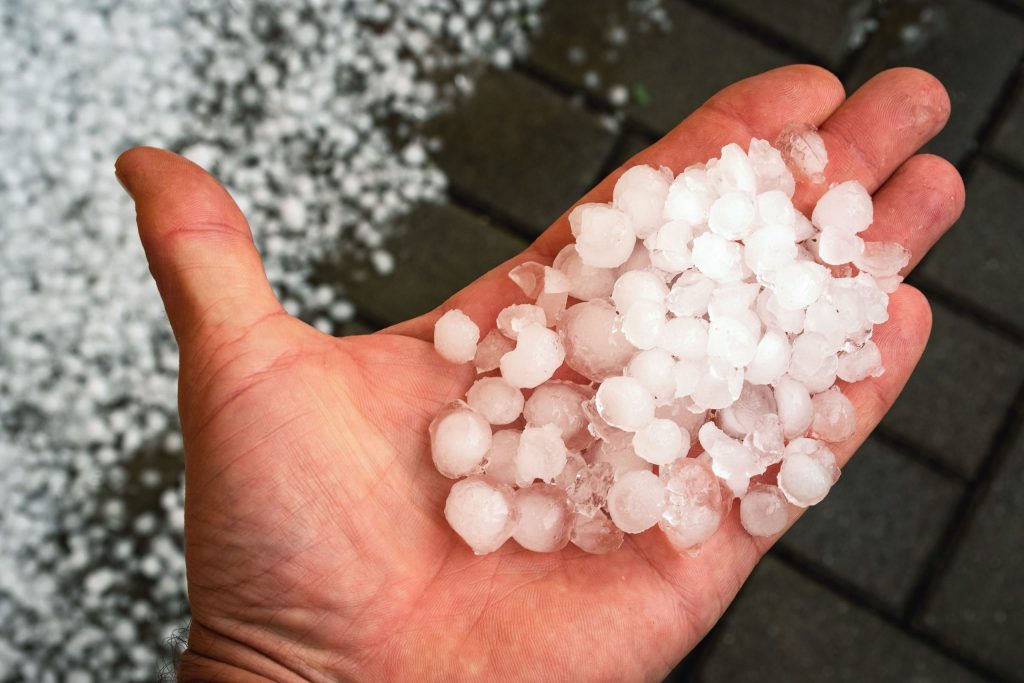
Largest Hailstone: 20.3 cm (8 inches) in diameter – Vivian, South Dakota, USA On July 23, 2010, a massive hailstone measuring 20.3 cm (8 inches) in diameter and weighing 0.88 kg (1.94 pounds) fell in Vivian, South Dakota. This record-breaking hailstone had a circumference of 47.6 cm (18.75 inches) and is the largest officially recorded hailstone in terms of diameter and weight.
Highest Wind Speed: 408 km/h (253 mph) – Barrow Island, Australia On April 10, 1996, during Tropical Cyclone Olivia, an unmanned weather station on Barrow Island off the coast of Western Australia recorded a gust of wind at 408 km/h (253 mph). This is the highest wind speed ever recorded on Earth, although the measurement is somewhat controversial due to the equipment used.
Longest Dry Period: 173 months – Arica, Chile The city of Arica in northern Chile holds the record for the longest dry period, with no measurable rainfall from October 1903 to January 1918—a total of 173 months (over 14 years). This extreme dry spell is a result of Arica’s location in the Atacama Desert, one of the driest places on Earth.
Highest Atmospheric Pressure: 1,085.7 hPa (32.06 inHg) – Tosontsengel, Mongolia On December 19, 2001, the weather station in Tosontsengel, Mongolia, recorded an atmospheric pressure of 1,085.7 hPa (32.06 inHg). This is the highest atmospheric pressure ever recorded at sea level, and it occurred during a period of intense cold in the region.
Lowest Atmospheric Pressure: 870 hPa (25.69 inHg) – Typhoon Tip, Pacific Ocean On October 12, 1979, during the peak intensity of Typhoon Tip in the western Pacific Ocean, a reconnaissance aircraft measured a record-low atmospheric pressure of 870 hPa (25.69 inHg) at sea level. Typhoon Tip is also the largest tropical cyclone on record, with a diameter of approximately 2,220 km (1,380 miles).
These insane weather records showcase the incredible power and variability of Earth’s atmosphere, reminding us of the awe-inspiring forces of nature that shape our planet.
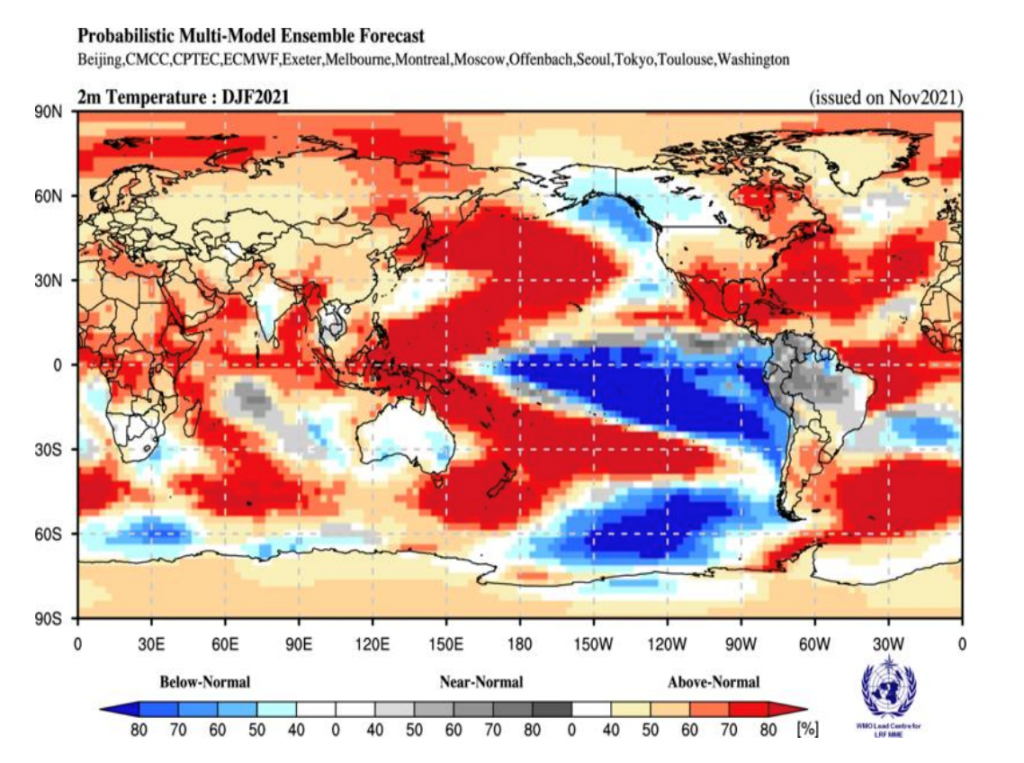
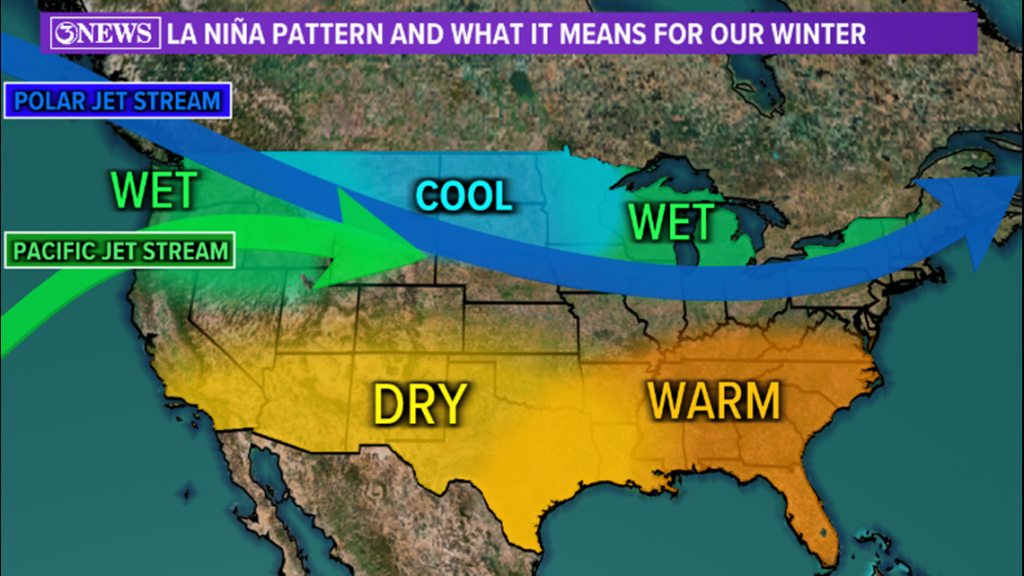
La Niña, a complex weather phenomenon, has a significant impact on the climate and weather patterns across the United States. This naturally occurring event is characterized by the cooling of the surface waters in the eastern equatorial Pacific Ocean, which alters atmospheric circulation and influences temperature and precipitation patterns worldwide.
According to the National Oceanic and Atmospheric Administration (NOAA), during a La Niña event, the jet stream tends to shift northward, causing changes in the distribution of temperature and precipitation across the country. This shift often results in below-average temperatures and above-average precipitation in the northern parts of the United States, while the southern states experience warmer and drier conditions.
The Pacific Northwest and the northern Rockies are particularly affected by La Niña. These regions often experience colder temperatures and increased snowfall during the winter months. In fact, the NOAA Climate Prediction Center’s data suggests that during a La Niña winter, the chances of above-average snowfall in the Cascades and the northern Rockies can increase by as much as 40%.
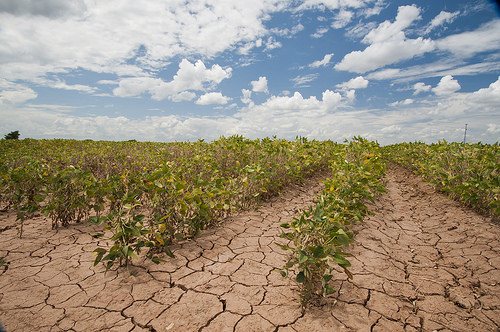
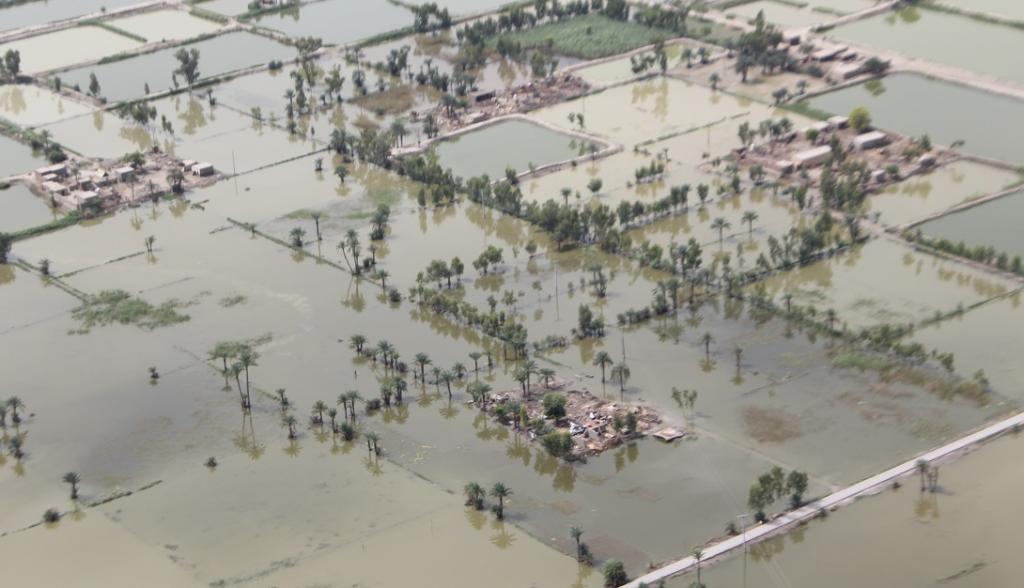
On the other hand, the southern states, particularly the Southwest and the Gulf Coast, tend to experience warmer and drier conditions during a La Niña event. This can lead to an increased risk of drought and wildfires in these regions. In the winter of 2020-2021, which was influenced by a moderate La Niña, the U.S. Drought Monitor reported that over 40% of the contiguous United States experienced some level of drought, with the most severe conditions in the Southwest and the Great Plains.
La Niña’s impact on the Atlantic hurricane season is also noteworthy. During a La Niña year, the atmospheric conditions in the Atlantic basin become more conducive to hurricane formation. Reduced wind shear and increased atmospheric instability allow tropical storms to develop and intensify more easily. The NOAA reported that the 2020 Atlantic hurricane season, which coincided with a La Niña event, was the most active on record, with 30 named storms, 13 of which became hurricanes.
La Niña 2010-2011: This was a strong La Niña event. Its impacts included increased rainfall in the western Pacific, leading to floods in Australia, Indonesia, and the Philippines. Conversely, it brought drought conditions to parts of Africa and South America.
La Niña 2011-2012: Following the previous event, this one was weaker but still brought heavy rainfall to parts of Australia, contributing to flooding in Queensland. It also influenced weather patterns in the Americas, affecting rainfall in regions such as the southern United States.
La Niña 2016-2017: This was another strong La Niña episode. It caused wetter-than-average conditions in parts of Southeast Asia and Australia, contributing to flooding. It also influenced global temperature patterns, with cooler-than-average temperatures in some regions.
La Niña 2020-2021: This event began in late 2020 and continued into early 2021. It contributed to above-average rainfall in parts of Southeast Asia, leading to flooding in Indonesia and the Philippines. It also influenced weather patterns in the Americas, affecting precipitation in regions such as the southwestern United States and South America.
La Niña 2007-2008: This was a moderate La Niña event. It caused above-average rainfall in parts of Southeast Asia, leading to flooding in Indonesia and Malaysia. Australia also experienced wetter-than-average conditions during this period.
La Niña 2017-2018: Following the 2016-2017 La Niña event, this one was weaker but still had notable impacts. It influenced weather patterns in various regions, including increased rainfall in parts of South America, contributing to flooding in Peru and Colombia.
La Niña 2021-2022: This event began in late 2021 and continued into 2022. It brought above-average rainfall to parts of Southeast Asia, contributing to flooding in Indonesia and Malaysia. Australia also experienced wetter conditions during this period.
La Niña 2022-2023: This event occurred in the latter part of 2022 and extended into 2023. It had varying impacts globally, with some regions experiencing above-average rainfall and others facing drier conditions. For example, parts of South America and the southern United States saw increased precipitation, while parts of Africa and the Middle East experienced drier-than-average conditions.
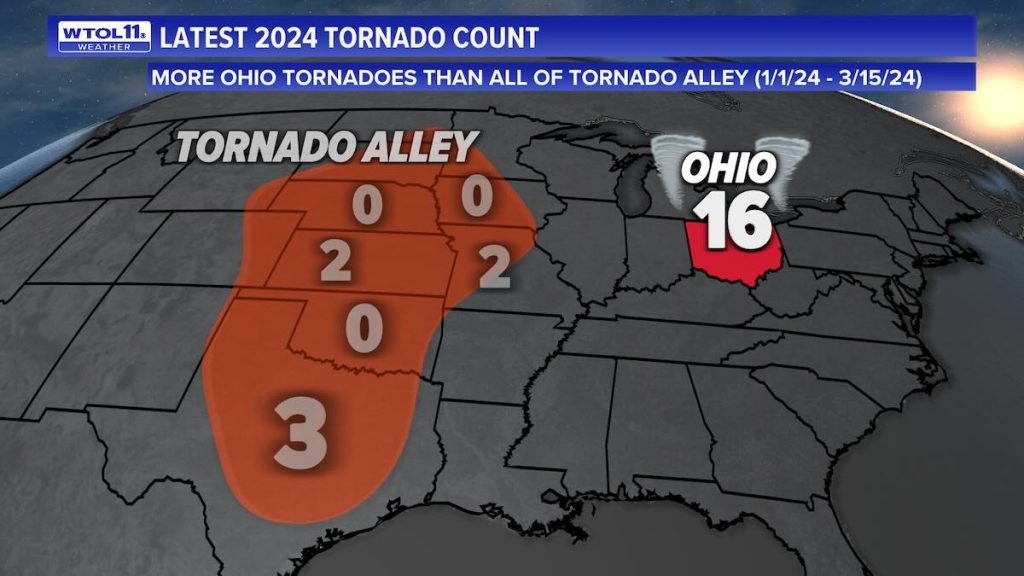
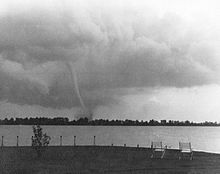
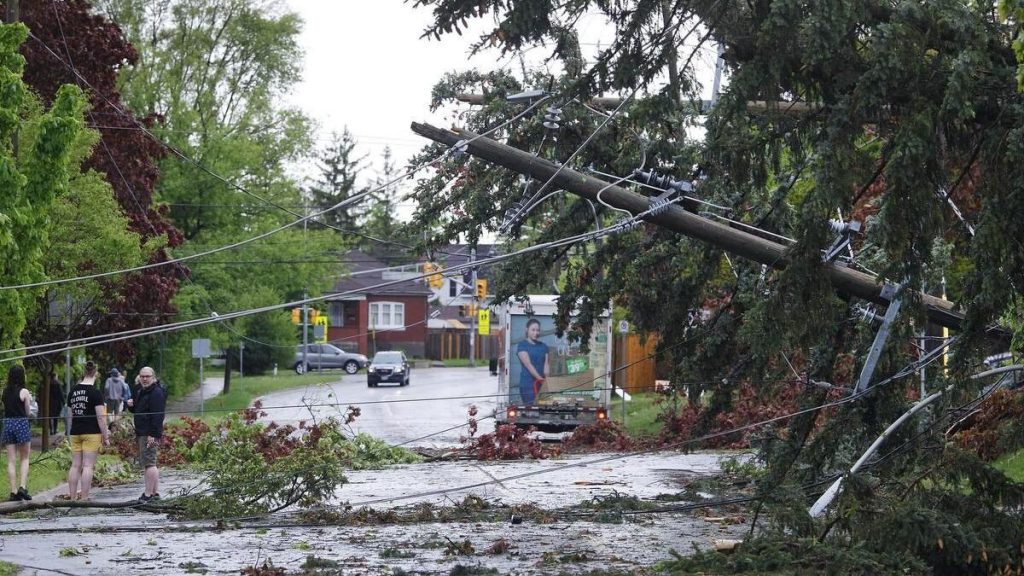
Canada, known for its diverse landscapes and vast expanses, is also home to a unique meteorological phenomenon – severe thunderstorms and tornadoes. While storm chasing is more commonly associated with the United States, particularly in the infamous “Tornado Alley,” Canada experiences its fair share of severe weather events, attracting both professional meteorologists and amateur storm chasers.
Meteorology Behind Canadian Storm Chasing The formation of severe thunderstorms and tornadoes in Canada is primarily influenced by the collision of contrasting air masses. During the summer months, warm, moist air from the Gulf of Mexico and the United States Great Plains often clashes with cooler, drier air from the Arctic. This collision creates instability in the atmosphere, leading to the development of powerful supercell thunderstorms.
Additionally, Canada’s unique topography plays a role in storm formation. The prairies, with their flat, open landscapes, allow for uninterrupted wind flow and the creation of strong updrafts necessary for tornado development. The presence of the Rocky Mountains to the west also contributes to the formation of severe weather, as the mountains can help channel and intensify storm systems.
Prime Storm Chasing Locations in Canada
Southern Ontario: This region, particularly the area extending from Windsor to Toronto, experiences the highest frequency of tornadoes in Canada. The proximity to the Great Lakes and the convergence of air masses make this area a hotspot for severe weather.
Alberta: Known as “Hailstorm Alley,” central and southern Alberta often experience severe thunderstorms capable of producing large hail, damaging winds, and occasional tornadoes. Cities like Calgary and Red Deer are prime locations for storm chasers.
Saskatchewan: The southern portions of Saskatchewan, especially along the border with the United States, are prone to severe thunderstorms and tornadoes. The flat, open prairies provide an ideal environment for storm development.
Manitoba: Similar to Saskatchewan, southern Manitoba experiences severe weather due to its location and topography. The Red River Valley, in particular, is a corridor for intense storm systems.
Tornado Statistics by Province According to Environment and Climate Change Canada, the average number of reported tornadoes per year in each province is as follows:
Ontario: 12-18
Alberta: 10-15
Saskatchewan: 8-12
Manitoba: 6-10
Quebec: 4-8
New Brunswick: 1-2
British Columbia: 0-1
Nova Scotia: 0-1
Prince Edward Island: 0-1
Newfoundland and Labrador: 0-1
It is important to note that these numbers are based on reported tornadoes and may not reflect the actual occurrence, as some tornadoes in remote areas may go undetected.
Storm chasing in Canada is a thrilling and scientifically valuable pursuit, but it also comes with inherent risks. Chasers must be well-prepared, equipped with proper safety gear, and knowledgeable about severe weather dynamics. It is crucial to respect the power of nature and prioritize personal safety above all else.
As climate change continues to influence weather patterns worldwide, studying severe weather events in Canada becomes increasingly important.
Top 5 Weather Events in Canada
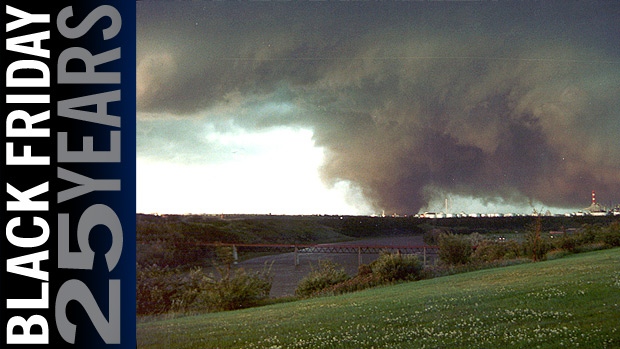
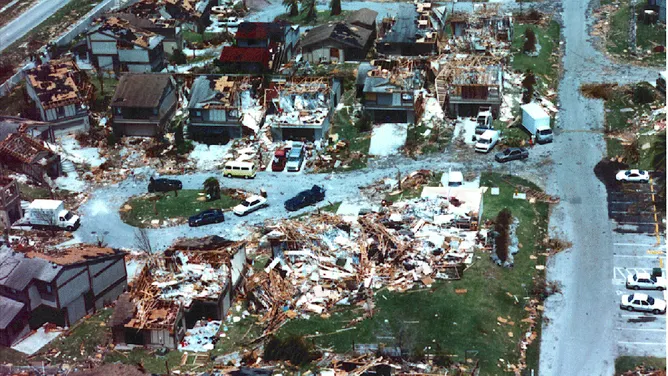
Edmonton Tornado (July 31, 1987) Also known as “Black Friday,” this devastating F4 tornado struck eastern Edmonton, Alberta, causing 27 fatalities, injuring over 300 people, and resulting in an estimated $330 million in damages (adjusted for inflation). It remains the deadliest tornado in Canadian history and one of the most destructive in terms of property damage.
Pine Lake Tornado (July 14, 2000) An F3 tornado touched down near Pine Lake, a popular camping area in central Alberta, claiming 12 lives and injuring over 100 people. The tornado caused widespread damage to the Green Acres Campground, destroying numerous trailers and vehicles. It is the second-deadliest tornado in Canadian history.
Windsor – Tecumseh, Ontario Tornado (June 17, 1946) This powerful F4 tornado struck the towns of Windsor and Tecumseh in southwestern Ontario, causing 17 fatalities and over 200 injuries. It remains the third-deadliest tornado in Canadian history and caused significant damage to residential areas and infrastructure.
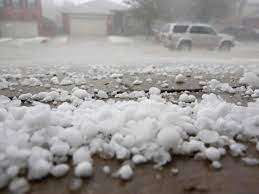
Calgary Hailstorm (June 13, 2020) A severe thunderstorm produced large hail over Calgary, Alberta, causing an estimated $1.2 billion in insured damages, making it the fourth-costliest natural disaster in Canadian history. The hailstorm damaged numerous homes, vehicles, and buildings across the city.
Southern Ontario Derecho (May 21, 2022) A powerful derecho, a widespread and long-lived windstorm associated with a line of severe thunderstorms, swept across southern Ontario, causing significant damage and power outages. The storm resulted in 10 fatalities and affected major cities such as Toronto, Ottawa, and London. Wind gusts exceeding 120 km/h were recorded, and the event is considered one of the most impactful derechos in Canadian history.
Well-known Storm Chasers in Canada:
Mark Robinson: A meteorologist and storm chaser based in Ontario, Robinson is the founder of The Weather Network’s “Storm Hunters” team. He has been chasing storms across Canada and the United States for over two decades.
Greg Johnson: Known as “Tornado Hunter,” Johnson is a Saskatchewan-based storm chaser and photographer who has been documenting severe weather events for more than 20 years. His work has been featured in numerous publications and documentaries.
Justin Hobson: A storm chaser and photographer based in Alberta, Hobson is known for his stunning images of severe weather events across the Canadian Prairies.
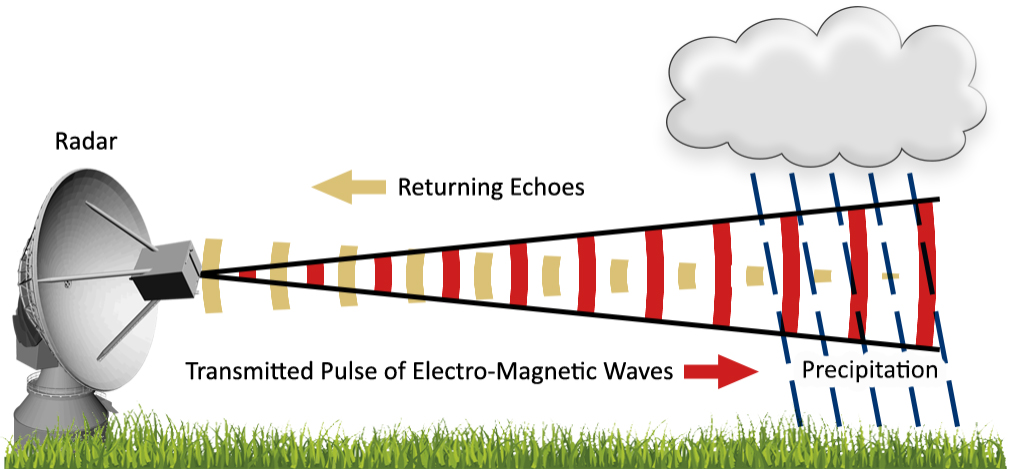
Weather Radar Network and Forecast Models: Environment and Climate Change Canada (ECCC) operates the Canadian weather radar network, which consists of 31 Doppler radars across the country. These radars provide real-time data on precipitation intensity, wind velocity, and storm structure, aiding in the detection and tracking of severe weather events. ECCC also utilizes several forecast models to predict weather patterns and severe weather potential:
Global Environmental Multiscale (GEM) Model: This is the primary forecast model used by ECCC, providing short-range and medium-range weather forecasts for Canada and the world. High Resolution Deterministic Prediction System (HRDPS): A high-resolution model that provides detailed short-range forecasts for specific regions in Canada, focusing on severe weather events. Canadian Precipitation Analysis (CaPA): A system that combines radar, satellite, and surface observations to provide a comprehensive analysis of precipitation across Canada.
Links:
Environment and Climate Change Canada Weather Radar: https://weather.gc.ca/radar/index_e.html Canadian Centre for Meteorological and Environmental Prediction: https://weather.gc.ca/ensemble/index_e.html The Weather Network Storm Hunters: https://www.theweathernetwork.com/ca/news/storm-hunters Greg Johnson Tornado Hunter: https://tornadohunter.com/ Justin Hobson Photography: https://justinhobson.ca/
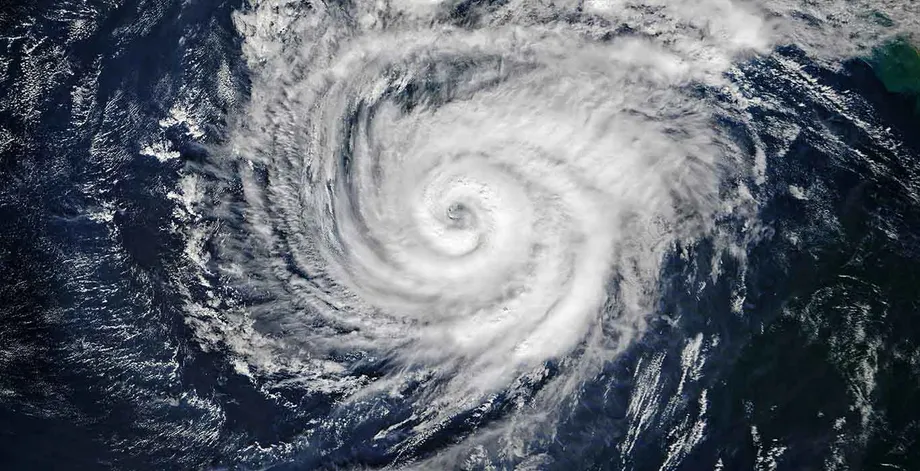
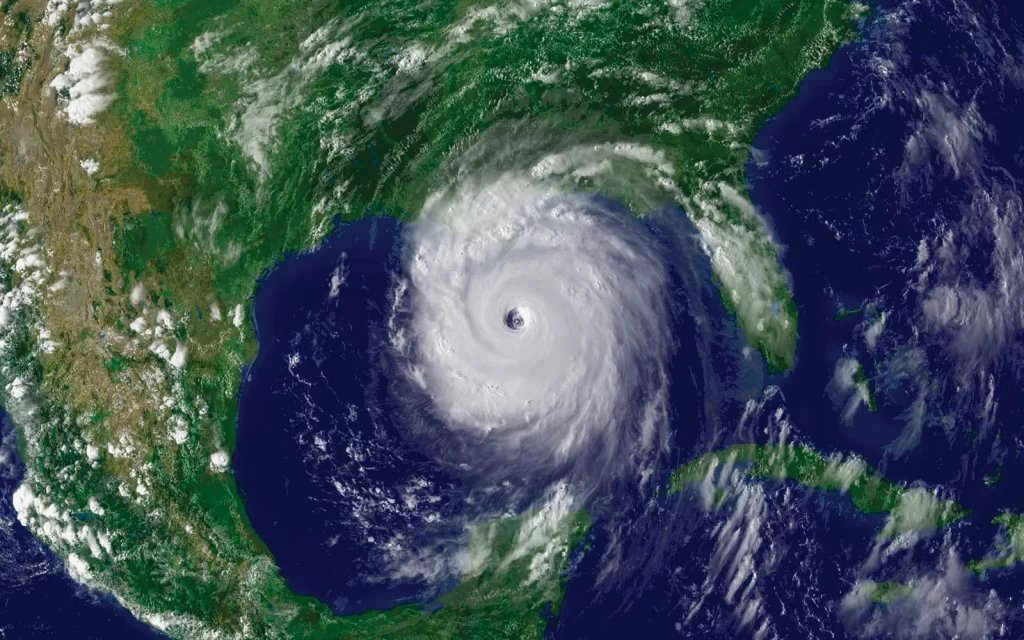
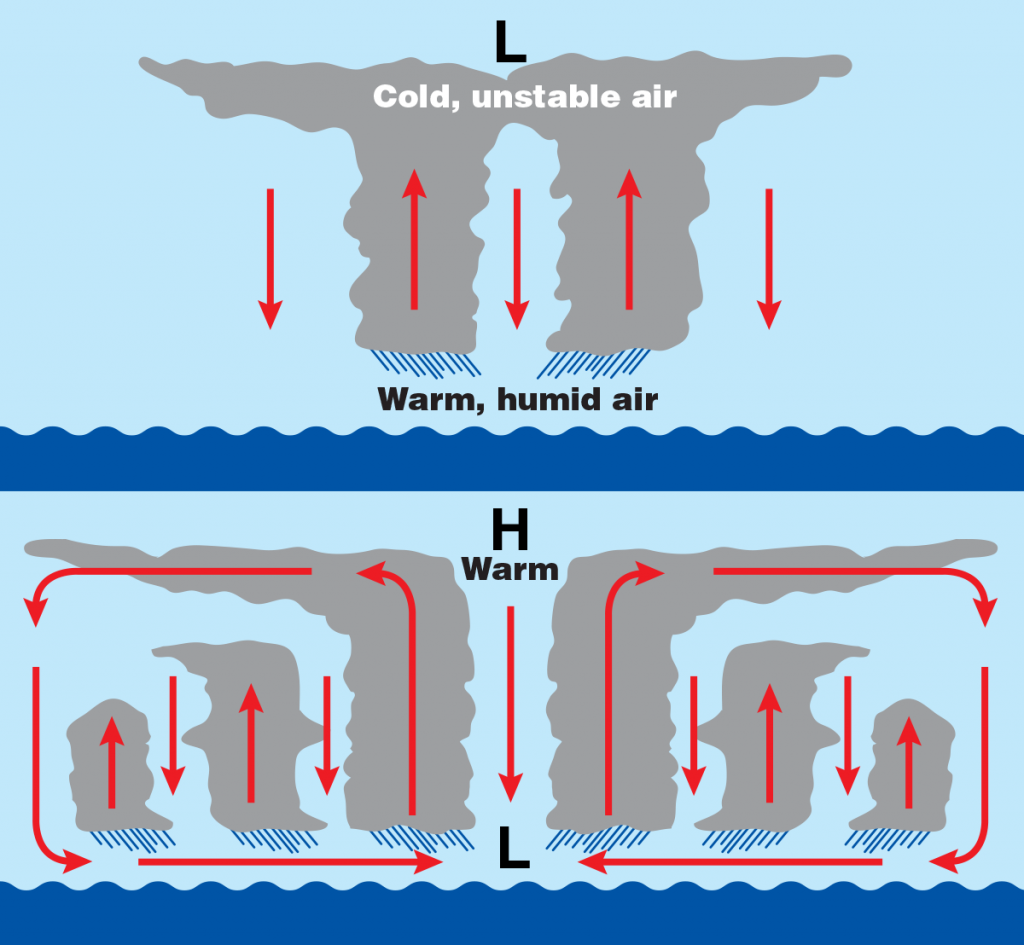
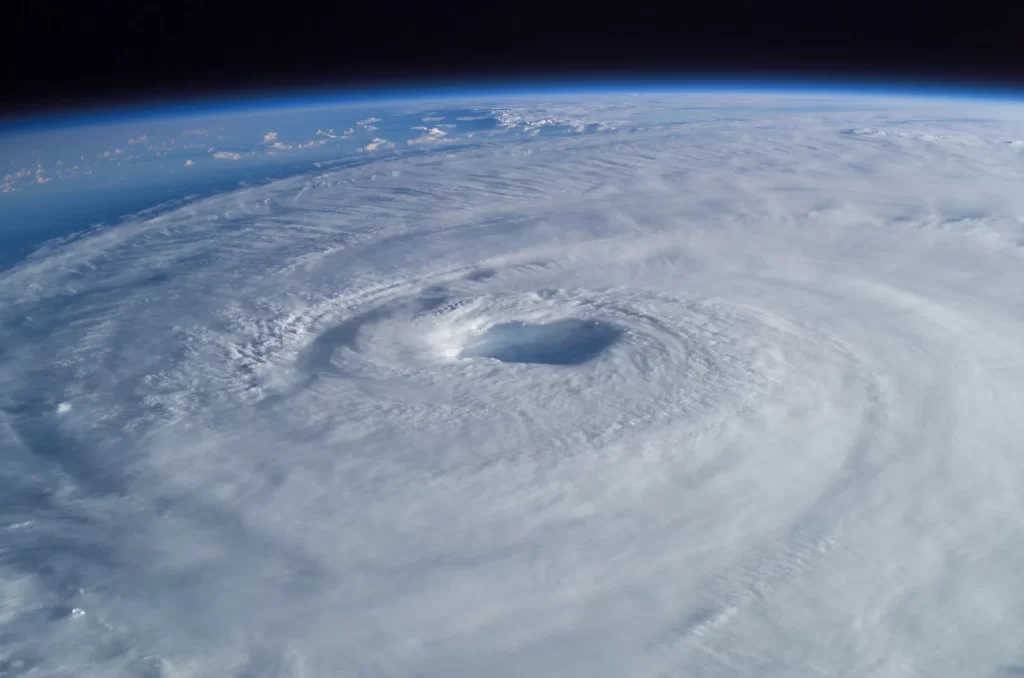
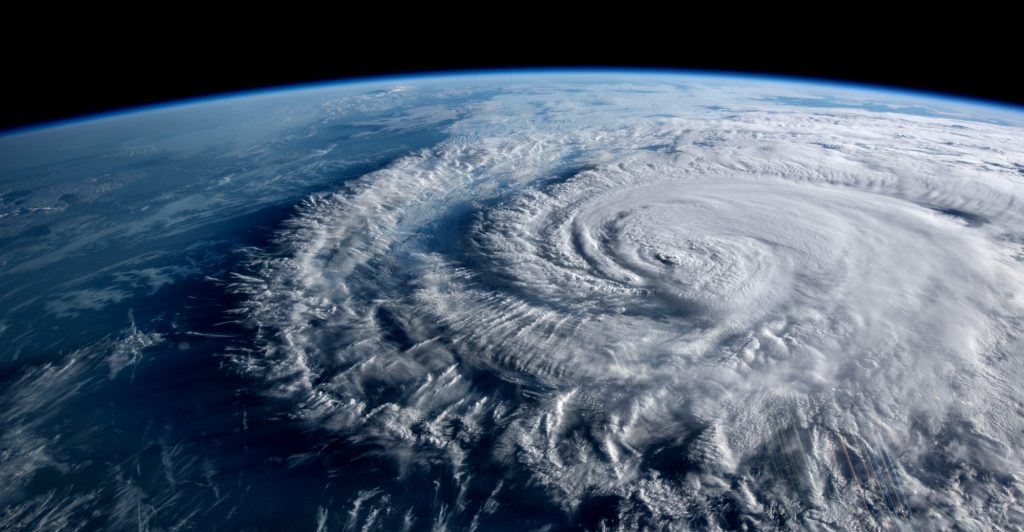
1.1 What is a hurricane? A hurricane is a type of tropical cyclone, which is a rotating, organized system of clouds and thunderstorms that originates over tropical or subtropical waters. Hurricanes are characterized by a low-pressure center, high winds, and heavy rainfall. In the North Atlantic Ocean, Caribbean Sea, and the eastern North Pacific Ocean, these storms are called hurricanes. In other parts of the world, they may be referred to as typhoons or tropical cyclones, depending on their location.
1.2 How do hurricanes form? Hurricanes form when specific atmospheric and oceanic conditions are met. The key factors that contribute to hurricane formation include: a. Warm ocean water (at least 26.5°C or 79.7°F) to a depth of about 50 meters b. Atmospheric instability, which allows the warm, moist air to rise and form thunderstorms c. Sufficient Coriolis force, which causes the storm to rotate (this force is minimal near the equator) d. A pre-existing disturbance, such as a tropical wave or a low-pressure system e. Low wind shear, which allows the storm to maintain its vertical structure
When these conditions are present, the warm, moist air rises, creating an area of low pressure near the surface. As the air continues to rise, it cools and condenses, forming clouds and thunderstorms. The rotation of the Earth and the Coriolis force cause the storm to spin, and as the system becomes more organized, it can intensify into a tropical depression, tropical storm, or hurricane.
1.3 The life cycle of a hurricane Hurricanes typically go through four stages of development: a. Tropical disturbance: An area of low pressure with thunderstorms, but no organized circulation b. Tropical depression: A low-pressure system with sustained winds of up to 38 mph (61 km/h) c. Tropical storm: A more organized system with sustained winds between 39 and 73 mph (63 to 118 km/h) d. Hurricane: A well-defined, rotating storm with sustained winds of 74 mph (119 km/h) or higher
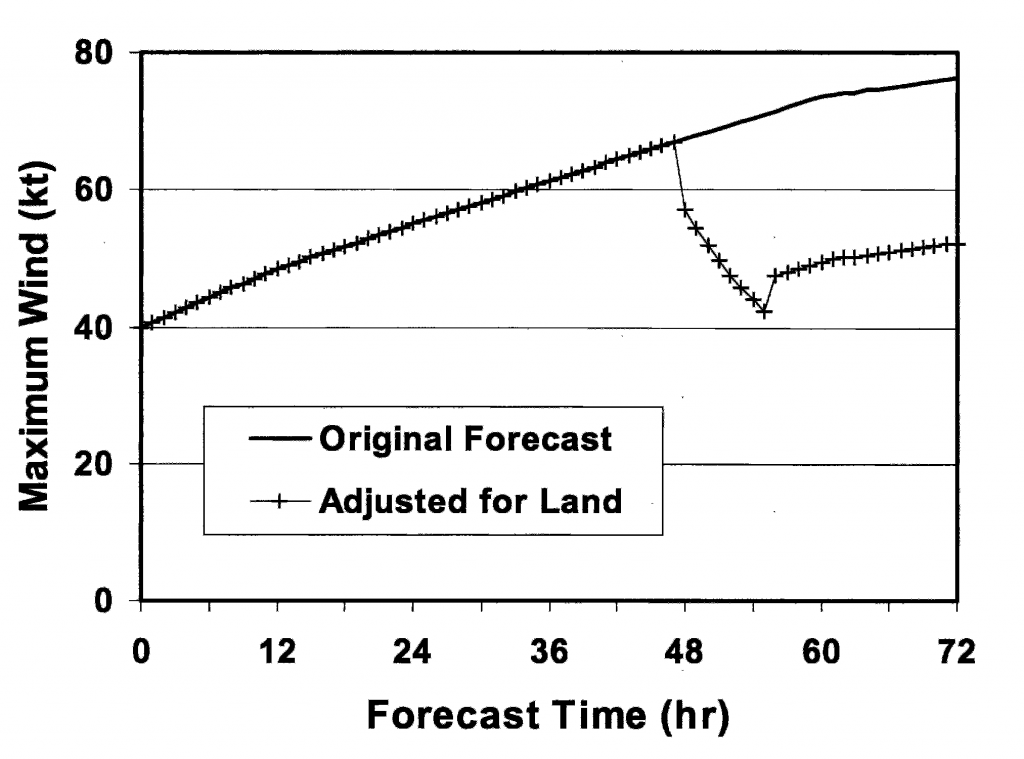
Once a hurricane makes landfall or moves over cooler waters, it begins to weaken and eventually dissipates.
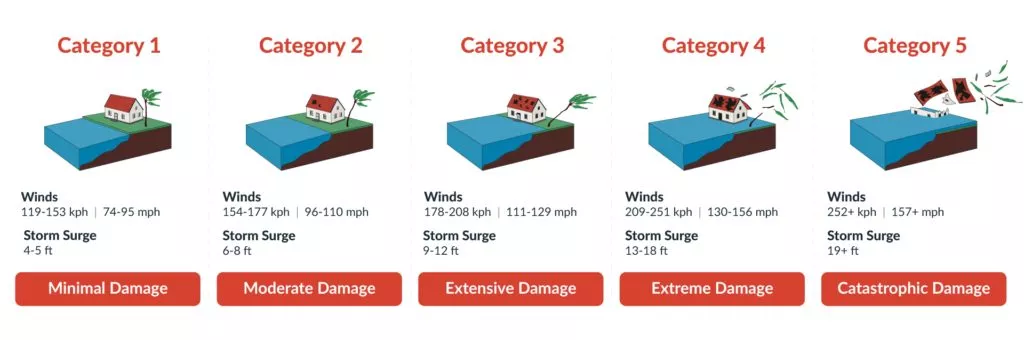
1.4 Categories of hurricane intensity Hurricanes are classified into five categories based on their maximum sustained wind speeds, using the Saffir-Simpson Hurricane Wind Scale:
Category 1: 74-95 mph (119-153 km/h)
Category 2: 96-110 mph (154-177 km/h)
Category 3: 111-129 mph (178-208 km/h)
Category 4: 130-156 mph (209-251 km/h)
Category 5: 157 mph (252 km/h) or higher
It is important to note that the Saffir-Simpson scale only measures wind speed and does not account for the potential damage caused by storm surge, rainfall, or other factors. Lower-category hurricanes can still cause significant damage and loss of life, particularly due to flooding and storm surge.
Part 2: Data Collection and Analysis
2.1 Observing and measuring hurricanes To accurately forecast hurricanes, scientists rely on various data collection methods to observe and measure the storms’ characteristics and the surrounding environment. The main tools used for this purpose are:
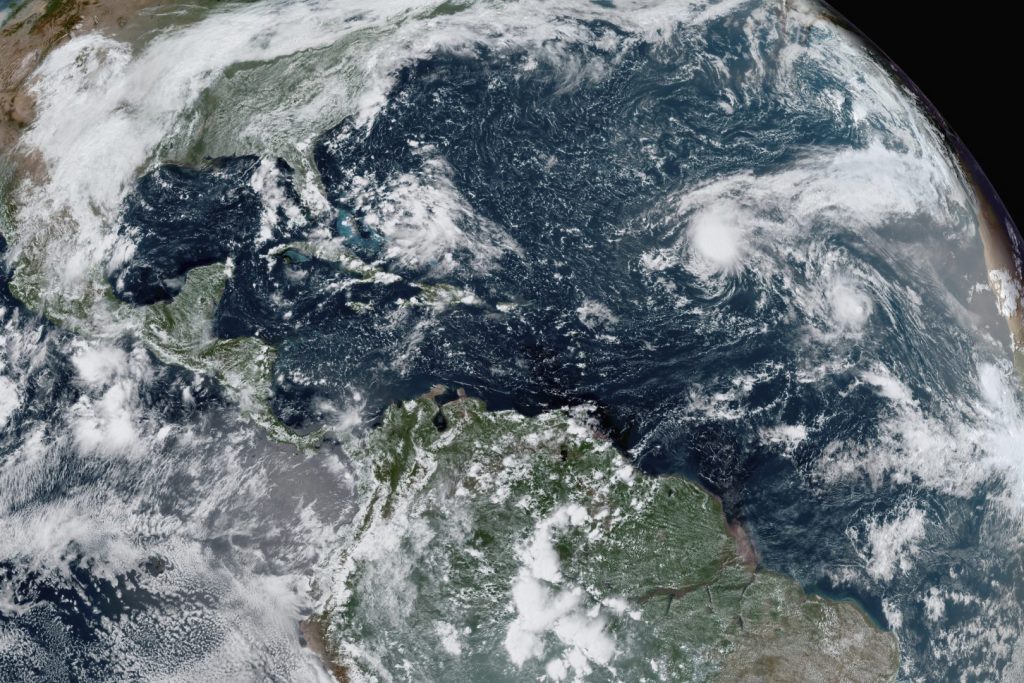
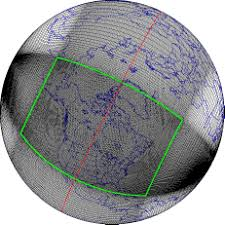
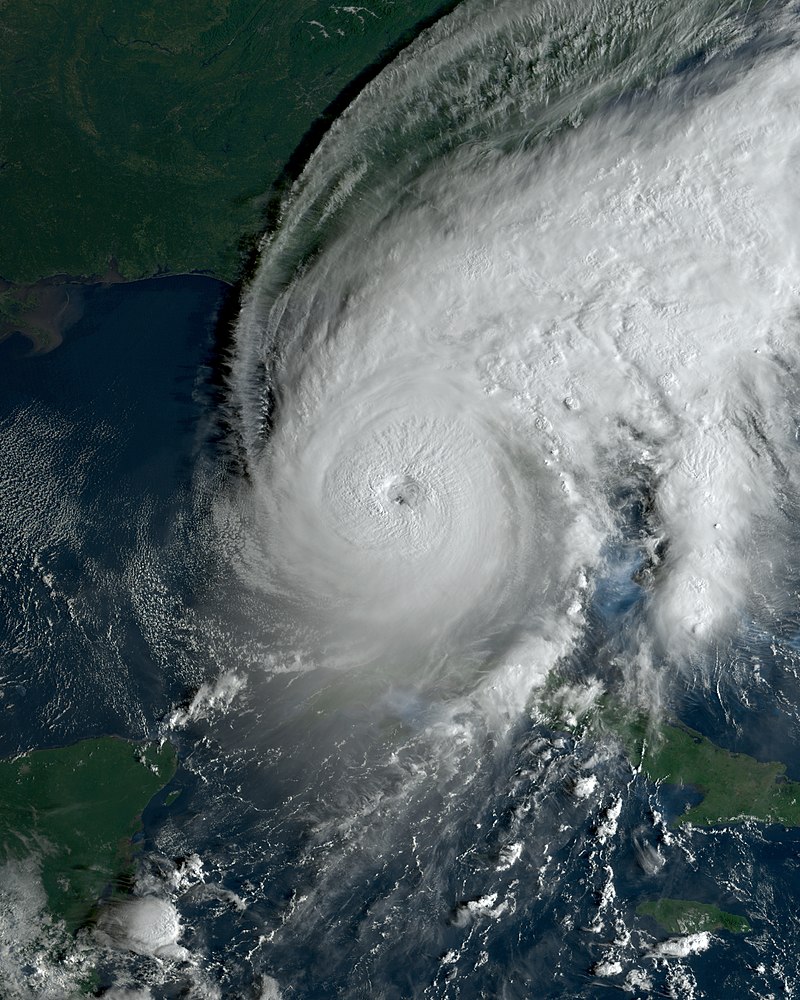
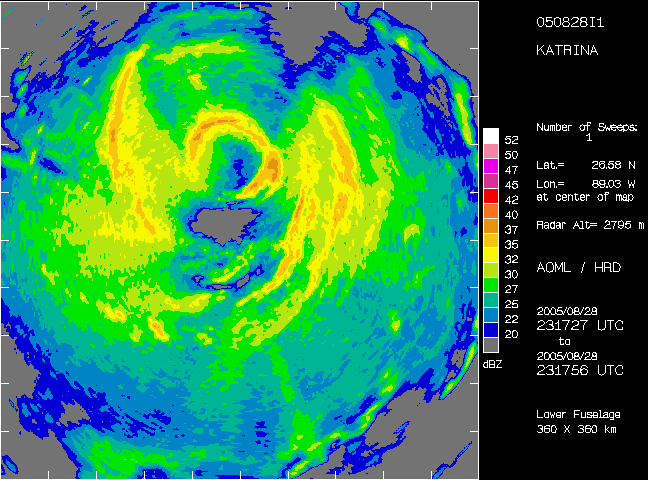
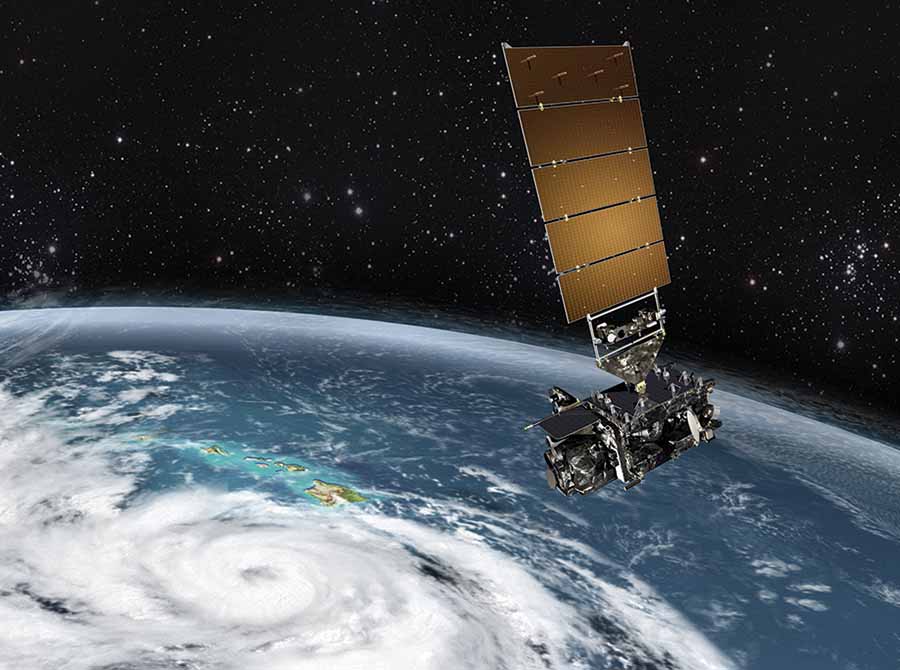
2.1.1 Satellite imagery Satellites provide a comprehensive view of hurricanes from space, allowing forecasters to monitor their development, track their movement, and estimate their intensity. Visible and infrared satellite images help identify the storm’s structure, size, and cloud patterns. Microwave imagery can penetrate through clouds, providing information about the storm’s internal structure and rainfall rates.
2.1.2 Aircraft reconnaissance Specially equipped aircraft, such as the U.S. Air Force Reserve’s Hurricane Hunters, fly directly into hurricanes to collect valuable data. These aircraft measure wind speed, air pressure, temperature, and humidity at various altitudes within and around the storm. They also deploy instruments called dropsondes, which measure atmospheric conditions as they descend to the ocean surface.
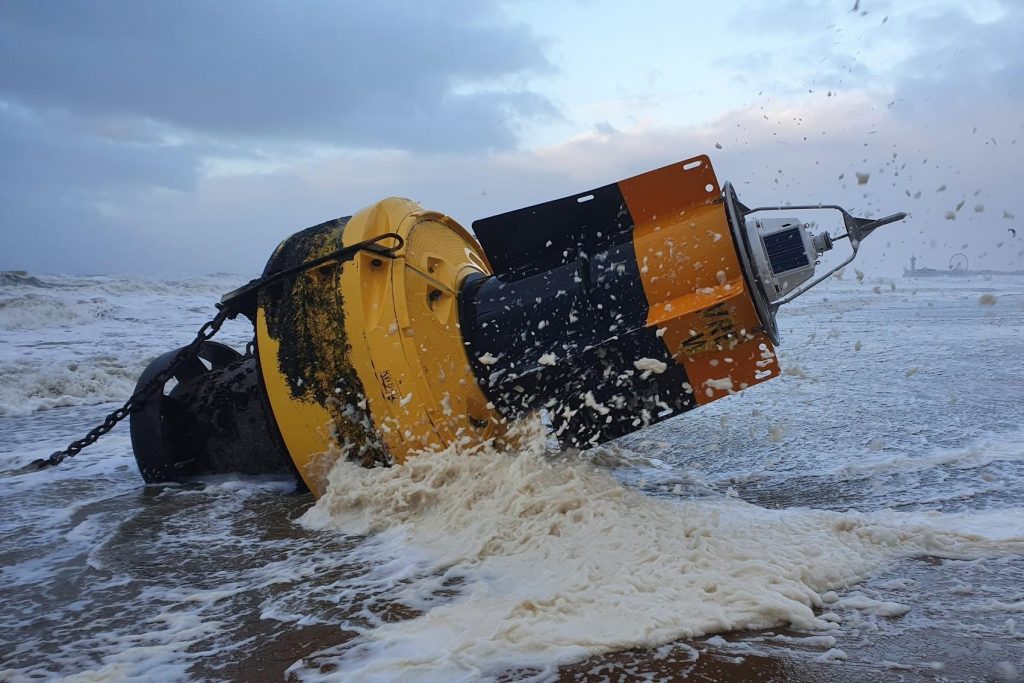
2.1.3 Buoys and weather stations Buoys and weather stations in the ocean and on land provide essential data about surface conditions, such as wind speed, air pressure, and sea surface temperature. These measurements help forecasters understand the storm’s interaction with its environment and assess its potential for intensification.
2.2 Analyzing atmospheric and oceanic conditions In addition to directly observing hurricanes, forecasters analyze various atmospheric and oceanic conditions that influence hurricane development and behavior. Some of the key factors considered are:
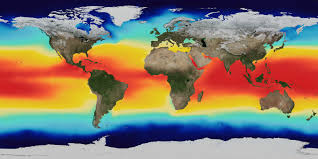
2.2.1 Sea surface temperature Warm ocean water, typically above 26.5°C (79.7°F), is essential for hurricane formation and intensification. Forecasters monitor sea surface temperatures using satellite data and buoy measurements to identify areas that are conducive to hurricane development.
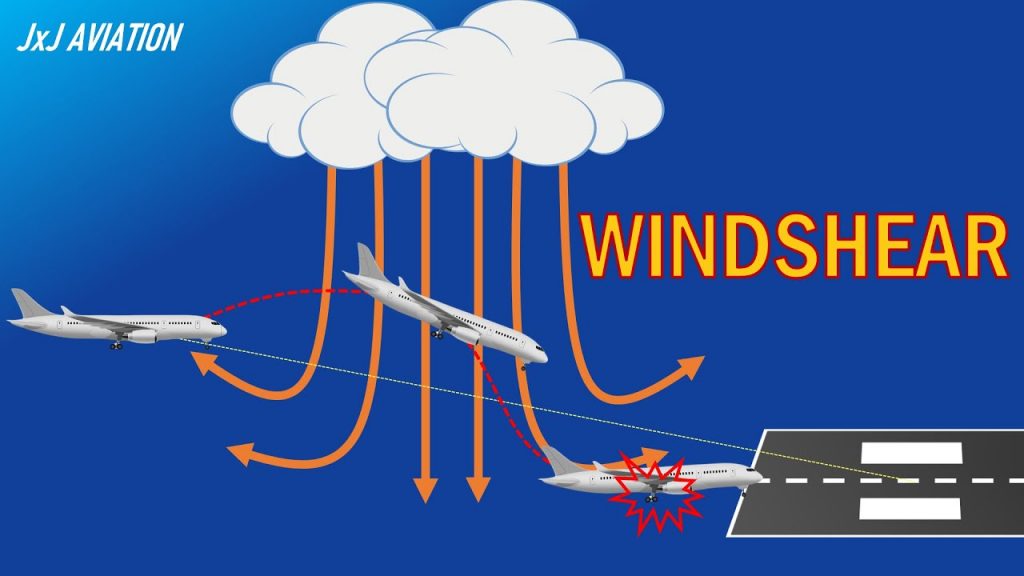
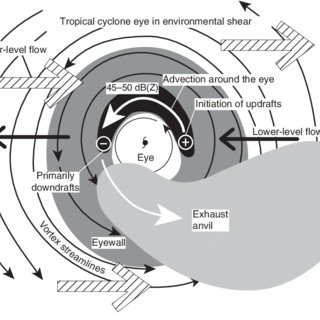
2.2.2 Wind shear Wind shear refers to the change in wind speed or direction with height in the atmosphere. High wind shear can disrupt the vertical structure of a hurricane, causing it to weaken or dissipate. Forecasters assess wind shear using satellite data, weather balloon observations, and numerical weather models.
2.2.3 Atmospheric pressure Hurricanes are characterized by low air pressure at their center. Forecasters monitor changes in atmospheric pressure using barometers on buoys, ships, and land-based weather stations. A rapid drop in pressure often indicates that a storm is intensifying.
2.3 Historical data and trends Analyzing historical hurricane data and trends is crucial for improving our understanding of these storms and refining forecasting techniques. Scientists study past hurricane seasons, landfall locations, intensities, and tracks to identify patterns and relationships with atmospheric and oceanic conditions. This information helps forecasters develop statistical models and analog forecasts based on similar historical situations. Additionally, examining long-term trends in hurricane activity can provide insights into the potential impacts of climate change on hurricane frequency and intensity.
By collecting and analyzing a wide range of data from multiple sources, forecasters can build a comprehensive picture of a hurricane’s current state and its likely future behavior. This information forms the foundation for the development and application of forecasting models and techniques, which will be discussed in the next part of this guide.
Part 3: Forecasting Models and Techniques
Forecasting hurricanes involves using various models and techniques to predict the track, intensity, and potential impacts of these storms. Meteorologists and researchers rely on a combination of statistical and dynamical models to generate forecasts.
3.1 Statistical models Statistical models, also known as statistical-dynamical models, use historical data on past hurricanes and their relationships with environmental variables to predict the behavior of current storms. These models consider factors such as sea surface temperature, atmospheric pressure, and wind shear to estimate the likelihood of hurricane formation, intensification, and movement. Some examples of statistical models include: a. Statistical Hurricane Intensity Prediction Scheme (SHIPS) b. Logistic Growth Equation Model (LGEM) c. Rapid Intensification Index (RII)
Statistical models are generally less computationally intensive than dynamical models and can provide quick guidance on hurricane behavior. However, they may not capture the full complexity of hurricane dynamics and can be limited by the quality and quantity of historical data.
3.2 Dynamical models Dynamical models, also called numerical weather prediction models, use mathematical equations to simulate the physical processes that govern hurricane formation and evolution. These models divide the atmosphere and ocean into grid cells and solve equations that describe the motion of air and water, as well as the transfer of heat and moisture. Dynamical models can be further categorized into two types:
3.2.1 Global models Global models simulate the entire Earth’s atmosphere and oceans, providing a comprehensive view of the large-scale environmental conditions that influence hurricane behavior. Some examples of global models include: a. Global Forecast System (GFS) b. European Centre for Medium-Range Weather Forecasts (ECMWF) c. Navy Global Environmental Model (NAVGEM)
Global models have a relatively coarse spatial resolution, typically ranging from 10 to 50 kilometers between grid points. They are useful for identifying large-scale patterns and long-term trends but may not capture the finer details of hurricane structure and intensity.
3.2.2 Regional models Regional models, also known as limited-area models or mesoscale models, focus on a specific region of interest and provide higher-resolution simulations of hurricane behavior. These models use boundary conditions from global models but can resolve smaller-scale features such as hurricane eye structure and rainbands. Some examples of regional models include: a. Hurricane Weather Research and Forecasting (HWRF) Model b. Hurricanes in a Multi-scale Ocean-coupled Non-hydrostatic (HMON) Model c. Advanced Hurricane WRF (AHW) Model
Regional models typically have a spatial resolution of 1 to 10 kilometers, allowing for more detailed predictions of hurricane track, intensity, and structure. However, they are computationally expensive and may have shorter lead times compared to global models.
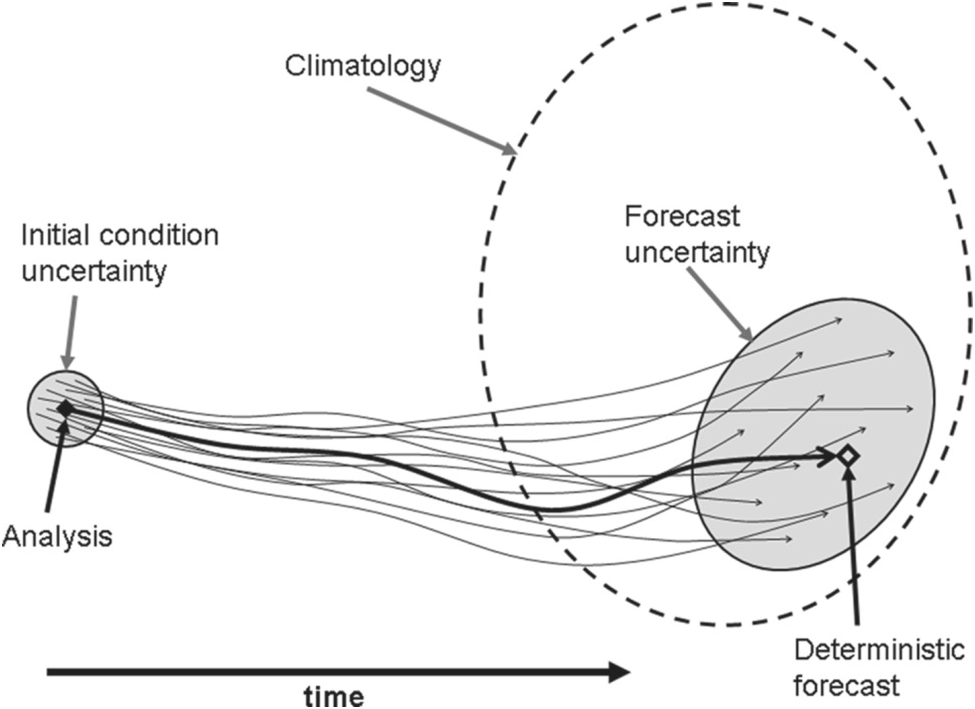
3.3 Ensemble forecasting Ensemble forecasting involves running multiple simulations of a hurricane using slightly different initial conditions, model physics, or model types. By generating a range of possible outcomes, ensemble forecasting helps quantify the uncertainty in hurricane predictions and provides probabilistic guidance on hurricane track, intensity, and impacts. Ensemble forecasting can be applied to both statistical and dynamical models.
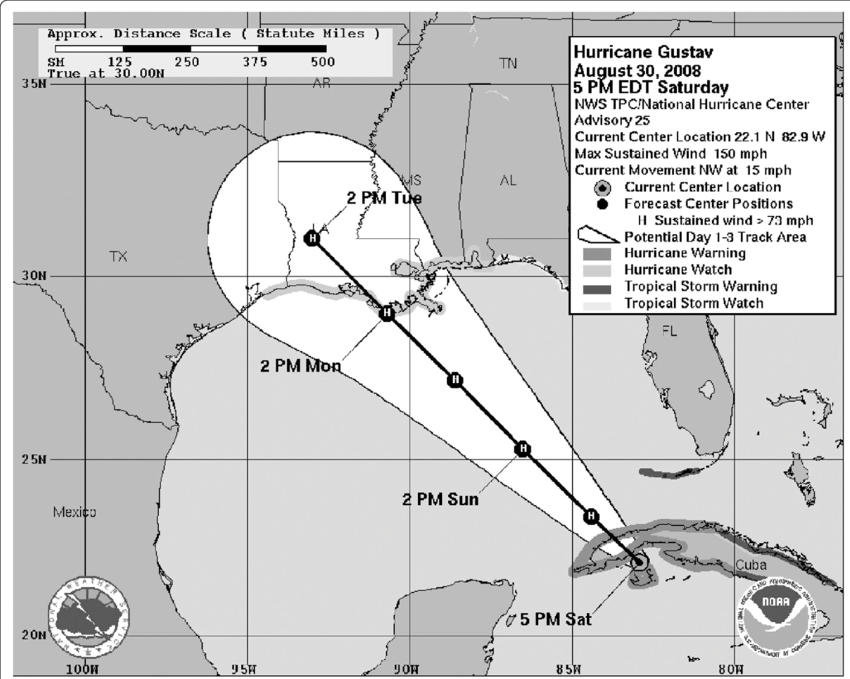
3.4 Interpreting model output Interpreting the output from hurricane forecasting models requires expertise in meteorology and an understanding of the strengths and limitations of each model. Forecasters analyze various model outputs, such as track plots, intensity graphs, and wind field maps, to assess the likely evolution of a hurricane. They also consider the consistency between different models and the overall pattern of model predictions to generate the official forecast.
Hurricane forecasting checklist:
Sea Surface Temperature (SST):
Look for SSTs of at least 26.5°C (79.7°F) extending to a depth of about 50 meters. Higher SSTs provide more energy for the storm to develop and intensify.
Atmospheric Instability:
Check for a moist, unstable atmosphere that allows warm air to rise easily. Look for a deep layer of warm, humid air extending from the surface to the mid-troposphere. Evaluate the presence of convective available potential energy (CAPE) to support thunderstorm development.
Low Wind Shear:
Analyze the vertical wind shear, which is the change in wind speed or direction with height. Ideal conditions for hurricane development have wind shear values less than 10 knots (11.5 mph or 18.5 km/h) between the lower and upper troposphere. High wind shear can disrupt the storm’s circulation and prevent it from intensifying.
Moisture Content:
Assess the presence of a moist environment, particularly in the mid-troposphere (around 5 km or 3 miles altitude). High relative humidity (greater than 70%) in this layer is conducive to hurricane development.
Pre-existing Disturbance:
Identify any pre-existing disturbances, such as tropical waves, low-pressure systems, or remnants of previous storms. These disturbances can act as seed areas for hurricane development if other conditions are favorable.
NOAA National Data Buoy Center: https://www.ndbc.noaa.gov/ NOAA Aircraft Operations Center: https://www.omao.noaa.gov/learn/aircraft-operations NOAA Hurricane Hunters: https://www.aoml.noaa.gov/hrd/about_hrd/HRD-P3_program.html
Forecasting:
NOAA National Hurricane Center: https://www.nhc.noaa.gov/ NOAA Environmental Modeling Center: https://www.emc.ncep.noaa.gov/ NOAA Hurricane Weather Research and Forecasting (HWRF) Model: https://www.emc.ncep.noaa.gov/gc_wmb/vxt/HWRF/
Advisories:
NOAA National Hurricane Center Advisories: https://www.nhc.noaa.gov/cyclones/ NOAA National Weather Service: https://www.weather.gov/ FEMA (Federal Emergency Management Agency): https://www.fema.gov/
Flood Maps:
FEMA Flood Map Service Center: https://msc.fema.gov/portal/home NOAA National Hurricane Center Storm Surge Inundation Maps: https://www.nhc.noaa.gov/surge/inundation/ USGS (United States Geological Survey) Flood Event Viewer: https://stn.wim.usgs.gov/FEV/
Forecast model links:
1. Tropical Tidbits: https://www.tropicaltidbits.com/ – Provides a wide range of model data, satellite imagery, and analysis tools
2. Mike’s Weather Page: https://spaghettimodels.com/ – Offers a collection of spaghetti models, forecast discussions, and other tools
3. Crown Weather Services: https://crownweather.com/ – Includes detailed forecast discussions, model data, and a focus on the Atlantic basin
4. Cyclocane: https://www.cyclocane.com/ – Features an interactive map with various model tracks and satellite imagery
5. Hurricane Track: https://hurricanetrack.com/ – Provides a mix of professional analysis, model data, and user-friendly explanations
6. Severe Weather Europe: https://www.severe-weather.eu/tropical-weather/ – Covers tropical weather worldwide, with a focus on European interests
7. Force Thirteen: https://www.force-13.com/ – Offers live coverage, model analysis, and a community-driven approach to hurricane tracking
8. Instant Weather Maps: https://www.instantweathermaps.com/ – Provides a variety of weather maps, including tropical cyclone data and model outputs
9. Windy: https://www.windy.com/ – An interactive weather visualization platform with various forecast models and hurricane tracking features
10. NOAA’s Atlantic Oceanographic and Meteorological Laboratory (AOML): https://www.aoml.noaa.gov/hrd/graphics_sub_pages/models.html – While part of an official agency, AOML provides a comprehensive collection of model data and graphics