Unraveling the Mystery: Why Severe Storms Have Green, Teal, and Blue Colors

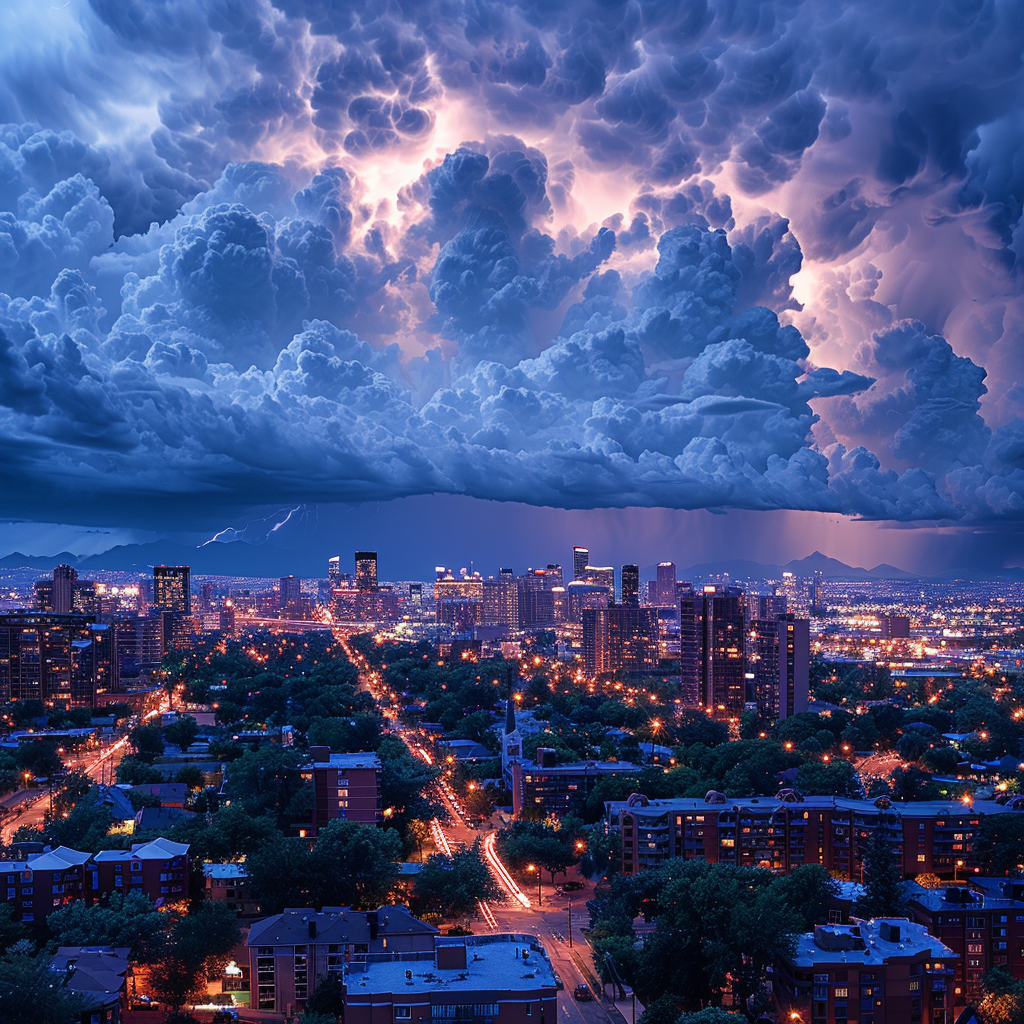
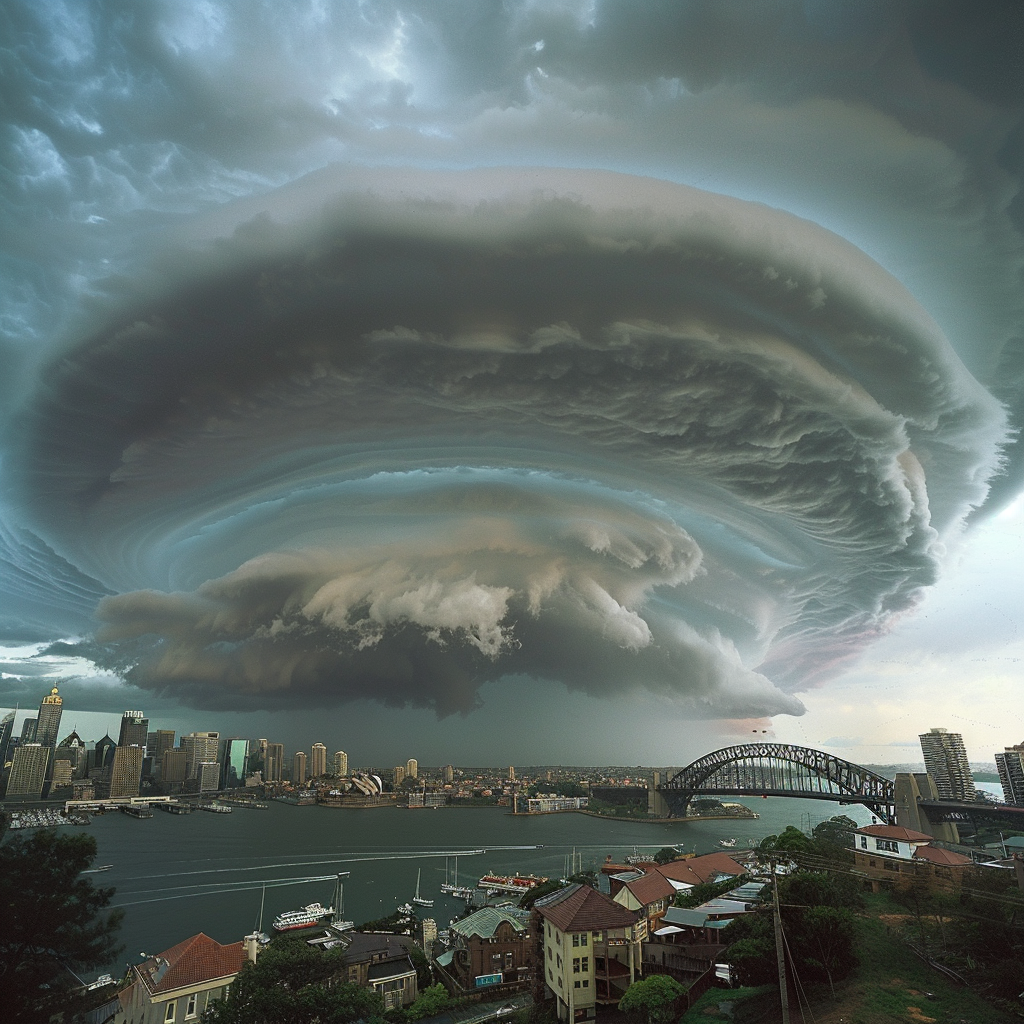
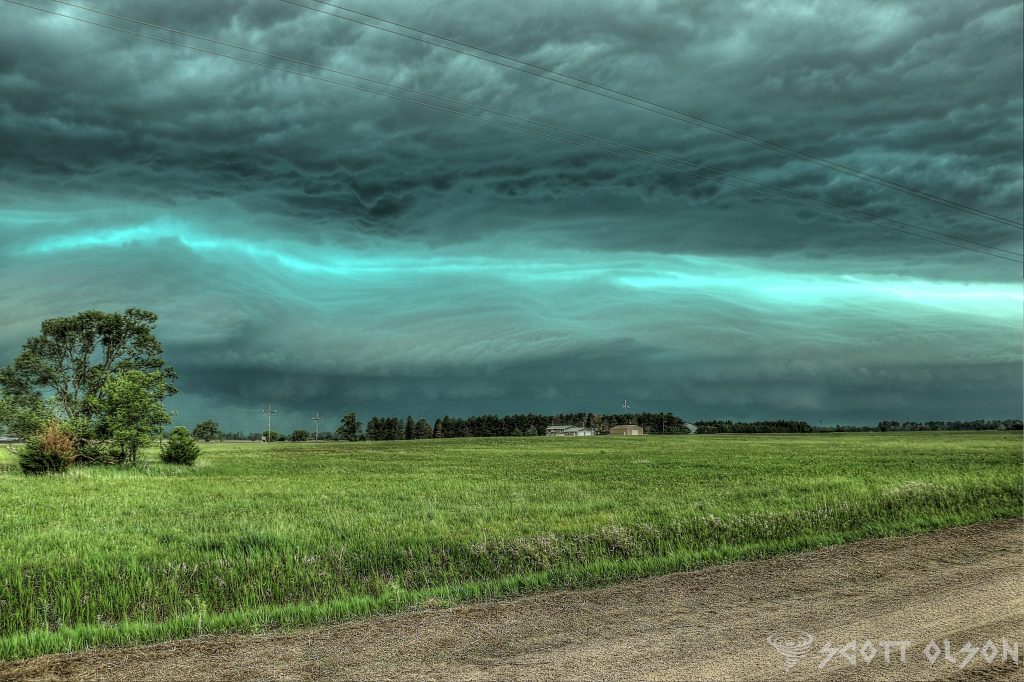
Supercell thunderstorms are among the most awe-inspiring and powerful weather phenomena on Earth. These storms are characterized by their rotating updrafts, known as mesocyclones, which can produce severe weather conditions such as large hail, damaging winds, and even tornadoes. One of the most striking features of supercells is the occasional appearance of a green or teal color in the sky, particularly near the storm’s base. This unique coloration has fascinated both weather enthusiasts and scientists alike, prompting numerous studies to unravel the mystery behind this phenomenon.

The presence of these large water droplets is crucial to the formation of the green or teal color. Water droplets are particularly effective at absorbing red light, which is at the longer wavelength end of the visible spectrum. As sunlight enters the storm and interacts with these water droplets, a significant portion of the red light is absorbed, leaving the remaining light dominated by shorter wavelengths, which correspond to blue and green colors.

However, the absorption of red light by water droplets alone is not sufficient to explain the intense green or teal hue sometimes observed. Another critical factor is the presence of ice crystals in the upper portions of the storm, particularly in the updraft and the rear flank downdraft (RFD). The RFD is another area of descending air, located on the back side of the storm, often associated with strong winds and large hail.

Ice crystals in the upper portions of the storm can scatter the remaining blue light, further enhancing the green appearance. The combination of red light absorption by water droplets in the lower levels and blue light scattering by ice crystals in the upper levels creates the distinctive green or teal color.

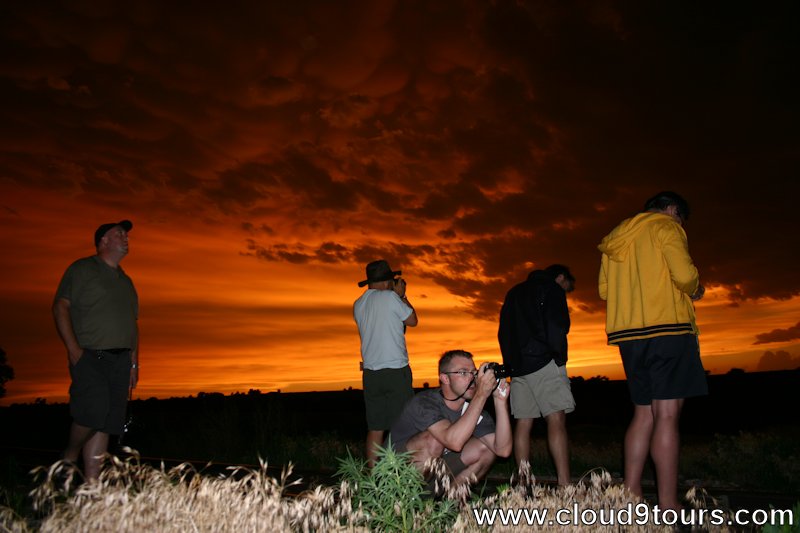
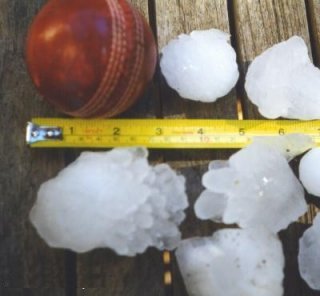
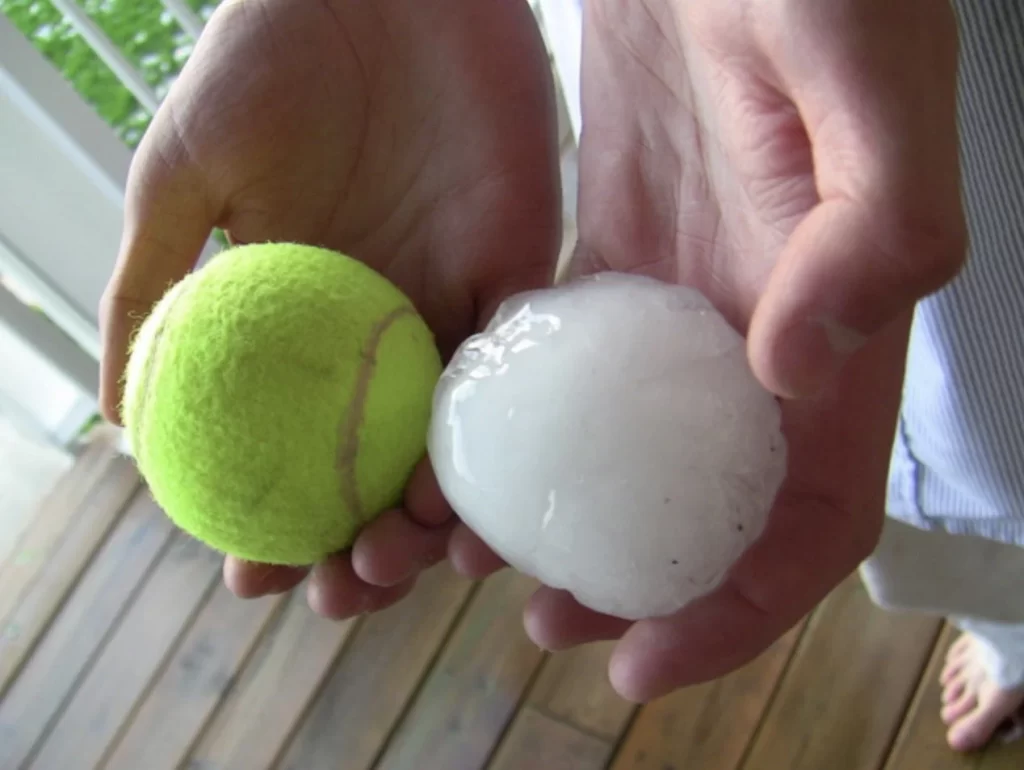
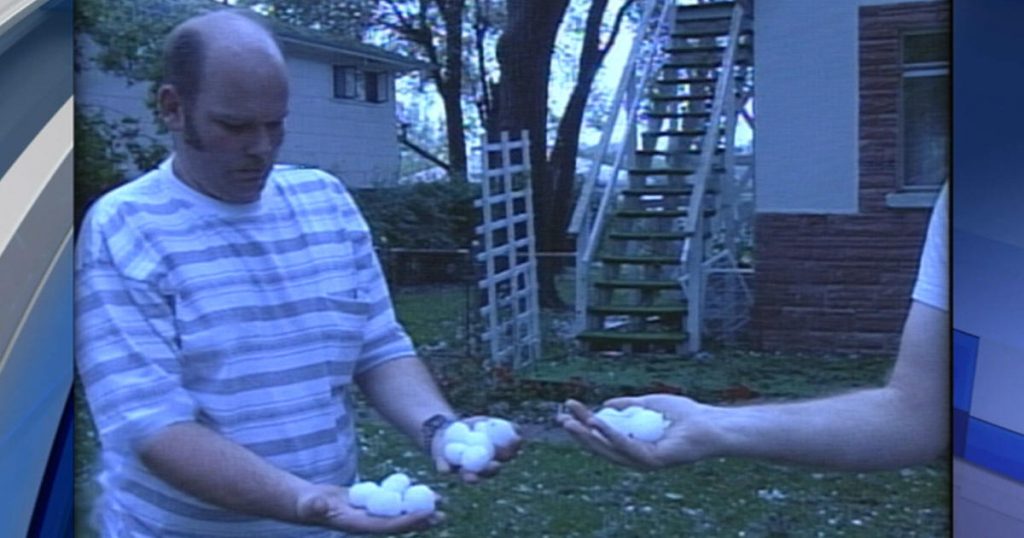
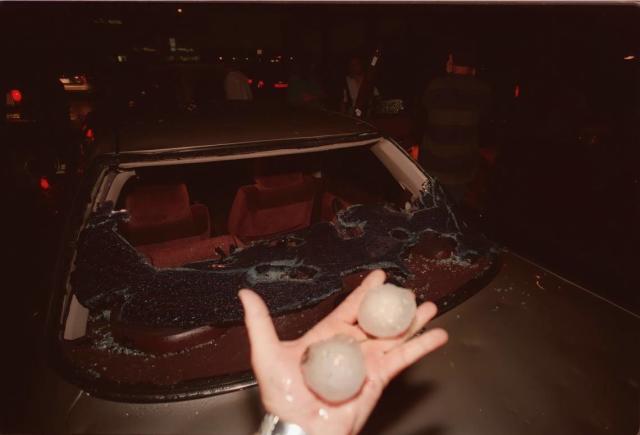
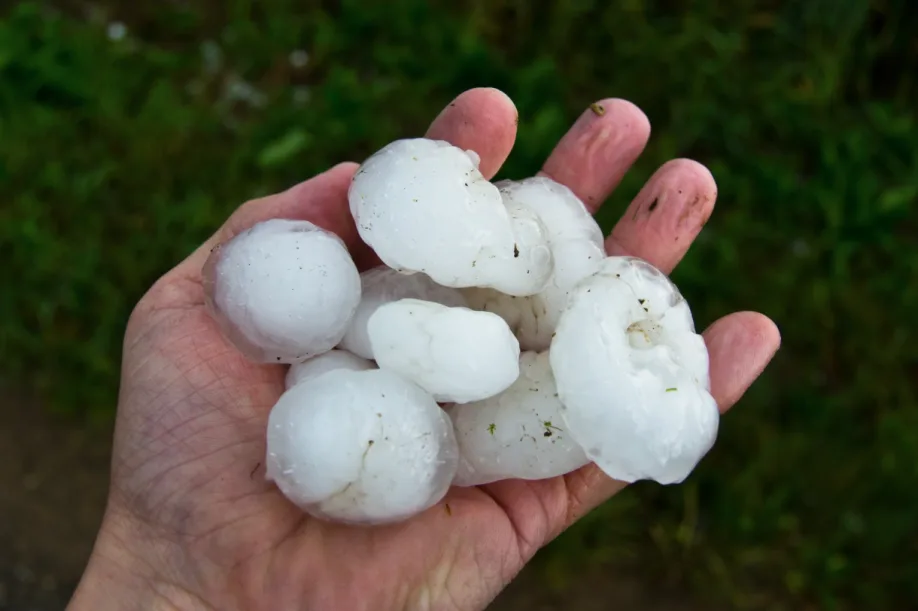
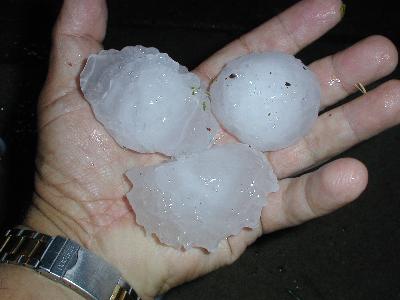
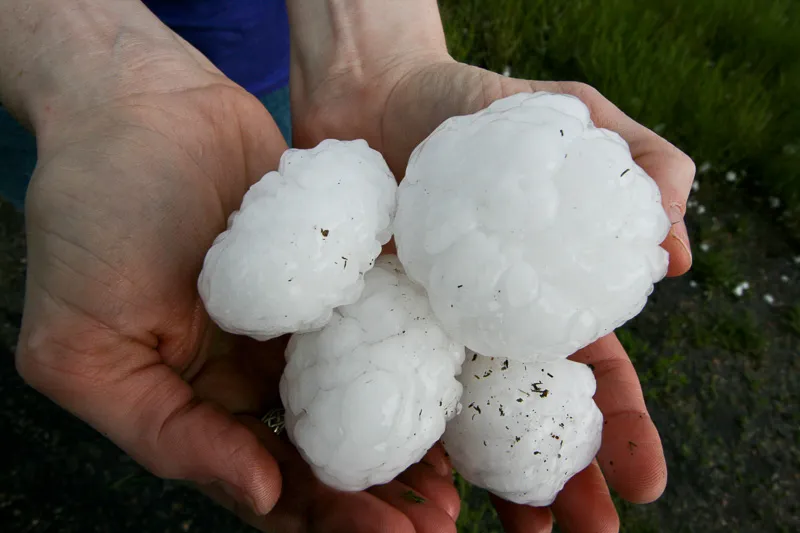
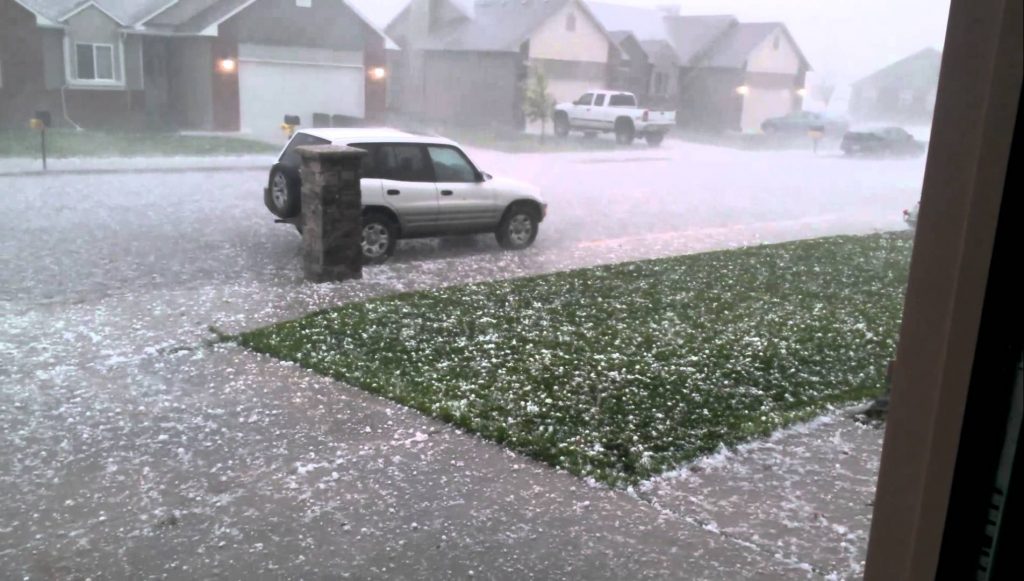
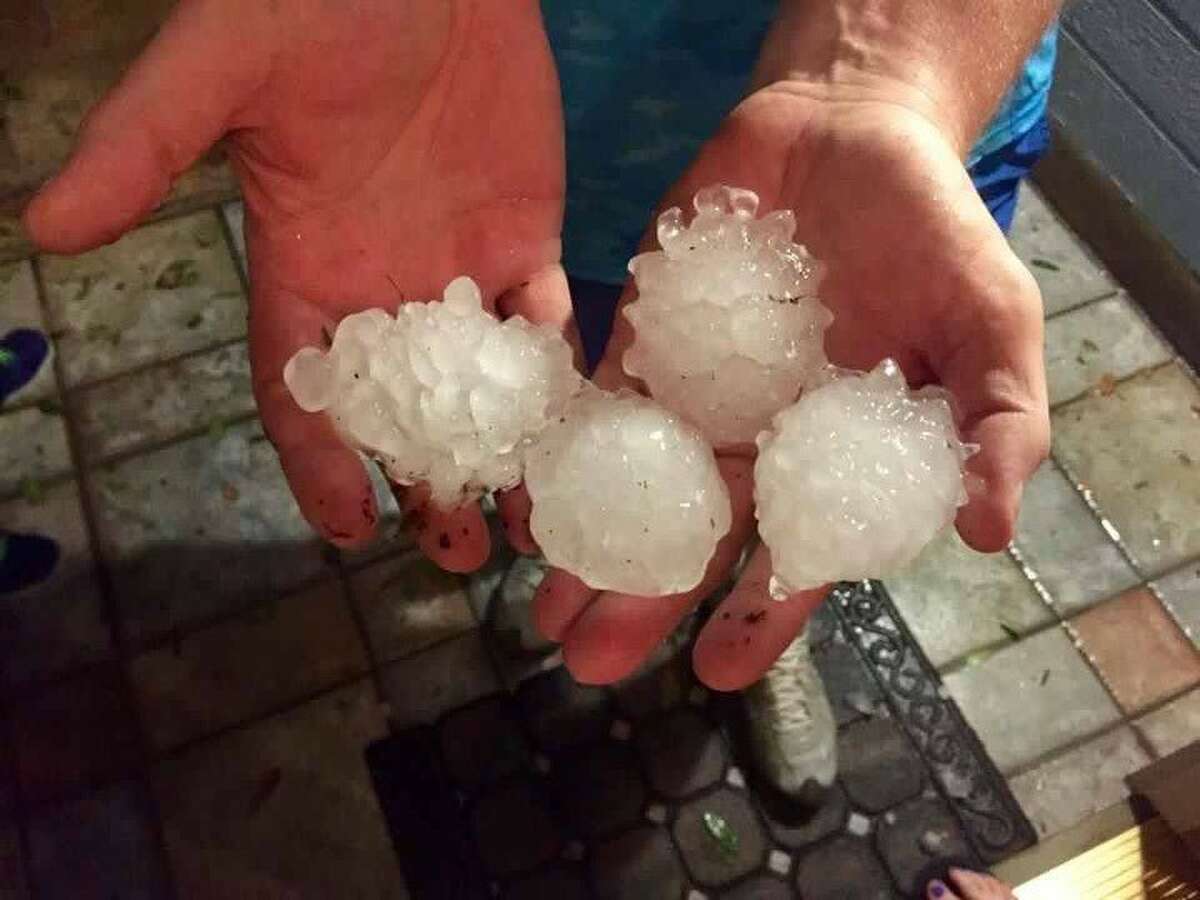
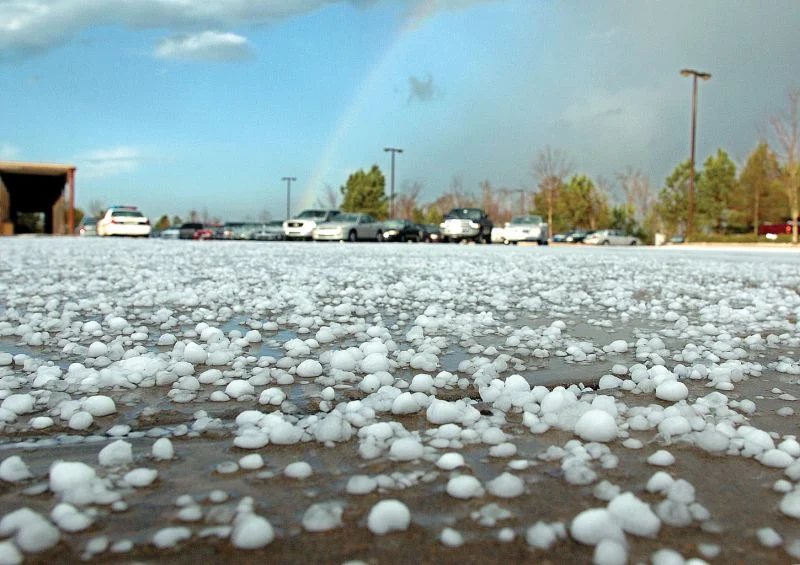
The green coloration is most likely to be observed when the sun is at a low angle on the horizon, typically during the late afternoon or early evening. During this time, sunlight has to travel through more of the Earth’s atmosphere, which can further filter out red light and enhance the green appearance. Additionally, the presence of large amounts of hail in the storm can intensify the green color, as hail can also absorb and scatter light in a manner similar to water droplets and ice crystals. Most storm chasers have experienced the largest hail when storms take on green and teal colors.

It is important to note that not all supercells exhibit a green or teal color, and the absence of this coloration does not necessarily indicate a less severe storm. The appearance of the green hue depends on a delicate balance of factors, including the storm’s structure, the concentration and size of hydrometeors, and the angle of the sun.

While the green or teal color in supercells is a fascinating phenomenon, it is important to remember that it is often associated with the most severe and dangerous storms. Supercells that exhibit this coloration are likely to be producing large hail, damaging winds, and possibly even tornadoes. If you find yourself in the vicinity of a supercell with a green or teal hue, it is crucial to seek shelter immediately and follow the advice of local weather authorities.

Inside the Storm: Decoding Radar’s Secrets – From Bow Echo to Debris Ball

Radar meteorology is one of the most important tools for monitoring and predicting severe weather events. By analyzing radar data, meteorologists can identify specific features that indicate the presence of dangerous storms, such as supercell thunderstorms and tornadoes. In this article, we will discuss some of the most common radar features to look for when assessing severe weather threats.

  1. Hook Echo:
    A hook echo is a distinctive radar signature that often indicates the presence of a supercell thunderstorm capable of producing tornadoes. This feature appears as a hook-shaped appendage extending from the main storm cell on the radar display. The hook shape is formed by the rotation of the storm’s updraft, which can cause rain and hail to wrap around the updraft, creating a hook-like appearance.

When a hook echo is detected, it is essential to monitor the storm closely, as it has a higher likelihood of producing a tornado. The tightness and persistence of the hook echo can provide clues about the storm’s intensity and potential for tornadogenesis. A tight, well-defined hook echo that persists for an extended period is more likely to be associated with a strong, long-lived tornado.

  1. Bow Echo:
    A bow echo is a radar signature that indicates the presence of a strong, linear wind storm known as a derecho. This feature appears as a bow-shaped line of storms on the radar display, with the apex of the bow pointing in the direction of the storm’s movement. Bow echoes are often associated with widespread damaging winds, which can exceed 100 mph in extreme cases.

The formation of a bow echo is related to the development of a strong rear-inflow jet behind the main line of storms. This jet of fast-moving air descends to the surface and spreads out, causing the line of storms to bow outward. As the rear-inflow jet continues to strengthen, it can lead to the formation of embedded circulations within the line, known as mesovortices, which can produce brief, spin-up tornadoes.

  1. Debris Ball:
    A debris ball, also known as a tornado debris signature (TDS), is a radar feature that indicates the presence of lofted debris associated with a tornado. This signature appears as a localized area of high reflectivity (bright colors) on the radar display, often coinciding with the location of a hook echo or other tornado-related features.

The debris ball is caused by the tornado lofting large amounts of debris, such as trees, building materials, and other objects, high into the air. When the radar beam intersects this debris, it produces a strong return signal, which appears as a bright, concentrated area on the radar display. The presence of a debris ball is a strong indication that a tornado is causing damage on the ground.

  1. Three-Body Scatter Spike (TBSS):
    A three-body scatter spike is a radar signature that can indicate the presence of a large hail core within a thunderstorm. This feature appears as a narrow, linear spike of high reflectivity extending radially outward from the storm on the radar display. The TBSS is caused by the radar beam reflecting off a layer of large hailstones and then reflecting again off the ground before returning to the radar.

The presence of a TBSS suggests that the storm contains a significant amount of large hail, which can cause extensive damage to property and pose a serious risk to public safety. When a TBSS is detected, it is important to issue warnings for large hail and to advise people to seek shelter immediately.

  1. Bounded Weak Echo Region (BWER):
    A bounded weak echo region is a radar feature that indicates the presence of a strong, persistent updraft within a thunderstorm. This feature appears as a localized area of low reflectivity (dark colors) surrounded by higher reflectivity values on the radar display. The BWER is caused by the strong updraft lifting precipitation particles high into the storm, creating a region of relatively low radar returns.

The presence of a BWER suggests that the storm has a powerful updraft, which can support the formation of large hail and tornadoes. When a BWER is detected, it is important to monitor the storm closely for the development of other severe weather signatures, such as hook echoes or debris balls.

  1. Inflow Notch:
    An inflow notch is a radar signature that indicates the presence of strong, localized inflow into a thunderstorm. This feature appears as a small, localized area of low reflectivity (dark colors) along the leading edge of the storm on the radar display. The inflow notch is caused by the rapid inflow of warm, moist air into the storm, which can fuel the development of strong updrafts and severe weather.

The presence of an inflow notch suggests that the storm is actively ingesting warm, moist air, which can lead to rapid intensification and the formation of severe weather hazards, such as large hail, damaging winds, and tornadoes. When an inflow notch is detected, it is important to monitor the storm closely for the development of other severe weather signatures.

  1. Rear Inflow Notch (RIN):
    A rear inflow notch is a radar feature that indicates the presence of strong, localized inflow into the back side of a thunderstorm. This feature appears as a small, localized area of low reflectivity (dark colors) along the rear flank of the storm on the radar display. The RIN is caused by the rapid inflow of cooler, drier air into the storm, which can help to strengthen the storm’s updraft and increase the potential for severe weather.

The presence of a RIN suggests that the storm is actively ingesting cooler, drier air on its back side, which can lead to the formation of a strong rear-flank downdraft (RFD). The RFD can help to tighten the storm’s rotation and increase the risk of tornadogenesis. When a RIN is detected, it is important to monitor the storm closely for the development of hook echoes, debris balls, and other tornado-related signatures.

  1. Hail Spike:
    A hail spike is a radar signature that indicates the presence of a strong updraft capable of producing large hail. This feature appears as a narrow, vertical spike of high reflectivity extending upward from the storm on the radar display. The hail spike is caused by the strong updraft lofting large hailstones high into the storm, where they can grow even larger before falling back to the ground.

The presence of a hail spike suggests that the storm has a powerful updraft that can support the formation of large, damaging hail. When a hail spike is detected, it is important to issue warnings for large hail and to advise people to seek shelter immediately.

May 8, 2017 Insane Denver Hailstorm

On May 8, 2017, a severe hailstorm struck the Denver metropolitan area, causing widespread damage and disrupting daily life for thousands of residents. The storm, which lasted for several hours, produced hailstones ranging in size from small pellets to golf ball-sized chunks of ice, leaving a trail of destruction in its wake. This article will provide a comprehensive overview of the event, including the storm’s timeline, the meteorological conditions that led to its formation, and the extent of the damage it caused.

The hailstorm began to develop in the early afternoon hours of May 8, as a potent upper-level disturbance moved across the Rocky Mountains and into the Denver area. This disturbance, combined with strong daytime heating and abundant low-level moisture, created an unstable atmosphere that was primed for severe thunderstorm development. By 2:30 PM MDT, the first severe thunderstorm warnings were issued for the Denver metro area, as radar indicated the presence of large hail and strong winds within the developing storms.

As the afternoon progressed, the thunderstorms continued to intensify and expand in coverage. By 3:00 PM MDT, large hail was being reported across much of the Denver area, with some locations experiencing hailstones up to 2.5 inches in diameter. The largest hail was reported in the western and southern suburbs of Denver, including Lakewood, Littleton, and Highlands Ranch. In these areas, the hail was large enough to cause significant damage to vehicles, roofs, and landscaping.

The hailstorm reached its peak intensity between 3:30 PM and 4:30 PM MDT, as multiple severe thunderstorms merged into a large, slow-moving complex over the Denver metro area. During this time, the National Weather Service issued a rare “Flash Flood Emergency” for the city of Denver and its surrounding suburbs, as the combination of heavy rain and melting hail created dangerous flooding conditions on many roads and highways. The flooding was particularly severe in the southern and eastern portions of the metro area, where some locations received up to 3 inches of rain in less than an hour.

As the storm system slowly moved off to the east, the hail and heavy rain began to subside, but not before leaving a significant amount of damage in its wake. According to insurance industry estimates, the May 8 hailstorm caused more than $2.3 billion in damage, making it the costliest hailstorm in Colorado history. The majority of the damage was to vehicles, with more than 150,000 auto insurance claims filed in the wake of the storm. Many homes and businesses also suffered damage to roofs, siding, and windows, with some buildings experiencing complete roof failures due to the weight of the accumulated hail.

In the days following the storm, cleanup and repair efforts began in earnest across the Denver area. Insurance companies set up mobile claims centers to process the large volume of auto and property damage claims, while roofing and construction companies worked around the clock to repair damaged buildings. The City of Denver also launched a major cleanup effort to remove debris from streets and public spaces, with crews working 12-hour shifts to clear the affected areas.

From a meteorological perspective, the May 8 hailstorm was a classic example of a severe thunderstorm event in the High Plains region of the United States. The combination of strong upper-level winds, abundant low-level moisture, and intense daytime heating created an environment that was highly conducive to the development of large hail and damaging winds. The slow-moving nature of the storm system also allowed for a prolonged period of hail accumulation, which contributed to the extensive damage that occurred.

One of the unique aspects of the May 8 storm was the size and density of the hailstones that fell. According to the National Weather Service, the largest hailstone reported during the storm had a diameter of 2.75 inches, which is roughly the size of a baseball. However, many of the hailstones that fell were much smaller in size but incredibly dense, with some reports describing the hail as feeling like “small rocks” when they hit the ground. This high density of the hailstones likely contributed to the extensive damage that occurred to vehicles and roofs, as the impact of the hail was more severe than what would typically be expected from hailstones of a similar size.

Hail No: App Review

Hail No is an app designed for anyone who needs to know of an approaching hail storm, this could be a car dealership, people who are traveling, motorcyclists, meteorologists, storm chasers. When you first download the app you select your location and the hail size and how long of a lead time you want a warning for. For instance, if you are concerned about damage to your vehicle, you could select 1.5″ hail as a threshold and 30 miles as your warning radius, which is plenty of time to move your truck.

An alert will be sent as a push notification, so there is no need to have the app opened. When you open the app you will see a map with your selected location, your radius and colors denoting the hail size and a legend. This hail map is produced with the latest NSSL algorithm for hail size estimation and updated ever 3-4 minutes.

Real-time storm reports from multiple feeds will display on the map you can click on these for more information.

Hail No PRO subscribers have access to defense mode. Let’s say you are going on the move, traveling across country – just hit Defense Mode and Hail No will monitor your location for the next 24 hours. If you happen to be driving and a hail storm is detected you’ll get an immediate alert!

Another feature of Hail No is for people who want to see the hail tracks for the last 24 hours, just hit 24HR Hail and it will display the full map of the last 24 hours.

Here’s more images of Hail No in action:

Advancing Severe Weather Detection: The Rise of Dual Polarization Radar in the US

Weather radar has always been a cornerstone of meteorological observation and forecasting. Yet, traditional radar systems, while effective, were limited in their ability to decipher the complexities within storms, often leaving meteorologists with an incomplete picture. The advent of dual polarization radar technology marked a paradigm shift, ushering in an era of enhanced precision and understanding in severe weather detection and warnings.

Understanding the Dual Pol Advantage:

Traditional weather radars transmit and receive horizontally polarized waves, meaning the waves vibrate parallel to the ground. This provides information about the location and intensity of precipitation but lacks the ability to discern the size, shape, and variety of particles within a storm. Dual polarization technology builds upon this foundation by introducing a second dimension – vertical polarization. By transmitting and receiving both horizontally and vertically polarized waves, dual pol radar paints a more comprehensive picture of the storm environment.

Transforming Tornado Detection:

One of the most significant benefits of dual pol technology lies in its ability to enhance tornado detection and warnings. Traditional radar could identify areas of rotation within a storm, suggestive of a possible tornado. However, confirming the presence of a tornado often relied on visual sightings or the detection of debris lofted into the air, both of which could be unreliable or delayed.

Dual pol radar brought a game-changing advantage: the ability to detect debris fields associated with tornadoes. When a tornado is on the ground, it lifts a variety of objects – from tree limbs and building materials to vehicles and even larger structures. These objects scatter radar waves differently than raindrops or hailstones, creating a distinct signature that dual pol radar can identify. This capability allows meteorologists to confirm the presence of a tornado with greater confidence and issue more timely and accurate warnings, potentially saving lives.

Sharper Images, Clearer Insights:

Beyond debris detection, dual pol technology enhances the overall resolution and clarity of radar data. By analyzing the way horizontally and vertically polarized waves interact with precipitation particles, meteorologists can estimate the size and shape of raindrops, hailstones, and snowflakes. This information provides valuable insights into the intensity of precipitation, the potential for flooding, and the type of winter weather expected.

A Nationwide Upgrade: The Dual Pol Rollout:

Recognizing the transformative potential of dual polarization technology, the National Weather Service (NWS) embarked on an ambitious endeavor to upgrade its entire network of radars across the United States. The rollout, initiated in 2010 and completed in 2013, involved retrofitting existing radars with dual pol capabilities, ensuring comprehensive coverage for the nation.

This nationwide upgrade has yielded substantial improvements in severe weather detection and warnings. Studies have shown a significant increase in lead times for tornado warnings and a reduction in false alarms, underscoring the life-saving potential of this technology.

Beyond Tornadoes: A Multifaceted Tool:

While the impact of dual pol radar on tornado warnings has been profound, its benefits extend far beyond this realm. The technology has proven invaluable for:

  • Improved Rainfall Estimates: By providing more accurate measurements of rainfall amounts, dual pol data enhances flash flood warnings and supports better water resource management.
  • Winter Weather Monitoring: The ability to differentiate between various types of frozen precipitation, such as snow, sleet, and freezing rain, leads to more precise winter storm forecasts and improved road condition monitoring.
  • Aviation Safety: Dual pol radar aids in identifying hazardous weather phenomena for aviation, including icing conditions and turbulence, contributing to safer air travel.

20 Game-Changing Weather Apps You Can’t Afford to Miss

In today’s world, being prepared for changing weather conditions is crucial. Fortunately, there are numerous weather apps available that can help you stay informed and safe. Here are 20 game-changing weather apps you can’t afford to miss:

  • Dark Sky
    This app is known for its accurate hyperlocal forecasts and beautiful radar maps. It provides down-to-the-minute updates and alerts for precipitation, temperature, and severe weather events, making it a reliable choice for staying on top of changing weather conditions.
  • Hail No
    Defend yourself from hailstorms with Hail No, the first hail app to provide real-time tracking and alert notifications. See where the hail is, create a defensive radius around any location, and get automatic alerts. Hail No provides access to the National Severe Storms Laboratory hail algorithm, the most accurate available, ensuring you’re always aware of potential hail threats.
    Apple: https://apps.apple.com/us/app/hail-no/id1469253867
  • WeatherBug
    WeatherBug is a comprehensive weather app that offers real-time weather data, radar maps, and severe weather alerts. It also includes features like pollen and air quality forecasts, making it a great choice for those with allergies or respiratory issues. Stay informed about changing weather conditions and potential health impacts with WeatherBug.
  • Tornado Vision
    See severe weather with augmented reality! Tornado Vision can help you see tornadoes hiding in the rain or at night. Simply point your phone at any severe storm, and you’ll get a heads-up display on what is happening inside the storm. This groundbreaking weather technology provides information on the chance of a tornado, hail size, wind speed, and more, right on your screen.
    iOS: https://apps.apple.com/us/app/tornado-vision/id1469550036
    Android: https://play.google.com/store/apps/details?id=com.tornadovision.app.presentation&hl=en&gl=US&pli=1
  • RadarScope
    Designed for weather enthusiasts and professionals, RadarScope is a powerful radar app that provides high-resolution radar data, storm tracking, and advanced analysis tools. Dive deep into weather data and gain a comprehensive understanding of weather patterns with this feature-rich app.
  • Predict Now
    Predict Now is a powerful weather app that provides hyperlocal forecasts and real-time alerts for severe weather events. With its user-friendly interface and advanced features, you can stay ahead of the game and plan your activities accordingly, ensuring you’re always prepared for changing weather conditions.
    Apple: https://apps.apple.com/us/app/predict-now/id1481839520
  • NOAA Weather Radar Live
    This free app provides access to real-time weather radar data from the National Oceanic and Atmospheric Administration (NOAA). Stay informed about severe weather events in your area with up-to-date radar information from a trusted source.
  • Weather Underground
    Weather Underground is a comprehensive weather app that offers hyperlocal forecasts, radar maps, and severe weather alerts. It also includes a community feature that allows users to share weather observations and photos, creating a collaborative weather-tracking experience.
  • AccuWeather
    AccuWeather is a popular weather app known for its accurate forecasts and user-friendly interface. It provides detailed weather information, including hourly and daily forecasts, radar maps, and severe weather alerts, ensuring you have all the information you need to plan your day.
  • The Weather Channel
    The Weather Channel app is a reliable source for weather information, offering forecasts, radar maps, and severe weather alerts. It also includes features like hurricane tracking and ski resort conditions, making it a versatile choice for various weather-related activities.
  • Clime: NOAA Weather Radar
    Clime: NOAA Weather Radar is a free app that provides access to real-time weather radar data from NOAA. Stay informed about severe weather events in your area with this simple yet effective app.
  • MyRadar Weather Radar
    MyRadar Weather Radar is a powerful app that offers high-resolution radar data, severe weather alerts, and customizable settings. Tailor the app to your specific needs and get a detailed view of weather conditions in your area.
  • Windy
    Windy is a unique weather app that focuses on wind forecasts and patterns. It provides detailed wind maps, as well as forecasts for temperature, precipitation, and other weather conditions, making it an excellent choice for outdoor enthusiasts and those interested in wind-related activities.
  • Weather Mate
    Weather Mate is a comprehensive weather app that offers hyperlocal forecasts, radar maps, and severe weather alerts. It also includes features like air quality and pollen forecasts, making it a great choice for those with allergies or respiratory issues. Stay informed about weather conditions and potential health impacts with this all-in-one app.
  • Carrot Weather
    Carrot Weather is a unique weather app that combines accurate forecasts with a quirky and humorous personality. It provides detailed weather information, including hourly and daily forecasts, radar maps, and severe weather alerts, all delivered with a touch of humor to make weather tracking more enjoyable.
  • Storm Radar
    Storm Radar is a powerful app that provides real-time radar data, severe weather alerts, and storm tracking capabilities. Stay informed about severe weather events in your area and track storms with this comprehensive app.
  • Weather Live
    Weather Live is a comprehensive weather app that offers hyperlocal forecasts, radar maps, and severe weather alerts. It also includes features like air quality and pollen forecasts, making it a great choice for those with allergies or respiratory issues. Stay informed about weather conditions and potential health impacts with this versatile app.
  • Flowx
    Flowx is a unique weather app that focuses on visualizing weather patterns and forecasts. It provides detailed weather information, including wind patterns, precipitation, and temperature, in a visually stunning format, making it an excellent choice for those who appreciate beautiful data visualization.
  • Weather Maps
    Weather Maps is a powerful app that provides detailed weather maps and forecasts for various weather conditions, including precipitation, temperature, wind, and more. Get a comprehensive view of weather patterns with this data-rich app.
  • Weather Radar by ICM
    Weather Radar by ICM is a free app that provides access to real-time weather radar data from various sources, including NOAA and Environment Canada. Stay informed about severe weather events in your area with this simple yet effective app.

Choosing the Best Tornado Tour Company: A Guide for New Storm Chasers

If you’re an adventurous soul looking to witness the raw power of nature up close, a tornado tour might be just the thrill you’re seeking. However, with numerous companies offering storm chasing experiences, it’s important to choose a reputable and experienced outfit to ensure your safety and satisfaction. We’ll guide you through the process of selecting the best tornado tour company and provide a list of well-known operators along with their website addresses.

Factors to Consider When Choosing a Tornado Tour Company:

  1. Experience and expertise: Look for companies with experienced guides who have a proven track record of successfully navigating severe weather conditions. Ensure that the guides are knowledgeable about meteorology and have the necessary skills to keep you safe.
  2. Safety measures: Your chosen company should prioritize safety above all else. Inquire about their safety protocols, emergency procedures, and the equipment they use to monitor and track storms.
  3. Group size: Smaller group sizes often lead to a more personalized experience and better access to the guides. Consider the company’s maximum group size and whether it aligns with your preferences.
  4. Tour duration and itinerary: Tornado tours can vary in length from a single day to a week or more. Consider your availability and the specific areas you’d like to explore when choosing a tour duration and itinerary.
  5. Reviews and testimonials: Read reviews and testimonials from previous clients to gauge the company’s reputation and the quality of their tours. Look for consistent positive feedback and how the company responds to any negative reviews.

Top Tornado Tour Companies:

  1. Tempest Tours
    Website: https://tempesttours.com/
    Tempest Tours has been offering storm chasing expeditions since 2000 and is known for their experienced guides and commitment to safety.

  1. Silver Lining Tours
    Website: https://www.silverliningtours.com/
    With over 20 years of experience, Silver Lining Tours provides educational and thrilling storm chasing adventures across Tornado Alley.

  1. Storm Chasing Adventure Tours
    Website: https://stormchasing.com/
    Storm Chasing Adventure Tours offers a variety of tour options, from single-day excursions to week-long expeditions, led by experienced meteorologists and storm chasers.

  1. Extreme Tornado Tours
    Website: https://extremetornadotours.com/
    Extreme Tornado Tours specializes in small-group tours led by seasoned storm chasers, ensuring a personalized and immersive experience.

  1. Cloud 9 Tours
    Website: https://cloud9tours.com/
    Cloud 9 Tours offers both storm chasing and photography-focused tours, catering to those who want to capture the beauty and power of severe weather.

Storm chasing tornado tours offer a unique and exhilarating experience for thrill-seekers and weather enthusiasts alike. These guided adventures take participants on a journey into the heart of Tornado Alley, where they witness the awe-inspiring power of nature firsthand. Experienced storm chasers lead the tours, using their expertise in meteorology and forecasting to navigate the group towards active storms. Participants can expect to spend long hours on the road, tracking weather patterns and chasing down potential tornado outbreaks. When a tornado does form, the rush of adrenaline is unparalleled as the group carefully positions themselves at a safe distance to observe the twisting vortex.

However, storm chasing is not without its risks. Tornadoes are unpredictable and can change course or intensify rapidly, putting chasers in danger if they are not careful. Flying debris, hail, and strong winds can also pose a threat to safety. Storm chasing tour companies prioritize the well-being of their clients, but participants must be aware of the inherent dangers and follow instructions closely. Choose a reputable company with experienced guides who prioritize safety above all else. Participants should also be prepared for the physical demands of the tour, as it often involves long periods of driving and potentially rough terrain. Storm chasing is endless driving and sometimes you won’t see much so you have to be prepared to be on the road for up to 10 days.

Despite the risks, the benefits of a storm chasing tornado tour are significant for those who crave adventure and have a deep appreciation for the power of nature. Witnessing a tornado up close is a once-in-a-lifetime experience that few people have the opportunity to enjoy. Storm chasing tours provide a controlled environment for this experience, with knowledgeable guides who can help participants understand the science behind the storms. Additionally, the tours often foster a sense of camaraderie among participants, as they bond over their shared passion for weather and adventure. For many, the thrill of the chase and the incredible photographs and memories they capture make the risks worthwhile.

Top 10 Most Damaging Hailstorms in History: A Closer Look

Sydney, Australia – April 14, 1999
Date: April 14, 1999
Cost: $1.7 billion (USD, adjusted for inflation to 2023)
Meteorological Context: A severe supercell thunderstorm developed over the city, producing hailstones up to 9 cm (3.5 inches) in diameter.
Story: The 1999 Sydney hailstorm was a devastating event that caused widespread damage to homes, businesses, and vehicles. The storm lasted for just 30 minutes but left a trail of destruction in its wake.

Munich, Germany – July 12, 1984
Date: July 12, 1984
Cost: $4.8 billion (USD, adjusted for inflation to 2023)
Meteorological Context: A severe thunderstorm system moved over southern Germany, producing hailstones up to 10 cm (4 inches) in diameter.
Story: The Munich hailstorm of 1984 was one of the most destructive in German history. The storm caused extensive damage to buildings, cars, and agricultural crops, with some areas experiencing complete destruction.

Calgary, Canada – September 7, 1991
Date: September 7, 1991
Cost: $1.6 billion (USD, adjusted for inflation to 2023)
Meteorological Context: A severe thunderstorm developed over the city, producing hailstones up to 10 cm (4 inches) in diameter.
Story: The Calgary hailstorm of 1991 was a devastating event that caused significant damage to homes, businesses, and vehicles. The storm lasted for over an hour and left many areas of the city looking like a war zone.

Denver, Colorado, USA – July 11, 1990
Date: July 11, 1990
Cost: $1.4 billion (USD, adjusted for inflation to 2023)
Meteorological Context: A severe thunderstorm developed over the city, producing hailstones up to 10 cm (4 inches) in diameter.
Story: The Denver hailstorm of 1990 was a devastating event that caused significant damage to homes, businesses, and vehicles. The storm lasted for over an hour and caused widespread power outages and transportation disruptions.

Dallas-Fort Worth, Texas, USA – May 5, 1995
Date: May 5, 1995
Cost: $3.6 billion (USD, adjusted for inflation to 2023)
Meteorological Context: A severe thunderstorm system moved over the Dallas-Fort Worth metroplex, producing hailstones up to 11 cm (4.5 inches) in diameter.
Story: The 1995 Dallas-Fort Worth hailstorm was one of the costliest in U.S. history. The storm caused extensive damage to homes, businesses, and vehicles, with some areas experiencing complete destruction.

Phoenix, Arizona, USA – October 5, 2010
Date: October 5, 2010
Cost: $3.5 billion (USD, adjusted for inflation to 2023)
Meteorological Context: A severe thunderstorm system moved over the Phoenix metropolitan area, producing hailstones up to 8 cm (3 inches) in diameter.
Story: The 2010 Phoenix hailstorm was the costliest in Arizona history. The storm caused significant damage to homes, businesses, and vehicles, with some areas experiencing complete destruction.

St. Louis, Missouri, USA – April 10, 2001
Date: April 10, 2001
Cost: $3.6 billion (USD, adjusted for inflation to 2023)
Meteorological Context: A severe thunderstorm system moved over the St. Louis metropolitan area, producing hailstones up to 7 cm (2.75 inches) in diameter.
Story: The 2001 St. Louis hailstorm was a devastating event that caused significant damage to homes, businesses, and vehicles. The storm lasted for several hours and caused widespread power outages and transportation disruptions.

Oklahoma City, Oklahoma, USA – May 16, 2010
Date: May 16, 2010
Cost: $1.4 billion (USD, adjusted for inflation to 2023)
Meteorological Context: A severe thunderstorm system moved over the Oklahoma City metropolitan area, producing hailstones up to 10 cm (4 inches) in diameter.
Story: The 2010 Oklahoma City hailstorm was a devastating event that caused significant damage to homes, businesses, and vehicles. The storm lasted for several hours and caused widespread power outages and transportation disruptions.

Fort Collins, Colorado, USA – July 28, 2016
Date: July 28, 2016
Cost: $1.7 billion (USD, adjusted for inflation to 2023)
Meteorological Context: A severe thunderstorm system moved over the Fort Collins area, producing hailstones up to 10 cm (4 inches) in diameter.
Story: The 2016 Fort Collins hailstorm was a devastating event that caused significant damage to homes, businesses, and vehicles. The storm lasted for several hours and caused widespread power outages and transportation disruptions.

San Antonio, Texas, USA – April 12, 2016
Date: April 12, 2016
Cost: $1.7 billion (USD, adjusted for inflation to 2023)
Meteorological Context: A severe thunderstorm system moved over the San Antonio metropolitan area, producing hailstones up to 11 cm (4.5 inches) in diameter.
Story: The 2016 San Antonio hailstorm was a devastating event that caused significant damage to homes, businesses, and vehicles. The storm lasted for several hours and caused widespread power outages and transportation disruptions.

Forecasting Hailstorms: Predicting When the Sky Falls

Hailstorms, those sudden onslaughts of ice from the sky, can wreak havoc on crops, property, and even lives. Predicting these events is crucial for issuing warnings and minimizing damage. While forecasting hailstorms remains a complex challenge, meteorological science has made significant strides in understanding the conditions that spawn these icy assaults.

Take, for instance, the hailstorm that struck Munich, Germany on July 12, 1984. This devastating event, often referred to as the “Munich Hailstorm”, resulted in over $1 billion in damages, making it one of the costliest hailstorms in history. The hailstones, some reaching the size of tennis balls, pummeled the city, shattering windows, damaging vehicles, and injuring hundreds of people. The storm’s intensity was fueled by a potent combination of atmospheric ingredients: a hot and humid air mass, strong instability, and significant wind shear. These conditions created a supercell thunderstorm with a powerful rotating updraft, the perfect environment for hailstone growth.

Hail forms within these supercell thunderstorms. They possess a rotating updraft, a column of rising air, that can reach speeds exceeding 100 miles per hour. This updraft acts as a hailstone elevator, repeatedly lofting developing hailstones to freezing heights where they accumulate layers of ice. The stronger and more sustained the updraft, the larger the hailstones can grow.

Several key atmospheric ingredients contribute to the formation of hailstorms. Firstly, ample moisture is necessary to fuel the development of the storm clouds and the growth of hailstones. The Munich hailstorm, for example, was preceded by a period of hot and humid weather, creating a moisture-rich environment. Secondly, instability in the atmosphere, often characterized by warm, moist air near the surface and colder air aloft, provides the energy needed for the storm’s powerful updrafts. In the case of Munich, a cold front approaching the city created a sharp temperature contrast, enhancing atmospheric instability. Lastly, wind shear, the change in wind speed and direction with height, plays a critical role in organizing the storm’s rotation and sustaining the updraft, allowing hailstones to grow larger. The Munich hailstorm exhibited significant wind shear, contributing to the storm’s longevity and intensity.

Meteorologists employ a variety of tools and techniques to forecast hailstorms. Doppler radar, for instance, is essential for detecting the presence of hail within a storm. By analyzing the radar echoes, meteorologists can estimate the size and intensity of the hail, along with the storm’s movement and structure. Additionally, sophisticated computer models that simulate atmospheric conditions help predict the likelihood and severity of hailstorms. These models incorporate data from weather balloons, surface observations, and satellites to paint a comprehensive picture of the atmospheric environment. Prior to the Munich hailstorm, meteorologists observed the developing atmospheric conditions and issued warnings of severe thunderstorms with the potential for large hail.

Despite these advancements, forecasting hailstorms remains an imperfect science. The complex interplay of atmospheric factors and the rapid evolution of thunderstorms can make precise predictions challenging. However, continuous research and development in meteorological observation and modeling techniques are steadily improving our ability to anticipate these icy onslaughts, providing crucial lead time for communities to prepare and protect themselves from the devastating impacts of hail.

Hail Forecasting Checklist:

Atmospheric Conditions:

  • Moisture:
    • Surface dewpoint: High dewpoints (above 60°F) indicate ample moisture for hail formation.
    • Precipitable water: Values exceeding 1.5 inches suggest abundant moisture in the atmosphere.
  • Instability:
    • Convective Available Potential Energy (CAPE): CAPE values greater than 2000 J/kg indicate significant instability.
    • Lifted Index (LI): Negative LI values, particularly below -6, suggest strong instability.
  • Wind Shear:
    • Analyze wind speed and direction at different levels (surface, 0-6 km, 0-3 km) to assess wind shear.
    • Look for significant changes in wind speed and/or direction with height, indicating favorable conditions for supercell development and hail growth.

Radar Observations:

  • Reflectivity:
    • Look for strong reflectivity values (exceeding 50 dBZ) suggestive of large hail.
    • Identify bounded weak echo regions (BWER), a radar signature often associated with hail.
  • Doppler Velocity:
    • Analyze for strong inbound/outbound velocity couplets, indicative of a rotating updraft within a supercell.
  • Dual-Polarization:
    • Utilize differential reflectivity (ZDR) and correlation ratio (RhoHV) to differentiate hail from rain and other precipitation types.

Worst Hailstorms:

  • 1. April 2021: A Multi-State Hailstorm Outbreak
  • Locations Affected: This widespread hailstorm event impacted multiple states across the central and southern U.S., including Texas, Oklahoma, Kansas, and Missouri.
  • Damage: Large hail, ranging from golf ball- to baseball-sized, caused extensive damage to homes, businesses, vehicles, and crops. Roofs were punctured, windows shattered, and vehicles were left with significant dents and broken windshields.
  • Cost: The total economic losses from this hailstorm outbreak were estimated to exceed $2 billion (USD), with insured losses surpassing $1.5 billion (USD).

  • 2. April 2017: A Texas-Sized Hailstorm
  • Location Affected: The San Antonio, Texas metropolitan area bore the brunt of this devastating hailstorm.
  • Damage: Hailstones up to 4.5 inches in diameter pummeled the city, causing widespread damage to homes, vehicles, and businesses. The storm also resulted in significant flooding due to the accumulation of hail and heavy rainfall.
  • Cost: The total economic losses from this hailstorm were estimated to be around $1.4 billion (USD), making it one of the costliest hailstorms in Texas history.

  • 3. July 2009: A Colorado Cataclysm
  • Location Affected: The Denver metropolitan area and surrounding communities in Colorado experienced a particularly damaging hailstorm.
  • Damage: Large hail, exceeding 2 inches in diameter in some areas, caused extensive damage to roofs, vehicles, and crops. The storm also led to flash flooding and power outages.
  • Cost: The total insured losses from this hailstorm were estimated to be around $1.4 billion (USD), making it one of the costliest hailstorms in Colorado history.