Tornado Forecasting Checklist

Tornado Forecasting Checklist:

  1. Analyze the synoptic-scale environment:
  • Identify the location and strength of the jet stream:
    • Strong upper-level jet stream (>75 knots) with divergence aloft
    • Jet streak positioning favorable for upper-level support
  • Determine the position and intensity of upper-level troughs and ridges:
    • Negatively tilted trough or closed low approaching the region
    • Difluence in the upper-level wind field
  • Assess the presence and strength of low-level and upper-level wind shear:
    • 0-6 km bulk shear >40 knots
    • 0-1 km storm-relative helicity (SRH) >150 m²/s²
    • 0-3 km SRH >250 m²/s²
  • Evaluate the potential for moisture advection and instability:
    • Moisture pooling with dew points >60°F (15°C)
    • Steep mid-level lapse rates (>6.5°C/km in the 700-500 mb layer)
  1. Assess thermodynamic instability:
  • Analyze soundings for the presence of a “loaded gun” profile:
    • Steep lapse rates in the lowest 3 km of the atmosphere
    • High moisture content in the lower levels (dew points >60°F or 15°C)
    • Strong vertical wind shear (0-6 km bulk shear >40 knots)
  • Calculate convective available potential energy (CAPE) and convective inhibition (CIN):
    • Surface-based CAPE (SBCAPE) >1500 J/kg
    • Mixed-layer CAPE (MLCAPE) >1000 J/kg
    • CIN <50 J/kg
  • Determine the lifted condensation level (LCL) and the level of free convection (LFC):
    • LCL heights <1500 meters AGL
    • LFC heights <2500 meters AGL
  • Evaluate the potential for convective initiation:
    • Presence of a lifting mechanism (frontal boundary, dryline, outflow boundary, etc.)
    • Daytime heating and destabilization of the boundary layer
  1. Identify mesoscale features:
  • Locate frontal boundaries, drylines, and outflow boundaries:
    • Strong moisture gradients and wind shifts along boundaries
    • Confluence and convergence along boundaries
  • Assess the strength and orientation of low-level convergence and upper-level divergence:
    • Surface convergence >10⁻⁴ s⁻¹
    • Upper-level divergence >10⁻⁵ s⁻¹
  • Determine the presence and strength of low-level jets and their role in moisture transport and wind shear:
    • Low-level jet (LLJ) with winds >30 knots at 850 mb
    • LLJ oriented perpendicular to the frontal boundary or dryline
  • Evaluate the potential for mesoscale convective systems (MCSs) and supercell thunderstorms:
    • Presence of a “tail-end Charlie” or “pendant” echo on radar
    • Discrete supercell thunderstorms with strong rotation and hook echoes
  1. Consider composite parameters:
  • Significant Tornado Parameter (STP) >1
  • Supercell Composite Parameter (SCP) >4
  • Energy Helicity Index (EHI) >2
  • Vorticity Generation Parameter (VGP) >0.2

When analyzing soundings for the presence of a “loaded gun” profile, look for the following characteristics:

  1. Steep lapse rates in the lowest 3 km of the atmosphere:
  • Lapse rates should be close to or exceed dry adiabatic (9.8°C/km)
  • Steep lapse rates indicate a highly unstable lower atmosphere
  • This instability allows for rapid vertical acceleration of air parcels, which is crucial for the development of strong updrafts in thunderstorms
  1. High moisture content in the lower levels:
  • Look for dew points greater than 60°F (15°C) in the lowest 1-2 km of the atmosphere
  • High dew points indicate an abundance of moisture, which fuels thunderstorm development and can lead to greater instability
  • Moist air in the lower levels also contributes to lower cloud bases and a greater potential for tornadoes to reach the ground
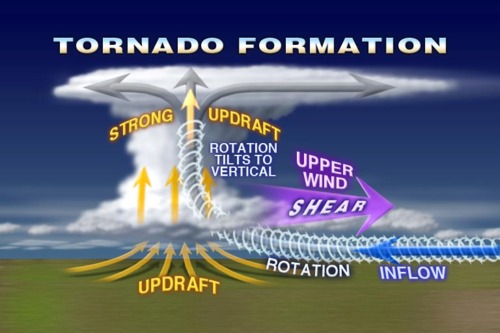
  1. Strong vertical wind shear:
  • 0-6 km bulk shear should exceed 40 knots
  • Strong vertical wind shear is essential for the development of rotating updrafts (mesocyclones) in supercell thunderstorms
  • The change in wind speed and direction with height helps to create a horizontally rotating column of air, which can be tilted vertically by the updraft, leading to the formation of a mesocyclone
  1. Capping inversion:
  • Look for the presence of a capping inversion, typically characterized by a layer of warm, dry air aloft
  • The capping inversion acts as a “lid” on the atmosphere, preventing the premature release of instability
  • This allows for the buildup of energy (CAPE) and moisture in the lower levels, which can be explosively released when the cap is broken, leading to rapid thunderstorm development
  1. Dry air intrusion in the mid-levels:
  • Look for evidence of dry air in the mid-levels of the atmosphere (typically around 700-500 mb)
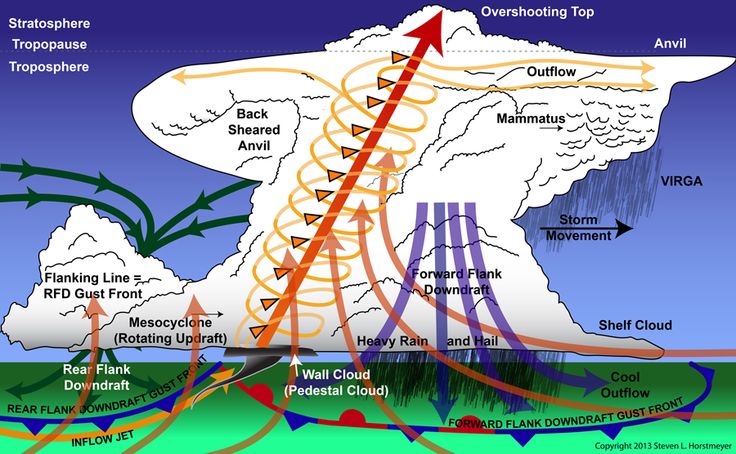
  • Dry air in the mid-levels can enhance the potential for strong downdrafts and the development of rear-flank downdrafts (RFDs) in supercell thunderstorms
  • RFDs play a crucial role in the formation and intensification of tornadoes by providing additional rotation and convergence near the surface

Top 10 Most Damaging Hailstorms in History: A Closer Look

Sydney, Australia – April 14, 1999
Date: April 14, 1999
Cost: $1.7 billion (USD, adjusted for inflation to 2023)
Meteorological Context: A severe supercell thunderstorm developed over the city, producing hailstones up to 9 cm (3.5 inches) in diameter.
Story: The 1999 Sydney hailstorm was a devastating event that caused widespread damage to homes, businesses, and vehicles. The storm lasted for just 30 minutes but left a trail of destruction in its wake.

Munich, Germany – July 12, 1984
Date: July 12, 1984
Cost: $4.8 billion (USD, adjusted for inflation to 2023)
Meteorological Context: A severe thunderstorm system moved over southern Germany, producing hailstones up to 10 cm (4 inches) in diameter.
Story: The Munich hailstorm of 1984 was one of the most destructive in German history. The storm caused extensive damage to buildings, cars, and agricultural crops, with some areas experiencing complete destruction.

Calgary, Canada – September 7, 1991
Date: September 7, 1991
Cost: $1.6 billion (USD, adjusted for inflation to 2023)
Meteorological Context: A severe thunderstorm developed over the city, producing hailstones up to 10 cm (4 inches) in diameter.
Story: The Calgary hailstorm of 1991 was a devastating event that caused significant damage to homes, businesses, and vehicles. The storm lasted for over an hour and left many areas of the city looking like a war zone.

Denver, Colorado, USA – July 11, 1990
Date: July 11, 1990
Cost: $1.4 billion (USD, adjusted for inflation to 2023)
Meteorological Context: A severe thunderstorm developed over the city, producing hailstones up to 10 cm (4 inches) in diameter.
Story: The Denver hailstorm of 1990 was a devastating event that caused significant damage to homes, businesses, and vehicles. The storm lasted for over an hour and caused widespread power outages and transportation disruptions.

Dallas-Fort Worth, Texas, USA – May 5, 1995
Date: May 5, 1995
Cost: $3.6 billion (USD, adjusted for inflation to 2023)
Meteorological Context: A severe thunderstorm system moved over the Dallas-Fort Worth metroplex, producing hailstones up to 11 cm (4.5 inches) in diameter.
Story: The 1995 Dallas-Fort Worth hailstorm was one of the costliest in U.S. history. The storm caused extensive damage to homes, businesses, and vehicles, with some areas experiencing complete destruction.

Phoenix, Arizona, USA – October 5, 2010
Date: October 5, 2010
Cost: $3.5 billion (USD, adjusted for inflation to 2023)
Meteorological Context: A severe thunderstorm system moved over the Phoenix metropolitan area, producing hailstones up to 8 cm (3 inches) in diameter.
Story: The 2010 Phoenix hailstorm was the costliest in Arizona history. The storm caused significant damage to homes, businesses, and vehicles, with some areas experiencing complete destruction.

St. Louis, Missouri, USA – April 10, 2001
Date: April 10, 2001
Cost: $3.6 billion (USD, adjusted for inflation to 2023)
Meteorological Context: A severe thunderstorm system moved over the St. Louis metropolitan area, producing hailstones up to 7 cm (2.75 inches) in diameter.
Story: The 2001 St. Louis hailstorm was a devastating event that caused significant damage to homes, businesses, and vehicles. The storm lasted for several hours and caused widespread power outages and transportation disruptions.

Oklahoma City, Oklahoma, USA – May 16, 2010
Date: May 16, 2010
Cost: $1.4 billion (USD, adjusted for inflation to 2023)
Meteorological Context: A severe thunderstorm system moved over the Oklahoma City metropolitan area, producing hailstones up to 10 cm (4 inches) in diameter.
Story: The 2010 Oklahoma City hailstorm was a devastating event that caused significant damage to homes, businesses, and vehicles. The storm lasted for several hours and caused widespread power outages and transportation disruptions.

Fort Collins, Colorado, USA – July 28, 2016
Date: July 28, 2016
Cost: $1.7 billion (USD, adjusted for inflation to 2023)
Meteorological Context: A severe thunderstorm system moved over the Fort Collins area, producing hailstones up to 10 cm (4 inches) in diameter.
Story: The 2016 Fort Collins hailstorm was a devastating event that caused significant damage to homes, businesses, and vehicles. The storm lasted for several hours and caused widespread power outages and transportation disruptions.

San Antonio, Texas, USA – April 12, 2016
Date: April 12, 2016
Cost: $1.7 billion (USD, adjusted for inflation to 2023)
Meteorological Context: A severe thunderstorm system moved over the San Antonio metropolitan area, producing hailstones up to 11 cm (4.5 inches) in diameter.
Story: The 2016 San Antonio hailstorm was a devastating event that caused significant damage to homes, businesses, and vehicles. The storm lasted for several hours and caused widespread power outages and transportation disruptions.

Forecasting Hailstorms: Predicting When the Sky Falls

Hailstorms, those sudden onslaughts of ice from the sky, can wreak havoc on crops, property, and even lives. Predicting these events is crucial for issuing warnings and minimizing damage. While forecasting hailstorms remains a complex challenge, meteorological science has made significant strides in understanding the conditions that spawn these icy assaults.

Take, for instance, the hailstorm that struck Munich, Germany on July 12, 1984. This devastating event, often referred to as the “Munich Hailstorm”, resulted in over $1 billion in damages, making it one of the costliest hailstorms in history. The hailstones, some reaching the size of tennis balls, pummeled the city, shattering windows, damaging vehicles, and injuring hundreds of people. The storm’s intensity was fueled by a potent combination of atmospheric ingredients: a hot and humid air mass, strong instability, and significant wind shear. These conditions created a supercell thunderstorm with a powerful rotating updraft, the perfect environment for hailstone growth.

Hail forms within these supercell thunderstorms. They possess a rotating updraft, a column of rising air, that can reach speeds exceeding 100 miles per hour. This updraft acts as a hailstone elevator, repeatedly lofting developing hailstones to freezing heights where they accumulate layers of ice. The stronger and more sustained the updraft, the larger the hailstones can grow.

Several key atmospheric ingredients contribute to the formation of hailstorms. Firstly, ample moisture is necessary to fuel the development of the storm clouds and the growth of hailstones. The Munich hailstorm, for example, was preceded by a period of hot and humid weather, creating a moisture-rich environment. Secondly, instability in the atmosphere, often characterized by warm, moist air near the surface and colder air aloft, provides the energy needed for the storm’s powerful updrafts. In the case of Munich, a cold front approaching the city created a sharp temperature contrast, enhancing atmospheric instability. Lastly, wind shear, the change in wind speed and direction with height, plays a critical role in organizing the storm’s rotation and sustaining the updraft, allowing hailstones to grow larger. The Munich hailstorm exhibited significant wind shear, contributing to the storm’s longevity and intensity.

Meteorologists employ a variety of tools and techniques to forecast hailstorms. Doppler radar, for instance, is essential for detecting the presence of hail within a storm. By analyzing the radar echoes, meteorologists can estimate the size and intensity of the hail, along with the storm’s movement and structure. Additionally, sophisticated computer models that simulate atmospheric conditions help predict the likelihood and severity of hailstorms. These models incorporate data from weather balloons, surface observations, and satellites to paint a comprehensive picture of the atmospheric environment. Prior to the Munich hailstorm, meteorologists observed the developing atmospheric conditions and issued warnings of severe thunderstorms with the potential for large hail.

Despite these advancements, forecasting hailstorms remains an imperfect science. The complex interplay of atmospheric factors and the rapid evolution of thunderstorms can make precise predictions challenging. However, continuous research and development in meteorological observation and modeling techniques are steadily improving our ability to anticipate these icy onslaughts, providing crucial lead time for communities to prepare and protect themselves from the devastating impacts of hail.

Hail Forecasting Checklist:

Atmospheric Conditions:

  • Moisture:
    • Surface dewpoint: High dewpoints (above 60°F) indicate ample moisture for hail formation.
    • Precipitable water: Values exceeding 1.5 inches suggest abundant moisture in the atmosphere.
  • Instability:
    • Convective Available Potential Energy (CAPE): CAPE values greater than 2000 J/kg indicate significant instability.
    • Lifted Index (LI): Negative LI values, particularly below -6, suggest strong instability.
  • Wind Shear:
    • Analyze wind speed and direction at different levels (surface, 0-6 km, 0-3 km) to assess wind shear.
    • Look for significant changes in wind speed and/or direction with height, indicating favorable conditions for supercell development and hail growth.

Radar Observations:

  • Reflectivity:
    • Look for strong reflectivity values (exceeding 50 dBZ) suggestive of large hail.
    • Identify bounded weak echo regions (BWER), a radar signature often associated with hail.
  • Doppler Velocity:
    • Analyze for strong inbound/outbound velocity couplets, indicative of a rotating updraft within a supercell.
  • Dual-Polarization:
    • Utilize differential reflectivity (ZDR) and correlation ratio (RhoHV) to differentiate hail from rain and other precipitation types.

Worst Hailstorms:

  • 1. April 2021: A Multi-State Hailstorm Outbreak
  • Locations Affected: This widespread hailstorm event impacted multiple states across the central and southern U.S., including Texas, Oklahoma, Kansas, and Missouri.
  • Damage: Large hail, ranging from golf ball- to baseball-sized, caused extensive damage to homes, businesses, vehicles, and crops. Roofs were punctured, windows shattered, and vehicles were left with significant dents and broken windshields.
  • Cost: The total economic losses from this hailstorm outbreak were estimated to exceed $2 billion (USD), with insured losses surpassing $1.5 billion (USD).

  • 2. April 2017: A Texas-Sized Hailstorm
  • Location Affected: The San Antonio, Texas metropolitan area bore the brunt of this devastating hailstorm.
  • Damage: Hailstones up to 4.5 inches in diameter pummeled the city, causing widespread damage to homes, vehicles, and businesses. The storm also resulted in significant flooding due to the accumulation of hail and heavy rainfall.
  • Cost: The total economic losses from this hailstorm were estimated to be around $1.4 billion (USD), making it one of the costliest hailstorms in Texas history.

  • 3. July 2009: A Colorado Cataclysm
  • Location Affected: The Denver metropolitan area and surrounding communities in Colorado experienced a particularly damaging hailstorm.
  • Damage: Large hail, exceeding 2 inches in diameter in some areas, caused extensive damage to roofs, vehicles, and crops. The storm also led to flash flooding and power outages.
  • Cost: The total insured losses from this hailstorm were estimated to be around $1.4 billion (USD), making it one of the costliest hailstorms in Colorado history.

Arizona’s Monsoon Season: A Dramatic Dance of Dust, Wind and Lightning

For Arizonans, the word “monsoon” evokes a sense of excitement and anticipation. Far from the relentless downpours associated with monsoons in other parts of the world, Arizona’s monsoon season is a unique period of dramatic weather shifts, characterized by powerful thunderstorms, dust storms (haboobs), and bursts of heavy rain.

The Science Behind the Spectacle:

Arizona’s monsoon typically runs from June 15th to September 30th. It’s driven by a shift in wind patterns. During the summer, the intense heating of the land creates a low-pressure zone over the southwestern United States. This draws in moist air from the Gulf of California and the Pacific Ocean, setting the stage for the monsoon’s dramatic displays.

The Haboob: A Wall of Dust

One of the most iconic features of the Arizona monsoon is the haboob, a massive wall of dust that can rise thousands of feet into the air. These impressive, yet intimidating, formations are created when strong thunderstorm downdrafts pick up loose desert soil, creating a rolling wave of dust that can engulf entire cities. While visually stunning, haboobs can significantly reduce visibility, posing hazards for drivers and those with respiratory issues.

Arizona’s monsoon storms can generate intense downdrafts, known as microbursts or downbursts. These sudden bursts of wind can reach speeds of over 100 mph, causing significant damage and posing a hazard to aviation. Microbursts are often associated with lightning activity, as the downdrafts are triggered by the cooling effect of rain and melting hail within the thunderstorm.

Thunderstorms and Flash Floods:

The influx of moist air fuels the development of towering cumulonimbus clouds, leading to localized thunderstorms. These storms can bring intense bursts of rain, lightning, and even hail. While the rain is often welcome in the arid landscape, the intensity can quickly overwhelm the desert terrain, leading to flash floods in washes, canyons, and urban areas.

Benefits and Challenges:

The monsoon plays a crucial role in Arizona’s ecosystem. The rainfall replenishes reservoirs, nourishes vegetation, and provides relief from the scorching summer heat. However, the intense storms can also cause damage to property, disrupt travel, and pose safety risks.

The Great Flood of 1891:

One of the most catastrophic monsoon events in Arizona’s history occurred in February 1891. An unusually intense winter storm brought torrential rainfall to the Salt River Valley, causing the Salt River to overflow its banks. The resulting floodwaters inundated Phoenix and surrounding areas, destroying homes, businesses, and infrastructure. The event highlighted the vulnerability of desert communities to flash flooding and prompted the construction of dams and flood control systems.

The Labor Day Storm of 1970:

On Labor Day weekend in 1970, a powerful monsoon storm unleashed its fury on central Arizona. The storm dumped record rainfall, causing widespread flash floods and significant damage. The Mogollon Rim region was particularly hard hit, with floodwaters carving new canyons and leaving a lasting impact on the landscape. This event served as a stark reminder of the destructive force of flash floods, especially in mountainous areas.

July 1990: A severe microburst struck Phoenix, causing widespread damage and downing hundreds of power lines. Wind speeds were estimated to reach 100 mph.

Hurricane Nora Remnants (1997):

While Arizona is far from hurricane alley, the remnants of tropical storms can occasionally bring heavy rainfall to the state. In 1997, the remnants of Hurricane Nora tracked across Arizona, causing widespread flooding and damage. Yuma experienced record rainfall, leading to significant flooding along the Gila River. This event highlighted the potential for tropical storms to impact Arizona’s monsoon season.

The 2014 Scottsdale Haboob:

A massive dust storm, or haboob, engulfed Scottsdale and surrounding areas in July 2014. The towering wall of dust, estimated to be over 5,000 feet tall, reduced visibility to near zero and caused widespread power outages. The event showcased the dramatic impact of haboobs on urban areas and served as a reminder of the importance of dust storm safety measures.

Preparing for the Monsoon:

Arizonans are accustomed to living with the monsoon’s unpredictable nature. It’s essential to stay informed about weather forecasts, be aware of potential hazards, and take precautions such as:

  • Staying indoors during dust storms and heavy rain.
  • Avoiding low-lying areas prone to flash floods.
  • Securing loose objects around your property.
  • Having an emergency kit prepared.

How Hurricanes Form: The Genesis of a Cyclone

The birth of a hurricane is a fascinating process, often starting from inconspicuous beginnings that evolve into powerful storms capable of wreaking havoc. Let’s delve into the early stages of hurricane development, where seemingly innocuous atmospheric disturbances transform into organized systems with the potential for destruction.

Tropical Wave: The Seed of a Storm

The journey often begins with a tropical wave, an elongated area of low pressure that originates over the warm waters of the tropics, often off the west coast of Africa. These waves, propelled by easterly trade winds, travel westward across the Atlantic Ocean, carrying showers and thunderstorms within their midst. While most tropical waves dissipate harmlessly, some possess the ingredients necessary to evolve into something more ominous.

  • Warm Ocean Waters: Hurricanes draw their energy from warm ocean waters, typically with surface temperatures of at least 80°F (26.5°C). This heat provides the fuel for the storm’s development and intensification.
  • Coriolis Effect: The Earth’s rotation creates a force known as the Coriolis effect, which causes winds to deflect to the right in the Northern Hemisphere and to the left in the Southern Hemisphere. This deflection plays a crucial role in the cyclonic rotation of hurricanes.
  • Low Vertical Wind Shear: Vertical wind shear refers to the change in wind speed and direction with height. Low wind shear allows the storm to develop and maintain its vertical structure, while high wind shear can disrupt the storm’s organization.
  • Pre-existing Disturbance: A pre-existing weather disturbance, such as a tropical wave or a cluster of thunderstorms, provides the initial seed for hurricane formation.

Evolution from Disturbance to Depression:

If a tropical wave encounters these favorable conditions, it can begin to organize and intensify. As thunderstorms cluster around the area of low pressure, a tropical disturbance forms. If the circulation becomes more defined and wind speeds reach up to 38 mph (62 kph), it is classified as a tropical depression.

The Critical Transition to Tropical Storm:

The transition from a tropical depression to a tropical storm marks a significant step in the storm’s development. As the wind speeds increase to 39-73 mph (63-118 kph), the storm becomes more organized and develops a distinct cyclonic circulation. At this stage, it receives a name and is officially recognized as a tropical storm, posing a potential threat to land areas within its path.

Stages of Hurricane Development:

  1. Tropical Disturbance: A cluster of thunderstorms with a weak circulation forms over warm ocean waters.
  2. Tropical Depression: The circulation becomes more organized, and wind speeds reach up to 38 mph (62 kph).
  3. Tropical Storm: Wind speeds increase to 39-73 mph (63-118 kph), and the storm receives a name.
  4. Hurricane: Wind speeds reach 74 mph (119 kph) or higher, and the storm exhibits a well-defined eye surrounded by a ring of intense thunderstorms known as the eyewall.

Eye and Eyewall Dynamics:

The eye of the hurricane is a relatively calm area of low pressure surrounded by the eyewall, the region of highest winds and heaviest rainfall. Air rises rapidly in the eyewall, releasing latent heat and fueling the storm’s intensity. The eye forms as a result of the balance between the inward-flowing air and the upward-rising air in the eyewall.

Factors Influencing Intensity:

Several factors influence hurricane intensity, including:

  • Sea surface temperatures: Warmer waters provide more energy for the storm to intensify.
  • Ocean heat content: The depth of warm water also plays a role, as deeper warm layers provide more sustained energy for the hurricane.
  • Atmospheric moisture: Higher moisture content in the atmosphere can fuel stronger thunderstorms and contribute to intensification.
  • Upper-level atmospheric conditions: Favorable upper-level winds can help vent the storm and promote further intensification.

Understanding Hurricane Categories and Associated Damage

Hurricane categories, based on the Saffir-Simpson Hurricane Wind Scale, classify these storms based on their maximum sustained wind speeds and the potential damage they can inflict. This scale helps communicate the severity of a hurricane and guide preparedness efforts.

Category 1 (74-95 mph):

  • Damage: Primarily to trees and foliage, with some damage to roofs, siding, and unanchored mobile homes. Power outages are likely.
  • Historical Examples: Hurricane Gaston (2004), Hurricane Humberto (2019)

Category 2 (96-110 mph):

  • Damage: Extensive damage to trees and foliage, with significant damage to roofs, siding, and mobile homes. Power outages can last for days or weeks.
  • Historical Examples: Hurricane Frances (2004), Hurricane Zeta (2020)

Category 3 (111-129 mph):

  • Damage: Devastating damage to trees and foliage, with major damage to roofs, siding, and mobile homes. Structural damage to small buildings is possible. Power and water outages can last for extended periods.
  • Historical Examples: Hurricane Katrina (2005), Hurricane Irma (2017)

Category 4 (130-156 mph):

  • Damage: Catastrophic damage to trees and foliage, with severe damage to well-built homes. Roofs can be completely torn off, and exterior walls can collapse. Power outages can last for weeks or even months. Extensive coastal flooding and inland flooding are expected.
  • Historical Examples: Hurricane Harvey (2017), Hurricane Maria (2017)

Category 5 (157 mph or higher):

  • Damage: The most catastrophic damage, with complete roof failure and wall collapse on many residential and industrial buildings. Most trees will be snapped or uprooted. Power outages can last for months, and areas may be uninhabitable for extended periods.
  • Historical Examples: Hurricane Andrew (1992), Hurricane Michael (2018)

Understanding El Niño and La Niña: Impacts on Global Weather Patterns

El Niño and La Niña, naturally occurring climate patterns originating in the tropical Pacific Ocean, have far-reaching effects on weather patterns worldwide. These phenomena, collectively known as the El Niño-Southern Oscillation (ENSO), influence temperature, precipitation, and atmospheric circulation, leading to a cascade of impacts on ecosystems, agriculture, and human societies.

The Science Behind ENSO:

Under normal conditions, trade winds blow westward across the tropical Pacific, pushing warm surface waters towards Indonesia and Australia. This allows cooler water to upwell along the coast of South America. However, during El Niño events, these trade winds weaken or even reverse, causing warm water to spread eastward towards the central and eastern Pacific. Conversely, during La Niña, trade winds strengthen, intensifying the upwelling of cool water in the eastern Pacific and pushing warm water westward.

Impacts of El Niño:

  • Warmer Global Temperatures: El Niño events are typically associated with a rise in global average temperatures, as the release of heat from the tropical Pacific warms the atmosphere.
  • Altered Precipitation Patterns: El Niño can cause increased rainfall in the southern United States and parts of South America, while leading to drier conditions in Indonesia, Australia, and Southeast Asia.
  • Increased Hurricane Activity: The warmer waters in the central and eastern Pacific during El Niño can fuel hurricane formation in the eastern Pacific basin and reduce hurricane activity in the Atlantic basin.

Impacts of La Niña:

  • Cooler Global Temperatures: La Niña events tend to have a cooling effect on global temperatures, as the upwelling of cool water in the eastern Pacific influences atmospheric circulation.
  • Droughts and Floods: La Niña can exacerbate drought conditions in the southwestern United States and South America, while leading to increased rainfall and flooding in Australia, Indonesia, and Southeast Asia.
  • Active Hurricane Seasons: La Niña often corresponds with increased hurricane activity in the Atlantic basin due to reduced wind shear and favorable atmospheric conditions.

Predicting and Monitoring ENSO:

Scientists use a variety of tools, including sea surface temperature measurements, satellite observations, and computer models, to monitor and predict El Niño and La Niña events. While ENSO is a natural cycle, understanding and predicting its phases is crucial for preparing for potential impacts on agriculture, water resources, and disaster management.

Impacts on Society and the Environment:

El Niño and La Niña can have significant socioeconomic and environmental consequences. Droughts and floods can impact agricultural yields, leading to food insecurity and economic losses. Changes in ocean temperatures can disrupt marine ecosystems, affecting fish populations and coastal communities.

Specific Examples of El Niño and La Niña Impacts on Countries:

El Niño Impacts:

  • Peru and Ecuador: El Niño can bring heavy rainfall and flooding to these coastal nations, causing landslides, infrastructure damage, and disruptions to fishing industries due to warmer ocean temperatures. The 1997-98 El Niño event led to devastating floods and economic losses in both countries.
  • Indonesia and Australia: El Niño often results in drier conditions and increased risk of wildfires in these regions. The 2015-16 El Niño contributed to severe droughts and widespread forest fires in Indonesia, causing significant air pollution and economic damage.
  • Southern United States: El Niño can lead to wetter winters in California and the southern US, alleviating drought conditions but also increasing the risk of flooding and mudslides.

La Niña Impacts:

  • East Africa (Kenya, Somalia, Ethiopia): La Niña typically exacerbates drought conditions in East Africa, leading to crop failures, food insecurity, and water scarcity. The 2010-11 La Niña event contributed to a severe famine in Somalia.
  • Australia: La Niña often brings above-average rainfall and increased flooding to eastern Australia. The 2010-11 La Niña event resulted in widespread flooding in Queensland, causing significant damage to infrastructure and agriculture.
  • Southeast Asia (Thailand, Vietnam, Philippines): La Niña can lead to increased rainfall and flooding in Southeast Asia, impacting rice production and increasing the risk of landslides and other natural disasters.

El Niño’s Influence:

  • Hurricanes: El Niño typically suppresses hurricane activity in the Atlantic basin. The increased wind shear in the upper atmosphere during El Niño disrupts the formation and intensification of hurricanes. This means fewer hurricanes make landfall along the US East Coast and Gulf Coast during El Niño years.
  • Tornadoes: The relationship between El Niño and tornadoes in the US is complex and varies regionally. Some studies suggest El Niño can lead to increased tornado activity in the Gulf Coast states during winter and spring, while potentially reducing tornado occurrences in the Great Plains during spring.

La Niña’s Influence:

  • Hurricanes: La Niña often creates favorable conditions for hurricane development in the Atlantic basin. The reduced wind shear and warmer sea surface temperatures provide the necessary ingredients for hurricane formation and intensification. This can lead to more frequent and stronger hurricanes impacting the US East Coast and Gulf Coast during La Niña years.
  • Tornadoes: La Niña can influence tornado activity in the US, particularly in the spring months. The stronger jet stream and increased wind shear associated with La Niña can create a more conducive environment for tornado formation in the Great Plains and Midwest.

The Urban Heat Island Effect: How Cities Influence Local Weather

Cities, with their sprawling concrete landscapes and minimal vegetation, create unique microclimates known as urban heat islands (UHIs). This phenomenon describes the significantly warmer temperatures experienced within urban areas compared to surrounding rural environments. The temperature difference can range from a few degrees to a staggering 22°F (12°C) warmer at night, impacting not only comfort but also energy consumption, air quality, and public health.

Causes of the Urban Heat Island Effect:

  • Reduced Albedo: Dark surfaces like asphalt and concrete absorb more solar radiation than reflective surfaces like vegetation and water, leading to higher surface temperatures.
  • Lack of Evapotranspiration: Plants release water vapor through transpiration, which cools the surrounding air. Urban areas with limited vegetation lack this natural cooling mechanism.
  • Waste Heat Generation: Vehicles, air conditioners, and industrial activities release heat into the urban environment, further elevating temperatures.
  • Building Geometry: Tall buildings and narrow streets create canyons that trap heat and limit air circulation.

Consequences of Urban Heat Islands:

  • Increased Energy Consumption: Higher temperatures lead to greater demand for air conditioning, raising energy consumption and greenhouse gas emissions.
  • Air Quality Impacts: UHIs can exacerbate air pollution by trapping pollutants and promoting the formation of smog. This can lead to respiratory problems and other health issues.
  • Heat-Related Illness: Elevated temperatures increase the risk of heatstroke, heat exhaustion, and other heat-related illnesses, particularly for vulnerable populations like the elderly and young children.
  • Water Quality Impacts: Warmer stormwater runoff can negatively impact aquatic ecosystems by lowering oxygen levels and increasing pollutant concentrations.

Mitigating the Urban Heat Island Effect:

  • Increasing Urban Green Spaces: Planting trees and vegetation can provide shade, promote evapotranspiration, and lower surface temperatures.
  • Cool Roofs and Pavements: Using reflective materials for roofs and pavements can increase albedo and reduce heat absorption.
  • Green Infrastructure: Implementing green roofs, rain gardens, and other green infrastructure elements can manage stormwater runoff and reduce the UHI effect.
  • Urban Design Strategies: Optimizing building placement and street orientation can improve air circulation and reduce heat trapping.
  • New York City: Studies have shown that nighttime temperatures in New York City can be up to 22°F (12°C) warmer than surrounding rural areas due to the UHI effect. This has significant impacts on energy consumption and public health, especially during heatwaves.
  • Phoenix, Arizona: Phoenix experiences one of the most intense UHI effects in the United States. The vast expanse of asphalt and concrete, combined with the desert climate, leads to extreme heat during the day and limited nighttime cooling.
  • Tokyo, Japan: Tokyo has implemented various strategies to mitigate the UHI effect, such as planting trees, installing green roofs, and promoting reflective pavements. These efforts have resulted in measurable reductions in urban temperatures.

The Ultimate Guide to Becoming a Storm Chaser: 

Storm chasing demands more than just a sense of adventure; it requires a solid foundation in meteorology. This section equips aspiring chasers with the essential knowledge to understand the weather phenomena they’ll encounter.

Demystifying the Atmosphere:

  • Atmospheric Layers: Our atmosphere isn’t a uniform blanket; it’s layered. The troposphere, closest to the Earth, is where most weather happens due to its temperature and pressure variations. Above it lies the stratosphere, home to the ozone layer, and beyond that, further layers with decreasing air density. Understanding these layers helps grasp how weather systems form and move.
  • Atmospheric Pressure: Air pressure, the weight of the air above us, is a key weather driver. High-pressure systems generally bring fair weather, while low-pressure systems often lead to clouds and precipitation. The interaction between these systems generates wind, and their movement dictates weather patterns.
  • Temperature and Moisture: These two factors are critical for storm formation. Warm, moist air is less dense and tends to rise, creating instability. As it rises, it cools and condenses, forming clouds and potentially precipitation. The amount of moisture in the air, known as humidity, influences how much energy is available for storms to develop.

Decoding Thunderstorms:

  • Thunderstorm Recipe: Thunderstorms need four key ingredients: instability (warm, moist air near the surface and cooler air aloft), lift (a mechanism to force air upwards), moisture (fuel for cloud and rain formation), and wind shear (changing wind speed and direction with height, which helps storms organize and sustain themselves).
  • Thunderstorm Varieties: Not all thunderstorms are created equal. Single-cell storms are brief and isolated, while multi-cell storms are clusters of cells that can produce heavy rain, hail, and strong winds. Supercells, the most intense type, have a rotating updraft and can spawn tornadoes, large hail, and damaging winds.
  • Thunderstorm Anatomy: Visualize a thunderstorm as a towering engine. The updraft is the rising column of warm, moist air that fuels the storm. The downdraft is the cool air and precipitation descending from the storm. The anvil cloud is the flat, spreading top of the storm, and the flanking line is a line of developing cells feeding into the main updraft. Recognizing these features helps assess a storm’s stage and potential severity.

Tornado Genesis:

  • Supercells and Tornadoes: While not all supercells produce tornadoes, most significant tornadoes come from them. Look for a rotating wall cloud, a lowered area of the storm base with persistent rotation, as a sign that a tornado might form.
  • Tornado Life Cycle: A tornado starts as a funnel cloud extending from the storm base. As it reaches the ground, it becomes a tornado. The mature stage is when the tornado is at its strongest, and it eventually dissipates as the storm weakens or the updraft loses its rotation.
  • Tornado Intensity Scale: The Enhanced Fujita (EF) scale rates tornadoes from EF0 (weakest) to EF5 (strongest) based on the damage they cause. Understanding this scale helps assess the potential danger and provides a common language for describing tornado intensity.

Tools of the Trade:

  • Weather Radar and Satellite Imagery: Radar shows precipitation intensity, storm structure, and rotation, while satellite imagery provides a broader view of cloud patterns and storm systems. Look for hook echoes on radar, a telltale sign of a rotating mesocyclone, and towering cumulonimbus clouds on satellite images, indicating strong updrafts and potential severe weather.
  • Surface Observations and Weather Maps: Analyze surface observations to identify areas of converging winds, temperature and dew point spreads, and pressure falls, all of which can signal storm development. Weather maps depicting fronts, pressure systems, and wind patterns help predict where storms are likely to form and track.
  • Storm Spotter Reports: Trained storm spotters provide real-time ground truth of hail size, wind damage, and tornado sightings. These reports are invaluable for confirming radar-indicated threats and providing situational awareness during a chase.

With a foundational understanding of meteorology, you’re ready to delve into the practical aspects of storm chasing. This section will guide you through the steps involved in planning and executing a safe and successful storm chase.

Preparation is Key:

  • Target Selection: Based on the meteorological factors discussed in Section 1, identify a target area with a high probability of severe weather development. Utilize forecasting tools such as weather models, radar imagery, and surface observations to pinpoint potential hotspots for thunderstorm and tornado formation.
  • Route Planning: Plan your route carefully, considering road networks, potential escape routes, and areas with good visibility of the sky. Be aware of potential hazards such as low-lying areas prone to flooding, and avoid chasing in urban areas where visibility and maneuverability are limited.
  • Vehicle and Equipment: Ensure your vehicle is reliable and in good condition, with a full tank of gas. Essential equipment includes a GPS navigation system, a laptop or tablet with internet access for real-time weather data, a two-way radio for communication, and a camera for documentation.
  • Safety First: Chasing storms inherently involves risks. Always prioritize your safety and the safety of others. Have a plan for seeking shelter in case of a tornado warning, and be aware of lightning dangers. Never attempt to outrun a tornado or drive through flooded roadways.

The Chase is On:

  • Positioning: Once you’ve reached your target area, position yourself for optimal viewing and intercept of the developing storms. Look for visual cues such as towering cumulonimbus clouds, rotating wall clouds, and inflow bands (lines of clouds feeding into the storm).
  • Visual Observations: While radar and other technological tools are valuable, visual observations remain crucial. Pay attention to the storm’s structure, movement, and any signs of rotation or tornado development.
  • Communication and Collaboration: Maintain communication with other chasers or spotters in the area to share information and coordinate observations. Collaboration enhances situational awareness and helps ensure safety during the chase.
  • Documentation: If conditions allow, document the storm’s evolution through photos and videos. This documentation serves as a valuable record of the event and can contribute to scientific research and understanding of severe weather.

Ethics and Responsibility:

  • Respect Private Property: Always seek permission before entering private property. Avoid blocking roadways or interfering with emergency responders.
  • Minimize Environmental Impact: Leave no trace of your presence. Dispose of waste properly and avoid disturbing wildlife or vegetation.
  • Responsible Reporting: If you witness a tornado or other severe weather event, report it to the National Weather Service or local authorities to ensure timely warnings are issued.

Staying ahead of the storm requires access to reliable weather data and forecasting tools. Here’s a list of websites and apps that will empower your storm chasing endeavors:

Government and Official Sources:

  • National Weather Service (weather.gov): The cornerstone of weather information, the NWS provides forecasts, warnings, and radar data for the entire United States. Check local forecasts, severe weather outlooks, and real-time radar imagery to stay informed about potential threats.
  • Storm Prediction Center (spc.noaa.gov): The SPC is your go-to source for convective outlooks, mesoscale discussions, and watches for severe thunderstorms and tornadoes. These resources offer valuable insights into the potential for severe weather and the areas at highest risk.
  • National Hurricane Center (nhc.noaa.gov): For those chasing tropical cyclones, the NHC is indispensable. Get the latest hurricane forecasts, tracks, and potential impacts, ensuring you’re well-prepared during hurricane season.

Radar and Satellite Imagery:

  • College of DuPage NEXLAB (weather.cod.edu): NEXLAB grants access to real-time and archived weather radar data, including super-resolution imagery and storm-tracking tools. Dive deeper into storm structure and evolution with this comprehensive resource.
  • RadarScope (radarscope.com): A favorite among chasers, RadarScope provides real-time radar data with advanced features. Track storm cells, analyze velocity data, and utilize hail detection algorithms to gain a comprehensive understanding of storm dynamics.

Weather Models and Forecasting Tools:

  • Pivotal Weather (pivotalweather.com): Access a suite of weather models, including the GFS and NAM, along with analysis tools and forecast discussions. Pivotal Weather helps you understand the broader atmospheric patterns influencing storm development.
  • WeatherBell Analytics (weatherbell.com): Explore a variety of weather models, forecast maps, and analysis tools, with premium options for more in-depth forecasts. WeatherBell provides insights into the synoptic-scale setup conducive to severe weather.

Mobile Apps:

  • Predict Now (iOS): The ultimate app for serious weather enthusiasts and chasers. Predict Now provides access to:
    • High-resolution radar data
    • NSSL WRF and HRRR weather models
    • GOES-16 satellite imagery
    • Mesoanalysis tools
    • NCEP surface fronts and analysis
    • NAM 3km model data
    • SPC outlooks and mesoanalysis
    • Surface observations
    • Forecast soundings

Community and Educational Resources:

  • Stormtrack Website and Forum (stormtrack.org): Access a wealth of information, discussions, and forecasts from experienced chasers and meteorologists. The Stormtrack forum is a valuable platform for learning and sharing knowledge about severe weather.
  • Facebook Groups: Numerous Facebook groups dedicated to storm chasing and weather offer opportunities to connect with other enthusiasts, share observations, and learn from the experiences of others.

Additional Resources:

  • Spotter Network (spotternetwork.org): This platform allows you to share and access real-time storm reports from trained spotters, providing valuable ground truth information during a chase.

Twister’s Tornadoes: A Triumph of Special Effects and Practical Magic

Twister’s depiction of tornadoes was groundbreaking for its time, setting a new standard for realism in disaster films. The film’s success in portraying these destructive forces was a result of a combination of innovative special effects techniques and clever practical methods.

CGI and Digital Effects:

  • Early Use of CGI: Twister was one of the early films to extensively utilize computer-generated imagery (CGI) to create realistic tornadoes. Industrial Light & Magic (ILM), renowned for their special effects work, used CGI to generate the tornadoes’ funnel clouds, debris fields, and swirling winds. The CGI tornadoes were carefully modeled based on real-world observations and meteorological data, ensuring a level of accuracy that was previously unseen in films.
  • Particle Systems: ILM employed advanced particle systems to simulate the debris fields within the tornadoes. Thousands of individual particles, representing various types of debris, were animated and rendered to create the chaotic and swirling appearance of a tornado’s destructive path.

Practical Effects:

  • Debris cannons and wind machines: To complement the CGI effects, the filmmakers utilized a variety of practical effects to create a sense of realism and immersion. Debris cannons were used to launch objects into the air, simulating the flying debris often associated with tornadoes. Powerful wind machines generated strong gusts, adding to the chaotic atmosphere and making the actors’ performances more believable.
  • Full-Scale Sets: The production team built full-scale sets of houses, barns, and other structures, which were then subjected to the forces of wind machines and debris cannons to create realistic destruction sequences. These practical effects provided a tangible sense of the tornadoes’ destructive power and added depth to the film’s visual effects.

Realism and Accuracy:

  • Collaboration with Meteorologists: The filmmakers consulted with meteorologists and storm chasers to ensure a level of accuracy in portraying tornadoes and the experience of chasing them. This collaboration helped to inform the film’s visual effects and the depiction of storm chasing procedures and equipment.
  • Accurate Depiction of Tornado Behavior: Twister accurately captures several aspects of tornado behavior, including their unpredictable movements, the formation of multiple vortices, and the destructive power of their winds. The film also highlights the dangers associated with tornadoes and the importance of seeking shelter when a tornado warning is issued.

Tornadoes of Twister:

  • The Finger of God: The first major tornado encounter occurs when the team chases a large twister nicknamed “The Finger of God.” This scene showcases the tornado’s immense size and its ability to level structures in its path. The team deploys their research equipment, Dorothy, but it is destroyed before it can collect any data.
  • The Drive-In Tornado: In a visually striking scene, a tornado tears through a drive-in movie theater, tossing cars and debris through the air. The scene highlights the chaotic and unpredictable nature of tornadoes, as well as the danger they pose to anyone caught in their path.
  • The Greenage Tornado: The team encounters a massive wedge tornado near the town of Greenage. This scene is particularly memorable for its depiction of the tornado’s multiple vortices, showcasing the complex structure of these storms. The team successfully deploys Dorothy within the tornado, but it is ripped apart by the extreme winds.
  • The Final Chase: The climax of the film involves a chase with a violent F5 tornado. This scene features some of the most intense and destructive tornado footage in the movie, with houses being completely obliterated and debris swirling through the air. The team finally succeeds in deploying Dorothy within the tornado, collecting valuable data before being caught in the storm’s path.