How Hurricanes Form: The Genesis of a Cyclone

The birth of a hurricane is a fascinating process, often starting from inconspicuous beginnings that evolve into powerful storms capable of wreaking havoc. Let’s delve into the early stages of hurricane development, where seemingly innocuous atmospheric disturbances transform into organized systems with the potential for destruction.

Tropical Wave: The Seed of a Storm

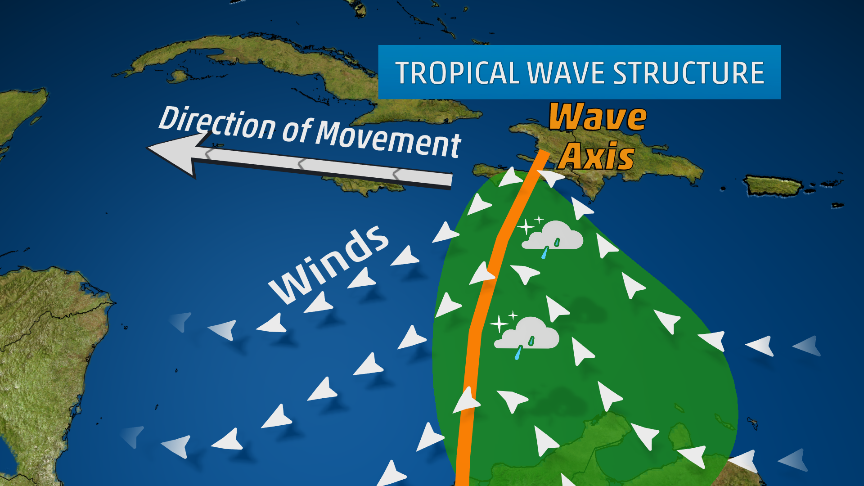
The journey often begins with a tropical wave, an elongated area of low pressure that originates over the warm waters of the tropics, often off the west coast of Africa. These waves, propelled by easterly trade winds, travel westward across the Atlantic Ocean, carrying showers and thunderstorms within their midst. While most tropical waves dissipate harmlessly, some possess the ingredients necessary to evolve into something more ominous.

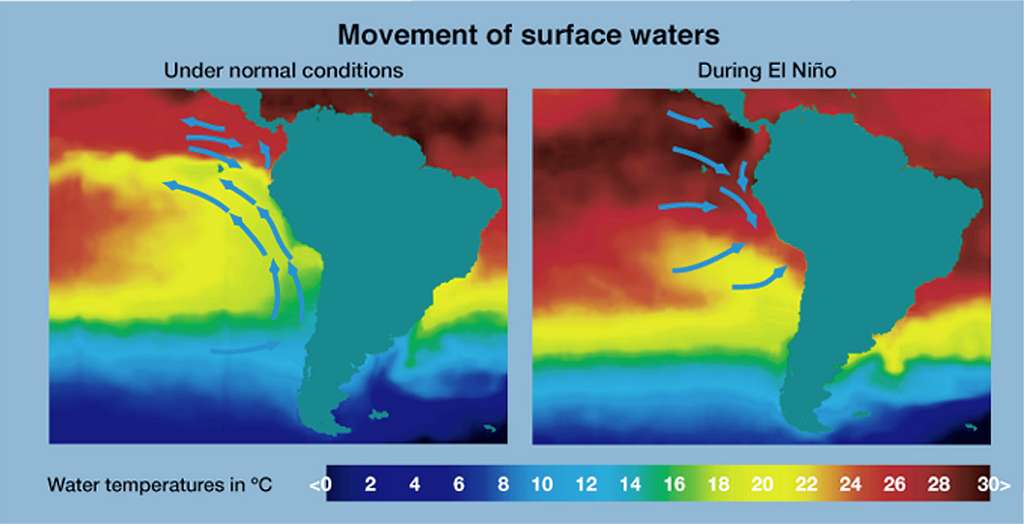
  • Warm Ocean Waters: Hurricanes draw their energy from warm ocean waters, typically with surface temperatures of at least 80°F (26.5°C). This heat provides the fuel for the storm’s development and intensification.
  • Coriolis Effect: The Earth’s rotation creates a force known as the Coriolis effect, which causes winds to deflect to the right in the Northern Hemisphere and to the left in the Southern Hemisphere. This deflection plays a crucial role in the cyclonic rotation of hurricanes.
  • Low Vertical Wind Shear: Vertical wind shear refers to the change in wind speed and direction with height. Low wind shear allows the storm to develop and maintain its vertical structure, while high wind shear can disrupt the storm’s organization.
  • Pre-existing Disturbance: A pre-existing weather disturbance, such as a tropical wave or a cluster of thunderstorms, provides the initial seed for hurricane formation.

Evolution from Disturbance to Depression:

If a tropical wave encounters these favorable conditions, it can begin to organize and intensify. As thunderstorms cluster around the area of low pressure, a tropical disturbance forms. If the circulation becomes more defined and wind speeds reach up to 38 mph (62 kph), it is classified as a tropical depression.

The Critical Transition to Tropical Storm:

The transition from a tropical depression to a tropical storm marks a significant step in the storm’s development. As the wind speeds increase to 39-73 mph (63-118 kph), the storm becomes more organized and develops a distinct cyclonic circulation. At this stage, it receives a name and is officially recognized as a tropical storm, posing a potential threat to land areas within its path.

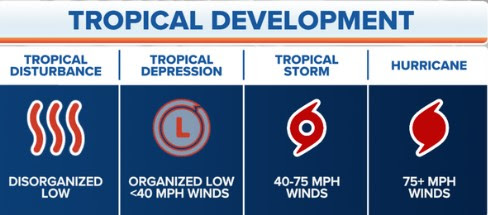
Stages of Hurricane Development:

  1. Tropical Disturbance: A cluster of thunderstorms with a weak circulation forms over warm ocean waters.
  2. Tropical Depression: The circulation becomes more organized, and wind speeds reach up to 38 mph (62 kph).
  3. Tropical Storm: Wind speeds increase to 39-73 mph (63-118 kph), and the storm receives a name.
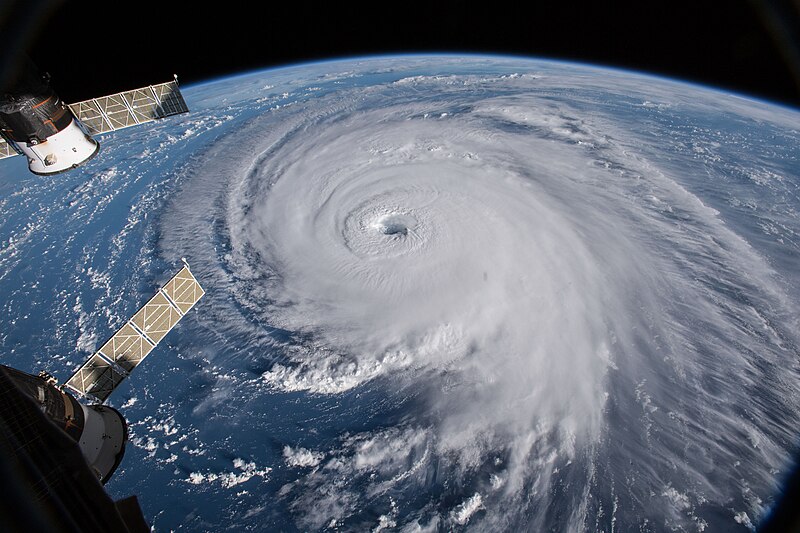
  4. Hurricane: Wind speeds reach 74 mph (119 kph) or higher, and the storm exhibits a well-defined eye surrounded by a ring of intense thunderstorms known as the eyewall.

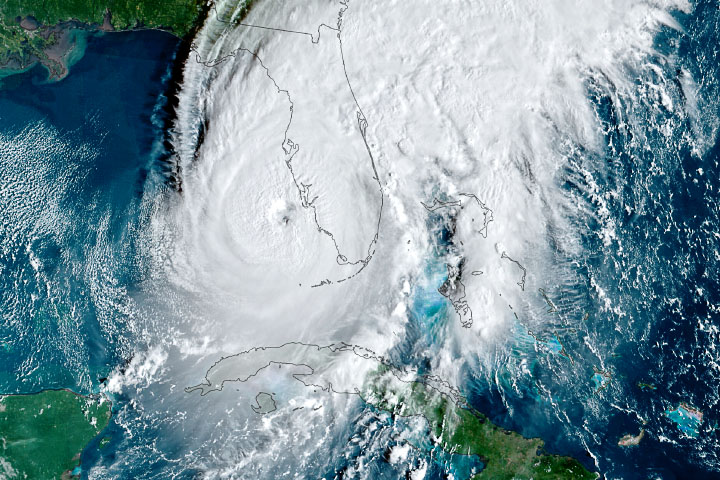
Eye and Eyewall Dynamics:

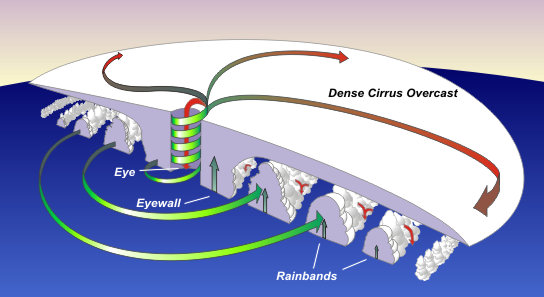
The eye of the hurricane is a relatively calm area of low pressure surrounded by the eyewall, the region of highest winds and heaviest rainfall. Air rises rapidly in the eyewall, releasing latent heat and fueling the storm’s intensity. The eye forms as a result of the balance between the inward-flowing air and the upward-rising air in the eyewall.

Factors Influencing Intensity:

Several factors influence hurricane intensity, including:

  • Sea surface temperatures: Warmer waters provide more energy for the storm to intensify.
  • Ocean heat content: The depth of warm water also plays a role, as deeper warm layers provide more sustained energy for the hurricane.
  • Atmospheric moisture: Higher moisture content in the atmosphere can fuel stronger thunderstorms and contribute to intensification.
  • Upper-level atmospheric conditions: Favorable upper-level winds can help vent the storm and promote further intensification.

Understanding Hurricane Categories and Associated Damage

Hurricane categories, based on the Saffir-Simpson Hurricane Wind Scale, classify these storms based on their maximum sustained wind speeds and the potential damage they can inflict. This scale helps communicate the severity of a hurricane and guide preparedness efforts.

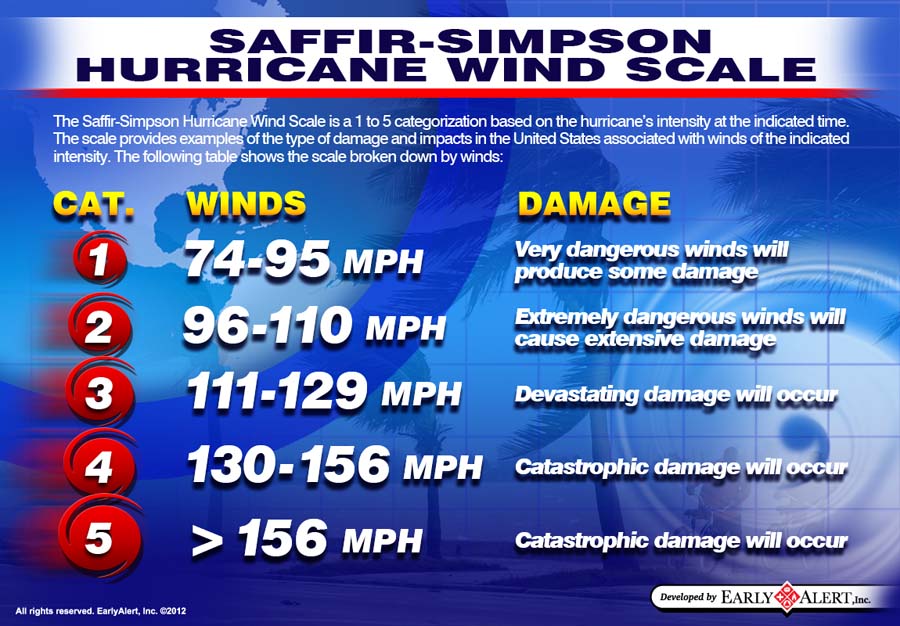
Category 1 (74-95 mph):

  • Damage: Primarily to trees and foliage, with some damage to roofs, siding, and unanchored mobile homes. Power outages are likely.
  • Historical Examples: Hurricane Gaston (2004), Hurricane Humberto (2019)

Category 2 (96-110 mph):

  • Damage: Extensive damage to trees and foliage, with significant damage to roofs, siding, and mobile homes. Power outages can last for days or weeks.
  • Historical Examples: Hurricane Frances (2004), Hurricane Zeta (2020)

Category 3 (111-129 mph):

  • Damage: Devastating damage to trees and foliage, with major damage to roofs, siding, and mobile homes. Structural damage to small buildings is possible. Power and water outages can last for extended periods.
  • Historical Examples: Hurricane Katrina (2005), Hurricane Irma (2017)

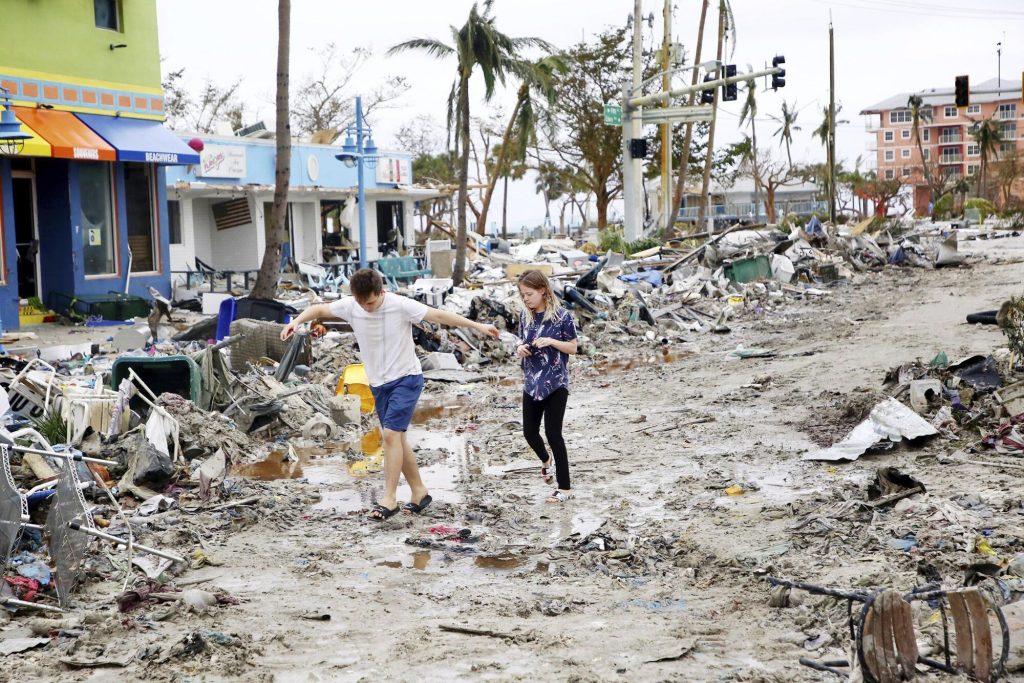
Category 4 (130-156 mph):

  • Damage: Catastrophic damage to trees and foliage, with severe damage to well-built homes. Roofs can be completely torn off, and exterior walls can collapse. Power outages can last for weeks or even months. Extensive coastal flooding and inland flooding are expected.
  • Historical Examples: Hurricane Harvey (2017), Hurricane Maria (2017)

Category 5 (157 mph or higher):

  • Damage: The most catastrophic damage, with complete roof failure and wall collapse on many residential and industrial buildings. Most trees will be snapped or uprooted. Power outages can last for months, and areas may be uninhabitable for extended periods.
  • Historical Examples: Hurricane Andrew (1992), Hurricane Michael (2018)

Understanding El Niño and La Niña: Impacts on  Global Weather Patterns

El Niño and La Niña, naturally occurring climate patterns originating in the tropical Pacific Ocean, have far-reaching effects on weather patterns worldwide. These phenomena, collectively known as the El Niño-Southern Oscillation (ENSO), influence temperature, precipitation, and atmospheric circulation, leading to a cascade of impacts on ecosystems, agriculture, and human societies.

The Science Behind ENSO:

Under normal conditions, trade winds blow westward across the tropical Pacific, pushing warm surface waters towards Indonesia and Australia. This allows cooler water to upwell along the coast of South America. However, during El Niño events, these trade winds weaken or even reverse, causing warm water to spread eastward towards the central and eastern Pacific. Conversely, during La Niña, trade winds strengthen, intensifying the upwelling of cool water in the eastern Pacific and pushing warm water westward.

Impacts of El Niño:

  • Warmer Global Temperatures: El Niño events are typically associated with a rise in global average temperatures, as the release of heat from the tropical Pacific warms the atmosphere.
  • Altered Precipitation Patterns: El Niño can cause increased rainfall in the southern United States and parts of South America, while leading to drier conditions in Indonesia, Australia, and Southeast Asia.
  • Increased Hurricane Activity: The warmer waters in the central and eastern Pacific during El Niño can fuel hurricane formation in the eastern Pacific basin and reduce hurricane activity in the Atlantic basin.

Predicting and Monitoring ENSO:

Impacts of La Niña:

  • Cooler Global Temperatures: La Niña events tend to have a cooling effect on global temperatures, as the upwelling of cool water in the eastern Pacific influences atmospheric circulation.
  • Droughts and Floods: La Niña can exacerbate drought conditions in the southwestern United States and South America, while leading to increased rainfall and flooding in Australia, Indonesia, and Southeast Asia.
  • Active Hurricane Seasons: La Niña often corresponds with increased hurricane activity in the Atlantic basin due to reduced wind shear and favorable atmospheric conditions.

Scientists use a variety of tools, including sea surface temperature measurements, satellite observations, and computer models, to monitor and predict El Niño and La Niña events. While ENSO is a natural cycle, understanding and predicting its phases is crucial for preparing for potential impacts on agriculture, water resources, and disaster management.

Impacts on Society and the Environment:

El Niño and La Niña can have significant socioeconomic and environmental consequences. Droughts and floods can impact agricultural yields, leading to food insecurity and economic losses. Changes in ocean temperatures can disrupt marine ecosystems, affecting fish populations and coastal communities.

Specific Examples of El Niño and La Niña Impacts on Countries:

El Niño Impacts:

  • Peru and Ecuador: El Niño can bring heavy rainfall and flooding to these coastal nations, causing landslides, infrastructure damage, and disruptions to fishing industries due to warmer ocean temperatures. The 1997-98 El Niño event led to devastating floods and economic losses in both countries.
  • Indonesia and Australia: El Niño often results in drier conditions and increased risk of wildfires in these regions. The 2015-16 El Niño contributed to severe droughts and widespread forest fires in Indonesia, causing significant air pollution and economic damage.
  • Southern United States: El Niño can lead to wetter winters in California and the southern US, alleviating drought conditions but also increasing the risk of flooding and mudslides.

La Niña Impacts:

  • East Africa (Kenya, Somalia, Ethiopia): La Niña typically exacerbates drought conditions in East Africa, leading to crop failures, food insecurity, and water scarcity. The 2010-11 La Niña event contributed to a severe famine in Somalia.
  • Australia: La Niña often brings above-average rainfall and increased flooding to eastern Australia. The 2010-11 La Niña event resulted in widespread flooding in Queensland, causing significant damage to infrastructure and agriculture.
  • Southeast Asia (Thailand, Vietnam, Philippines): La Niña can lead to increased rainfall and flooding in Southeast Asia, impacting rice production and increasing the risk of landslides and other natural disasters.

El Niño’s Influence:

  • Hurricanes: El Niño typically suppresses hurricane activity in the Atlantic basin. The increased wind shear in the upper atmosphere during El Niño disrupts the formation and intensification of hurricanes. This means fewer hurricanes make landfall along the US East Coast and Gulf Coast during El Niño years.
  • Tornadoes: The relationship between El Niño and tornadoes in the US is complex and varies regionally. Some studies suggest El Niño can lead to increased tornado activity in the Gulf Coast states during winter and spring, while potentially reducing tornado occurrences in the Great Plains during spring.

La Niña’s Influence:

  • Hurricanes: La Niña often creates favorable conditions for hurricane development in the Atlantic basin. The reduced wind shear and warmer sea surface temperatures provide the necessary ingredients for hurricane formation and intensification. This can lead to more frequent and stronger hurricanes impacting the US East Coast and Gulf Coast during La Niña years.
  • Tornadoes: La Niña can influence tornado activity in the US, particularly in the spring months. The stronger jet stream and increased wind shear associated with La Niña can create a more conducive environment for tornado formation in the Great Plains and Midwest.

The Urban Heat Island Effect: How Cities Influence Local Weather

Cities, with their sprawling concrete landscapes and minimal vegetation, create unique microclimates known as urban heat islands (UHIs). This phenomenon describes the significantly warmer temperatures experienced within urban areas compared to surrounding rural environments. The temperature difference can range from a few degrees to a staggering 22°F (12°C) warmer at night, impacting not only comfort but also energy consumption, air quality, and public health.

Causes of the Urban Heat Island Effect:

  • Reduced Albedo: Dark surfaces like asphalt and concrete absorb more solar radiation than reflective surfaces like vegetation and water, leading to higher surface temperatures.
  • Lack of Evapotranspiration: Plants release water vapor through transpiration, which cools the surrounding air. Urban areas with limited vegetation lack this natural cooling mechanism.
  • Waste Heat Generation: Vehicles, air conditioners, and industrial activities release heat into the urban environment, further elevating temperatures.
  • Building Geometry: Tall buildings and narrow streets create canyons that trap heat and limit air circulation.

Consequences of Urban Heat Islands:

  • Increased Energy Consumption: Higher temperatures lead to greater demand for air conditioning, raising energy consumption and greenhouse gas emissions.
  • Air Quality Impacts: UHIs can exacerbate air pollution by trapping pollutants and promoting the formation of smog. This can lead to respiratory problems and other health issues.
  • Heat-Related Illness: Elevated temperatures increase the risk of heatstroke, heat exhaustion, and other heat-related illnesses, particularly for vulnerable populations like the elderly and young children.
  • Water Quality Impacts: Warmer stormwater runoff can negatively impact aquatic ecosystems by lowering oxygen levels and increasing pollutant concentrations.

Mitigating the Urban Heat Island Effect:

  • Increasing Urban Green Spaces: Planting trees and vegetation can provide shade, promote evapotranspiration, and lower surface temperatures.
  • Cool Roofs and Pavements: Using reflective materials for roofs and pavements can increase albedo and reduce heat absorption.
  • Green Infrastructure: Implementing green roofs, rain gardens, and other green infrastructure elements can manage stormwater runoff and reduce the UHI effect.
  • Urban Design Strategies: Optimizing building placement and street orientation can improve air circulation and reduce heat trapping.
  • New York City: Studies have shown that nighttime temperatures in New York City can be up to 22°F (12°C) warmer than surrounding rural areas due to the UHI effect. This has significant impacts on energy consumption and public health, especially during heatwaves.
  • Phoenix, Arizona: Phoenix experiences one of the most intense UHI effects in the United States. The vast expanse of asphalt and concrete, combined with the desert climate, leads to extreme heat during the day and limited nighttime cooling.
  • Tokyo, Japan: Tokyo has implemented various strategies to mitigate the UHI effect, such as planting trees, installing green roofs, and promoting reflective pavements. These efforts have resulted in measurable reductions in urban temperatures.

The Ultimate Guide to Becoming a Storm Chaser

Storm chasing demands more than just a sense of adventure; it requires a solid foundation in meteorology. This section equips aspiring chasers with the essential knowledge to understand the weather phenomena they’ll encounter.

Demystifying the Atmosphere:

  • Atmospheric Layers: Our atmosphere isn’t a uniform blanket; it’s layered. The troposphere, closest to the Earth, is where most weather happens due to its temperature and pressure variations. Above it lies the stratosphere, home to the ozone layer, and beyond that, further layers with decreasing air density. Understanding these layers helps grasp how weather systems form and move.
  • Atmospheric Pressure: Air pressure, the weight of the air above us, is a key weather driver. High-pressure systems generally bring fair weather, while low-pressure systems often lead to clouds and precipitation. The interaction between these systems generates wind, and their movement dictates weather patterns.
  • Temperature and Moisture: These two factors are critical for storm formation. Warm, moist air is less dense and tends to rise, creating instability. As it rises, it cools and condenses, forming clouds and potentially precipitation. The amount of moisture in the air, known as humidity, influences how much energy is available for storms to develop.

Decoding Thunderstorms:

  • Thunderstorm Recipe: Thunderstorms need four key ingredients: instability (warm, moist air near the surface and cooler air aloft), lift (a mechanism to force air upwards), moisture (fuel for cloud and rain formation), and wind shear (changing wind speed and direction with height, which helps storms organize and sustain themselves).
  • Thunderstorm Varieties: Not all thunderstorms are created equal. Single-cell storms are brief and isolated, while multi-cell storms are clusters of cells that can produce heavy rain, hail, and strong winds. Supercells, the most intense type, have a rotating updraft and can spawn tornadoes, large hail, and damaging winds.
  • Thunderstorm Anatomy: Visualize a thunderstorm as a towering engine. The updraft is the rising column of warm, moist air that fuels the storm. The downdraft is the cool air and precipitation descending from the storm. The anvil cloud is the flat, spreading top of the storm, and the flanking line is a line of developing cells feeding into the main updraft. Recognizing these features helps assess a storm’s stage and potential severity.

Tornado Genesis:

  • Supercells and Tornadoes: While not all supercells produce tornadoes, most significant tornadoes come from them. Look for a rotating wall cloud, a lowered area of the storm base with persistent rotation, as a sign that a tornado might form.
  • Tornado Life Cycle: A tornado starts as a funnel cloud extending from the storm base. As it reaches the ground, it becomes a tornado. The mature stage is when the tornado is at its strongest, and it eventually dissipates as the storm weakens or the updraft loses its rotation.
  • Tornado Intensity Scale: The Enhanced Fujita (EF) scale rates tornadoes from EF0 (weakest) to EF5 (strongest) based on the damage they cause. Understanding this scale helps assess the potential danger and provides a common language for describing tornado intensity.

Tools of the Trade:

  • Weather Radar and Satellite Imagery: Radar shows precipitation intensity, storm structure, and rotation, while satellite imagery provides a broader view of cloud patterns and storm systems. Look for hook echoes on radar, a telltale sign of a rotating mesocyclone, and towering cumulonimbus clouds on satellite images, indicating strong updrafts and potential severe weather.
  • Surface Observations and Weather Maps: Analyze surface observations to identify areas of converging winds, temperature and dew point spreads, and pressure falls, all of which can signal storm development. Weather maps depicting fronts, pressure systems, and wind patterns help predict where storms are likely to form and track.
  • Storm Spotter Reports: Trained storm spotters provide real-time ground truth of hail size, wind damage, and tornado sightings. These reports are invaluable for confirming radar-indicated threats and providing situational awareness during a chase.

With a foundational understanding of meteorology, you’re ready to delve into the practical aspects of storm chasing. This section will guide you through the steps involved in planning and executing a safe and successful storm chase.

Preparation is Key:

  • Target Selection: Based on the meteorological factors discussed in Section 1, identify a target area with a high probability of severe weather development. Utilize forecasting tools such as weather models, radar imagery, and surface observations to pinpoint potential hotspots for thunderstorm and tornado formation.
  • Route Planning: Plan your route carefully, considering road networks, potential escape routes, and areas with good visibility of the sky. Be aware of potential hazards such as low-lying areas prone to flooding, and avoid chasing in urban areas where visibility and maneuverability are limited.
  • Vehicle and Equipment: Ensure your vehicle is reliable and in good condition, with a full tank of gas. Essential equipment includes a GPS navigation system, a laptop or tablet with internet access for real-time weather data, a two-way radio for communication, and a camera for documentation.
  • Safety First: Chasing storms inherently involves risks. Always prioritize your safety and the safety of others. Have a plan for seeking shelter in case of a tornado warning, and be aware of lightning dangers. Never attempt to outrun a tornado or drive through flooded roadways.

The Chase is On:

  • Positioning: Once you’ve reached your target area, position yourself for optimal viewing and intercept of the developing storms. Look for visual cues such as towering cumulonimbus clouds, rotating wall clouds, and inflow bands (lines of clouds feeding into the storm).
  • Visual Observations: While radar and other technological tools are valuable, visual observations remain crucial. Pay attention to the storm’s structure, movement, and any signs of rotation or tornado development.
  • Communication and Collaboration: Maintain communication with other chasers or spotters in the area to share information and coordinate observations. Collaboration enhances situational awareness and helps ensure safety during the chase.
  • Documentation: If conditions allow, document the storm’s evolution through photos and videos. This documentation serves as a valuable record of the event and can contribute to scientific research and understanding of severe weather.

Ethics and Responsibility:

  • Respect Private Property: Always seek permission before entering private property. Avoid blocking roadways or interfering with emergency responders.
  • Minimize Environmental Impact: Leave no trace of your presence. Dispose of waste properly and avoid disturbing wildlife or vegetation.
  • Responsible Reporting: If you witness a tornado or other severe weather event, report it to the National Weather Service or local authorities to ensure timely warnings are issued.

Staying ahead of the storm requires access to reliable weather data and forecasting tools. Here’s a list of websites and apps that will empower your storm chasing endeavors:

Government and Official Sources:

  • National Weather Service (weather.gov): The cornerstone of weather information, the NWS provides forecasts, warnings, and radar data for the entire United States. Check local forecasts, severe weather outlooks, and real-time radar imagery to stay informed about potential threats.
  • Storm Prediction Center (spc.noaa.gov): The SPC is your go-to source for convective outlooks, mesoscale discussions, and watches for severe thunderstorms and tornadoes. These resources offer valuable insights into the potential for severe weather and the areas at highest risk.
  • National Hurricane Center (nhc.noaa.gov): For those chasing tropical cyclones, the NHC is indispensable. Get the latest hurricane forecasts, tracks, and potential impacts, ensuring you’re well-prepared during hurricane season.

Radar and Satellite Imagery:

  • College of DuPage NEXLAB (weather.cod.edu): NEXLAB grants access to real-time and archived weather radar data, including super-resolution imagery and storm-tracking tools. Dive deeper into storm structure and evolution with this comprehensive resource.
  • RadarScope (radarscope.com): A favorite among chasers, RadarScope provides real-time radar data with advanced features. Track storm cells, analyze velocity data, and utilize hail detection algorithms to gain a comprehensive understanding of storm dynamics.

Weather Models and Forecasting Tools:

  • Pivotal Weather (pivotalweather.com): Access a suite of weather models, including the GFS and NAM, along with analysis tools and forecast discussions. Pivotal Weather helps you understand the broader atmospheric patterns influencing storm development.
  • WeatherBell Analytics (weatherbell.com): Explore a variety of weather models, forecast maps, and analysis tools, with premium options for more in-depth forecasts. WeatherBell provides insights into the synoptic-scale setup conducive to severe weather.

Mobile Apps:

  • Predict Now (iOS): The ultimate app for serious weather enthusiasts and chasers. Predict Now provides access to:
  • High-resolution radar data
  • NSSL WRF and HRRR weather models
  • GOES-16 satellite imagery
  • Mesoanalysis tools
  • NCEP surface fronts and analysis
  • NAM 3km model data
  • SPC outlooks and mesoanalysis
  • Surface observations
  • Forecast soundings

Community and Educational Resources:

  • Stormtrack Website and Forum (stormtrack.org): Access a wealth of information, discussions, and forecasts from experienced chasers and meteorologists. The Stormtrack forum is a valuable platform for learning and sharing knowledge about severe weather.
  • Facebook Groups: Numerous Facebook groups dedicated to storm chasing and weather offer opportunities to connect with other enthusiasts, share observations, and learn from the experiences of others.

Additional Resources:

  • Spotter Network (spotternetwork.org): This platform allows you to share and access real-time storm reports from trained spotters, providing valuable ground truth information during a chase.

Twister’s Tornadoes: A Triumph of Special Effects and Practical Magic

Twister’s depiction of tornadoes was groundbreaking for its time, setting a new standard for realism in disaster films. The film’s success in portraying these destructive forces was a result of a combination of innovative special effects techniques and clever practical methods.

CGI and Digital Effects:

  • Early Use of CGI: Twister was one of the early films to extensively utilize computer-generated imagery (CGI) to create realistic tornadoes. Industrial Light & Magic (ILM), renowned for their special effects work, used CGI to generate the tornadoes’ funnel clouds, debris fields, and swirling winds. The CGI tornadoes were carefully modeled based on real-world observations and meteorological data, ensuring a level of accuracy that was previously unseen in films.
  • Particle Systems: ILM employed advanced particle systems to simulate the debris fields within the tornadoes. Thousands of individual particles, representing various types of debris, were animated and rendered to create the chaotic and swirling appearance of a tornado’s destructive path.

Practical Effects:

  • Debris cannons and wind machines: To complement the CGI effects, the filmmakers utilized a variety of practical effects to create a sense of realism and immersion. Debris cannons were used to launch objects into the air, simulating the flying debris often associated with tornadoes. Powerful wind machines generated strong gusts, adding to the chaotic atmosphere and making the actors’ performances more believable.
  • Full-Scale Sets: The production team built full-scale sets of houses, barns, and other structures, which were then subjected to the forces of wind machines and debris cannons to create realistic destruction sequences. These practical effects provided a tangible sense of the tornadoes’ destructive power and added depth to the film’s visual effects.

Realism and Accuracy:

  • Collaboration with Meteorologists: The filmmakers consulted with meteorologists and storm chasers to ensure a level of accuracy in portraying tornadoes and the experience of chasing them. This collaboration helped to inform the film’s visual effects and the depiction of storm chasing procedures and equipment.
  • Accurate Depiction of Tornado Behavior: Twister accurately captures several aspects of tornado behavior, including their unpredictable movements, the formation of multiple vortices, and the destructive power of their winds. The film also highlights the dangers associated with tornadoes and the importance of seeking shelter when a tornado warning is issued.

Tornadoes of Twister:

  • The Finger of God: The first major tornado encounter occurs when the team chases a large twister nicknamed “The Finger of God.” This scene showcases the tornado’s immense size and its ability to level structures in its path. The team deploys their research equipment, Dorothy, but it is destroyed before it can collect any data.
  • The Drive-In Tornado: In a visually striking scene, a tornado tears through a drive-in movie theater, tossing cars and debris through the air. The scene highlights the chaotic and unpredictable nature of tornadoes, as well as the danger they pose to anyone caught in their path.
  • The Greenage Tornado: The team encounters a massive wedge tornado near the town of Greenage. This scene is particularly memorable for its depiction of the tornado’s multiple vortices, showcasing the complex structure of these storms. The team successfully deploys Dorothy within the tornado, but it is ripped apart by the extreme winds.
  • The Final Chase: The climax of the film involves a chase with a violent F5 tornado. This scene features some of the most intense and destructive tornado footage in the movie, with houses being completely obliterated and debris swirling through the air. The team finally succeeds in deploying Dorothy within the tornado, collecting valuable data before being caught in the storm’s path.

The El Reno Tornado: A Colossus on the Oklahoma Plains – May 31, 2013

The late afternoon of May 31, 2013, witnessed the birth of a meteorological monster on the open plains west of Oklahoma City – the El Reno tornado. This colossal twister, eventually reaching a staggering 2.6 miles wide, etched its name in history as the widest tornado ever recorded. Its immense size and erratic behavior posed a significant challenge for storm chasers and researchers, ultimately claiming the lives of three experienced storm chasers who were caught in its unpredictable path.

The day began with a heightened sense of awareness among meteorologists and storm chasers. The Storm Prediction Center had issued a high-risk warning for severe weather, highlighting the potential for strong, long-track tornadoes across central Oklahoma. As the afternoon progressed, supercell thunderstorms began to develop, their towering structures visible from miles away. Among these storms, one particular supercell exhibited ominous signs of rotation and quickly became the focus of attention.

At approximately 6:03 pm, the El Reno tornado touched down, initially as a relatively narrow funnel. However, it rapidly intensified and expanded, growing wider and wider as it churned across the open landscape. The tornado’s erratic movements and multiple vortices made it difficult to track and predict, posing a significant danger to those in its path.

Caught in the Colossus: Stories of Impact and Loss

The El Reno tornado’s unpredictable nature and immense size had a profound impact on those who encountered it, including experienced storm chasers and researchers who dedicated their lives to understanding these powerful storms.

  • TWISTEX Team: The TWISTEX (Tactical Weather Instrumented Sampling in/near Tornadoes Experiment) team, a group of researchers studying tornadoes, was caught in the path of the El Reno tornado. Their vehicle was tossed by the tornado’s winds, resulting in injuries to several team members and tragically claiming the life of renowned storm chaser Tim Samaras, his son Paul Samaras, and fellow chaser Carl Young.
  • Other Storm Chasers: Several other storm chasers had close encounters with the El Reno tornado, capturing dramatic footage of the twister’s immense size and erratic movements. Many experienced the dangers of chasing such a large and unpredictable tornado firsthand, highlighting the risks associated with this activity.
  • Record-Breaking Width: At its peak, the El Reno tornado reached a staggering width of 2.6 miles, making it the widest tornado ever recorded. This immense size is attributed to the presence of multiple vortices within the parent circulation, effectively creating a massive wedge tornado with a broad damage path. The sheer width of the tornado made it difficult to perceive its full extent from the ground, leading to challenges in tracking and warning for its path.
  • Fluctuating Intensity: The El Reno tornado exhibited rapid fluctuations in intensity, ranging from EF3 to EF5 on the Enhanced Fujita scale. This variation in strength is a characteristic of many large tornadoes and is influenced by the complex dynamics of the storm’s updraft and the inflow of air feeding the tornado. The tornado’s multiple vortices also likely contributed to its fluctuating intensity, as each subvortex could possess varying degrees of strength.
  • Damage Indicators: Despite its immense size and fluctuating intensity, the El Reno tornado’s damage path was primarily rated EF3. This is because the tornado traversed mostly rural areas with few structures to serve as damage indicators. However, the few structures that were impacted sustained significant damage, indicative of the tornado’s potential for greater destruction had it tracked through a more densely populated area.
  • Reed Timmer and the Dominator Team: Veteran storm chaser Reed Timmer and his Dominator team were in close proximity to the El Reno tornado, capturing dramatic footage of its rapid expansion and erratic movements. They experienced the tornado’s powerful winds firsthand as their armored vehicle, the Dominator, was buffeted and pushed off the road. Timmer described the experience as “the most intense moment of my storm chasing career,” highlighting the sheer power and danger of the El Reno tornado.
  • Mike Bettes and The Weather Channel Team: The Weather Channel team, led by meteorologist Mike Bettes, was also chasing the El Reno tornado. Their SUV was caught in one of the tornado’s subvortices and thrown 200 yards, resulting in injuries to the team members. Bettes later recounted the experience as a “life-changing event” that underscored the unpredictable nature of tornadoes and the importance of safety precautions when chasing storms.

Wildfires Ravage the Texas Panhandle: A Destructive March Day – March 6, 2024

The devastating wildfires that swept across the Texas Panhandle on March 6, 2024, were not merely a result of chance; they were the culmination of a complex interplay of meteorological factors that created a tinderbox ready to ignite. Understanding these specific elements is crucial to grasping the severity and rapid spread of the fires.

  • Critically Dry Conditions: The winter months leading up to March 2024 were exceptionally dry across the Texas Panhandle. Rainfall deficits accumulated, leaving the vegetation parched and highly susceptible to burning. The dry fuels, primarily consisting of grasses and shrubs, provided ample fuel for the fires to spread rapidly.
  • Dryline Dynamics: On March 6th, a dryline, a boundary separating moist air from dry air, pushed eastward across the Panhandle. This dryline passage resulted in a sharp decrease in humidity levels, creating an environment conducive to fire ignition and spread. The dry air mass also contributed to increased wind speeds, further exacerbating fire behavior.
  • Wind as the Driving Force: Strong winds played a crucial role in the rapid spread of the wildfires. Sustained wind speeds of 50 mph with gusts exceeding 70 mph were observed across the region. These winds fanned the flames, carrying embers long distances and igniting new spot fires ahead of the main fire front. The wind direction also influenced the fire’s movement, pushing it across the landscape and threatening communities in its path.
  • Atmospheric Instability: The combination of dry air, strong winds, and daytime heating created an unstable atmosphere. This instability enhanced the development of fire-induced convective columns, essentially updrafts of hot air and smoke that can reach thousands of feet into the atmosphere. These convective columns can generate their own weather, including strong winds and lightning, further contributing to the fire’s erratic behavior and spread.
  • Limited Moisture Relief: While there were some isolated rain showers in the region on March 6th, they were insufficient to provide any meaningful moisture relief. The rain was quickly evaporated by the dry air and strong winds, leaving the dry fuels readily available for combustion.

The confluence of these specific meteorological factors created a perfect storm for wildfire development and rapid spread in the Texas Panhandle. The dry fuels, low humidity, strong winds, atmospheric instability, and lack of moisture relief all contributed to the severity of the wildfires, making them a significant challenge for firefighters and emergency responders.

  • Over 800,000 acres burned: The wildfires consumed an area exceeding 800,000 acres, an expanse larger than the state of Rhode Island. The Perryton Fire, the largest of the blazes, alone accounted for over 315,000 acres. This makes it one of the largest wildfire events in Texas history, highlighting the severity and scale of the disaster.
  • Structures engulfed in flames: While the exact number of structures destroyed remains under assessment, initial estimates suggest that hundreds of homes, barns, outbuildings, and other structures were lost to the fires. In Gray County alone, 70 homes were confirmed destroyed, displacing families and leaving them with the daunting task of rebuilding their lives.
  • Livestock losses in the thousands: The wildfires inflicted a heavy toll on the region’s ranching community. Thousands of cattle perished in the flames, representing a significant financial loss for ranchers and a disruption to the agricultural industry. The loss of grazing land further compounded the challenges faced by ranchers, as they struggled to find ways to sustain their remaining herds.
  • Air quality plummets: The thick smoke plumes generated by the wildfires blanketed the region, leading to hazardous air quality conditions. Particulate matter levels soared, posing respiratory risks to residents, particularly those with pre-existing conditions. Schools and businesses were forced to close, and outdoor activities were restricted due to the poor air quality.
  • Ecological impact: A long road to recovery: The wildfires not only destroyed homes and property but also left a lasting impact on the region’s ecosystem. Native vegetation was decimated, wildlife habitats were disrupted, and the risk of soil erosion increased. The recovery of these ecosystems will take years, if not decades, and requires careful management and restoration efforts.

Specific Examples of the Devastation:

  • Perryton Fire: The largest of the wildfires, scorching over 315,000 acres and destroying numerous homes and structures in and around the town of Perryton.
  • Gray County Fires: Multiple fires burned across Gray County, resulting in the destruction of at least 70 homes and extensive damage to ranchland.
  • Swisher County Fires: The fires in Swisher County impacted a significant area, causing damage to agricultural operations and rural properties.

The Joplin Tornado: A Monster Tears Through the Heart of America – May 22, 2011

The afternoon of May 22, 2011, etched itself into the annals of American history as a monstrous EF5 tornado, the highest rating on the Enhanced Fujita scale, ripped through the city of Joplin, Missouri. This catastrophic event left a trail of devastation, claiming 158 lives and injuring over 1,000 people. The tornado, with winds exceeding 200 mph, carved a path of destruction a mile wide and 13 miles long, reducing homes to splinters, tossing cars like toys, and leaving the landscape scarred beyond recognition.

The day began with a sense of foreboding. The Storm Prediction Center had issued a high-risk warning for severe weather, highlighting the potential for strong, long-track tornadoes across the Midwest. As the afternoon progressed, supercell thunderstorms began to develop, their towering structures visible from miles away. At approximately 5:41 pm, the devastating tornado touched down on the western edge of Joplin, near the intersection of 20th Street and Schifferdecker Avenue.

The tornado rapidly intensified as it moved eastward, growing in size and strength. It tore through residential areas, commercial districts, and St. John’s Regional Medical Center, leaving a path of unimaginable destruction in its wake. The hospital, a beacon of hope and healing, suffered a direct hit, its windows shattered, roof ripped off, and interior ravaged by the ferocious winds.

  • Homes Obliterated: Approximately 7,500 homes were damaged or destroyed, leaving nearly a third of the city’s residents displaced. Entire neighborhoods were flattened, with houses reduced to piles of debris. Personal belongings were scattered for miles, a poignant reminder of the lives disrupted and the memories lost.
  • Businesses Battered: The tornado’s path included the city’s main commercial district, leaving countless businesses in ruins. The Joplin Plaza Shopping Center and the nearby Walmart Supercenter were severely damaged, their structures mangled beyond recognition. Smaller businesses, the lifeblood of the local economy, also suffered immensely, facing the daunting challenge of rebuilding and recovering.
  • Schools Shattered: Joplin High School, a symbol of community pride and academic excellence, was directly in the tornado’s path. The building suffered extensive damage, with entire sections of the roof torn off and walls caved in. Several other schools, including elementary and middle schools, also sustained significant damage, disrupting the education of thousands of students.
  • Landmark Losses: The iconic St. John’s Regional Medical Center, a cornerstone of the community’s healthcare system, was severely impacted. The tornado ripped through the building, shattering windows, collapsing walls, and compromising the structural integrity of the entire facility. The hospital was rendered inoperable, forcing the evacuation and relocation of patients and staff.
  • Infrastructure Incapacitated: The tornado’s impact extended beyond buildings and homes, crippling essential infrastructure. Power lines were downed, leaving thousands without electricity for days and weeks. Communication systems were disrupted, making it difficult for residents to connect with loved ones and emergency services. The city’s water supply and sewage systems were also damaged, posing public health concerns.
  • Trees Toppled and Debris Everywhere: The landscape of Joplin was dramatically altered, with thousands of trees uprooted and stripped bare. The debris from destroyed buildings, vehicles, and personal belongings was scattered across the city, creating a scene of utter devastation. The sheer volume of debris posed a significant challenge for recovery efforts, requiring a massive cleanup operation.

The meteorological factors that contributed to the Joplin tornado were complex and multifaceted. A strong low-pressure system over the Great Plains provided the necessary lift for thunderstorm development. Abundant moisture streaming north from the Gulf of Mexico fueled the storms, while a strong jet stream aloft provided the wind shear needed for rotation. These ingredients, combined with the unstable atmosphere, created the perfect environment for the development of supercell thunderstorms and the potential for violent tornadoes.

The specific dynamics of the Joplin tornado were particularly noteworthy. The storm exhibited a phenomenon known as a “hook echo” on radar, a telltale sign of a rotating thunderstorm capable of producing a tornado. Additionally, the storm’s updraft, the column of rising air that feeds the thunderstorm, was exceptionally strong, allowing the tornado to maintain its intensity and longevity.

As the tornado moved through Joplin, it displayed characteristics of multiple vortices, smaller tornadoes rotating within the larger parent circulation. This phenomenon, known as a multi-vortex tornado, contributes to the extreme damage often observed with EF5 tornadoes.

  • Total Estimated Damage: $2.8 billion
  • Residential Losses:
    • 7,500 homes damaged or destroyed
    • Insurance claims for residential property exceeding $2 billion
  • Commercial Losses:
    • 500+ businesses impacted
    • Estimated $500 million in commercial property damage
    • Significant job losses due to business closures
  • Public Infrastructure Damage:
    • $150 million in damage to public infrastructure (including schools, hospitals, government buildings)
    • Extensive damage to roads, bridges, and utilities
  • Debris Removal:
    • Over 4 million cubic yards of debris generated
    • Estimated $150 million in debris removal costs
  • Recovery and Rebuilding:
    • Long-term reconstruction costs exceeding $1 billion
    • Ongoing expenses related to community redevelopment and economic revitalization

Hurricane Ian’s Destructive Path: A Florida Peninsula Battered (September 28, 2022)

On September 28, 2022, Hurricane Ian, a Category 4 monster with sustained winds of 150 mph, etched its name into the annals of Florida’s hurricane history. The storm, which had undergone rapid intensification in the warm waters of the Gulf of Mexico, made landfall near Cayo Costa, an island off the coast of Fort Myers, bringing with it a catastrophic storm surge, torrential rains, and winds capable of pulverizing structures. Ian’s impact was far-reaching, leaving a trail of destruction across the Florida peninsula and impacting millions of residents.

Fort Myers Beach, a popular tourist destination known for its white-sand beaches and vibrant atmosphere, bore the brunt of Ian’s fury. The storm surge, a wall of water reaching heights of 12-18 feet, inundated the island, sweeping away homes, businesses, and landmarks. Videos and images captured the devastation, showing buildings ripped from their foundations and debris floating amidst a sea of churning water. The storm surge’s impact extended inland, flooding communities along the Caloosahatchee River and causing widespread damage.

As Ian moved across the Florida peninsula, it weakened but continued to unleash its destructive power. Heavy rains, exceeding 20 inches in some areas, triggered widespread flooding, transforming streets into rivers and inundating homes. Orlando, a city typically associated with theme parks and sunshine, experienced record rainfall and significant flooding, disrupting daily life and causing extensive damage. The storm’s winds, though diminished, remained strong enough to down trees and power lines, leaving millions without electricity.

The morning of September 27, 2022, dawned with a sense of foreboding for residents along Florida’s Gulf Coast. Hurricane Ian, having churned and intensified in the warm waters of the Gulf of Mexico, was now a Category 3 behemoth, its sights set on the Sunshine State. Mandatory evacuations were ordered for low-lying areas, and a mass exodus began as residents heeded the warnings, fleeing inland in search of safety. Those who remained, either by choice or circumstance, braced for the impending impact, boarding up windows, securing belongings, and seeking shelter in sturdy structures or local shelters.

As the hours ticked by, the storm’s outer bands began to lash the coast, bringing with them squalls of rain and increasingly strong winds. Fort Myers Beach, a vibrant tourist destination known for its white-sand beaches and lively atmosphere, transformed into a ghost town. Palm trees swayed violently, their fronds whipping in the wind, and the normally calm Gulf waters turned into a churning, angry sea. A sense of anxiety and uncertainty hung thick in the air as residents huddled indoors, listening to the howling wind and the relentless pounding of the rain.

By afternoon, Ian’s approach was undeniable. The sky turned an ominous gray, and the wind intensified, carrying with it the roar of the approaching storm. At approximately 3:05 pm, the moment residents had dreaded arrived. Hurricane Ian made landfall near Cayo Costa as a powerful Category 4 storm, its sustained winds of 150 mph capable of ripping buildings apart. The storm surge, a towering wall of water reaching heights of 12-18 feet, roared ashore, engulfing Fort Myers Beach and surrounding areas. Homes were lifted from their foundations and carried away by the raging waters, businesses crumbled into piles of debris, and landmarks that had stood for decades vanished beneath the waves.

The devastation on Fort Myers Beach was catastrophic. The once-idyllic island was transformed into a scene of utter destruction, a tangled mess of debris, destroyed buildings, and flooded streets. Rescue crews, braving the treacherous conditions, began the daunting task of searching for survivors and assessing the damage. Residents who had evacuated returned to find their homes gone, their belongings scattered, and their lives irrevocably changed.

As Ian moved across the Florida peninsula, it weakened but continued to unleash its fury. Heavy rains, exceeding 20 inches in some areas, triggered widespread flooding. In Orlando, a city known for theme parks and sunshine, streets became rivers, cars were submerged, and homes were inundated with water. The storm’s winds, though diminished, downed trees and power lines, leaving millions across the state without electricity and plunging communities into darkness.

The meteorological factors that contributed to Ian’s intensification were a combination of warm waters in the Gulf of Mexico, low wind shear, and a favorable atmospheric pattern. Sea surface temperatures in the Gulf were well above average, providing ample fuel for the storm’s growth. Additionally, wind shear, the change in wind speed and direction with height, which can disrupt hurricane development, was minimal. This allowed Ian to maintain its structure and strengthen rapidly. Finally, a steering pattern in the upper atmosphere guided Ian towards the Florida peninsula, setting the stage for a devastating landfall.

Ian’s impact extended beyond the immediate devastation of wind and water. The storm disrupted supply chains, leading to shortages of gasoline and other essential goods. The tourism industry, a vital part of Florida’s economy, suffered a significant blow, as hotels, attractions, and beaches were damaged or closed. The agricultural sector also experienced losses, with citrus groves and other crops impacted by the storm’s winds and flooding.

Meteorological Genesis and Escalation:

  • September 23, 2022: A tropical wave emerges off the coast of Africa, embarking on a journey across the Atlantic.
  • September 24-26, 2022: The tropical wave strengthens into a tropical depression and then Tropical Storm Ian, churning westward through the Caribbean Sea.
  • September 27, 2022: Ian undergoes rapid intensification, exploding into a major hurricane as it enters the Gulf of Mexico’s warm waters. Florida residents brace for impact as mandatory evacuations are issued for vulnerable coastal areas.

Landfall and the Unleashing of Fury:

  • September 28, 2022 (Morning): Hurricane Ian, now a monstrous Category 4 storm with sustained winds of 150 mph, takes aim at the Florida Gulf Coast. The atmosphere is thick with anticipation and dread as residents finalize preparations or evacuate inland.
  • September 28, 2022 (Afternoon): At approximately 3:05 pm, Ian makes landfall near Cayo Costa, an island off the coast of Fort Myers. The storm surge, a towering wall of water reaching heights of 12-18 feet, slams ashore, engulfing coastal communities and causing catastrophic damage. Fort Myers Beach is particularly hard hit, with homes swept away, businesses destroyed, and landmarks obliterated.

Unfolding Devastation and Inland Inundation:

  • September 28, 2022 (Evening): Ian continues its destructive path across the Florida peninsula, weakening but still packing a powerful punch. Heavy rains, exceeding 20 inches in some areas, trigger widespread flooding. Orlando and other inland cities experience record rainfall, transforming streets into rivers and inundating homes and businesses.
  • September 29, 2022: The storm weakens further as it moves across central Florida and emerges into the Atlantic Ocean. However, its impact continues to be felt, with widespread power outages, disrupted infrastructure, and ongoing flooding.

The Wake of Destruction and the Road to Recovery:

  • September 30 – October 2022: The full extent of the devastation becomes clear as floodwaters recede and search and rescue efforts transition to recovery operations. Communities across Florida face the daunting task of rebuilding homes, businesses, and infrastructure. The economic toll of the storm is staggering, with estimates exceeding $100 billion.