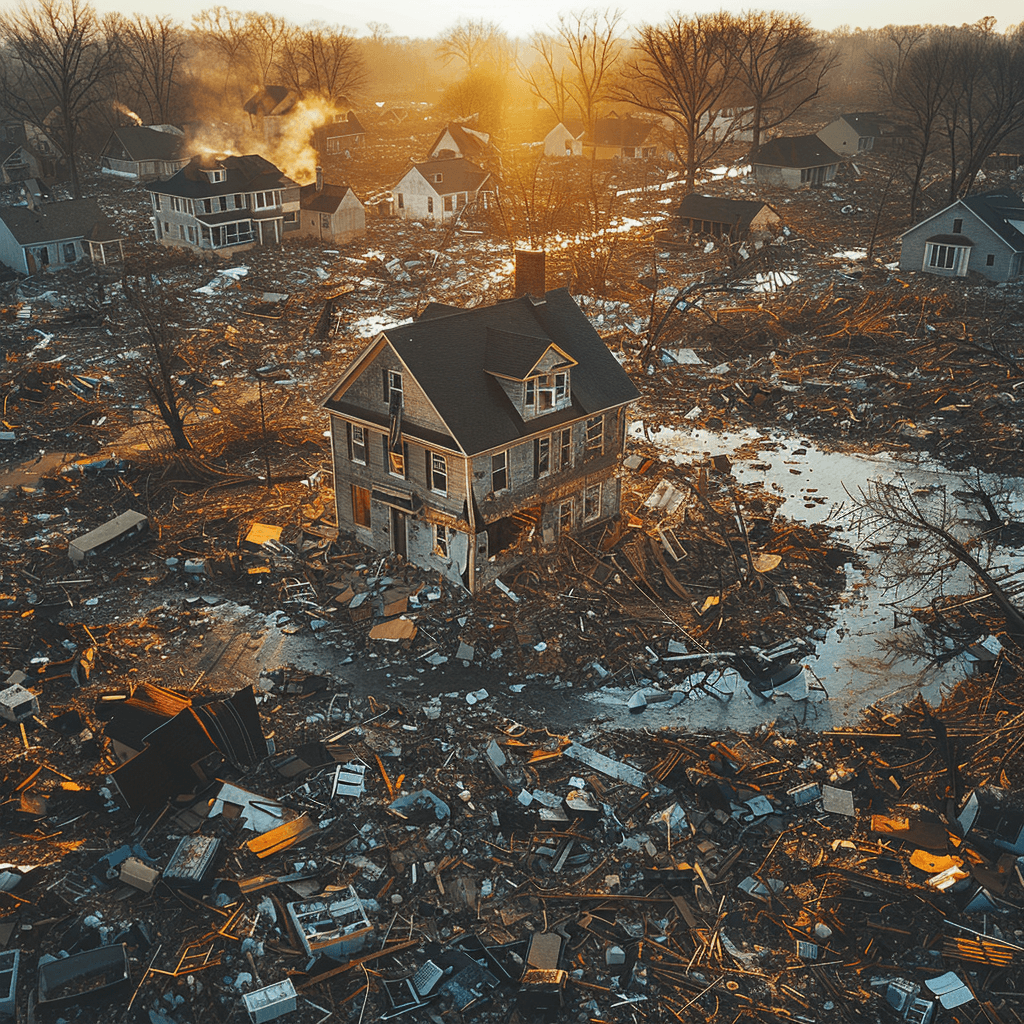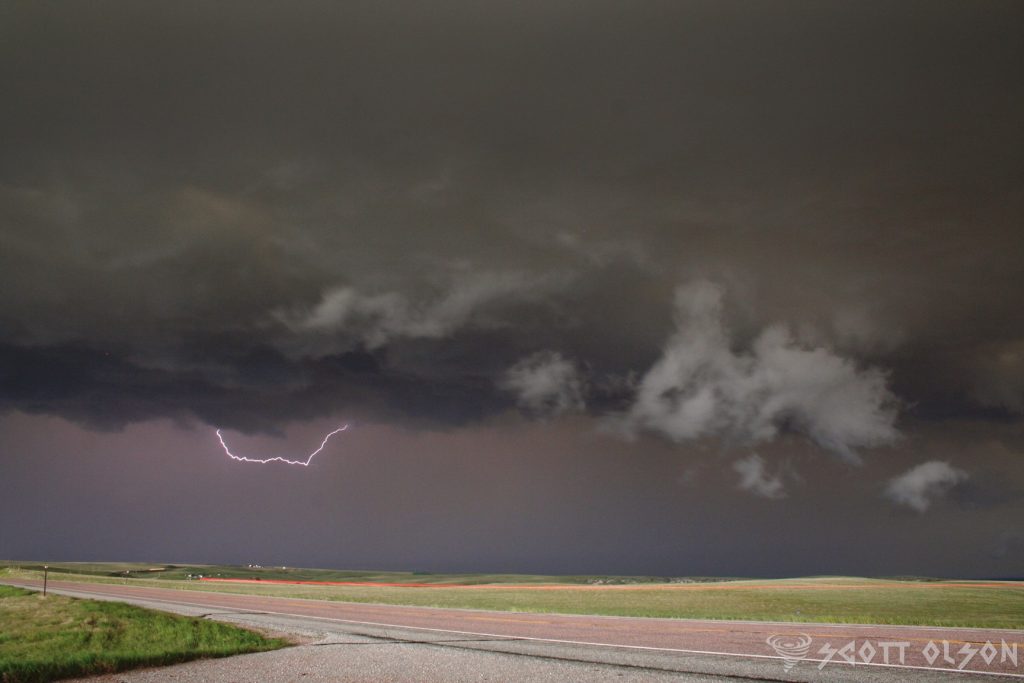
Understanding Storm Boundaries: Drylines, Warm Fronts, Cold Fronts, and Outflow Boundaries

Storms are among the most powerful and awe-inspiring natural phenomena on Earth, capable of producing heavy rain, strong winds, large hail, and even tornadoes. But what causes these storms to form, and what factors influence their severity? The answer lies in the various types of atmospheric boundaries that exist in our atmosphere, including drylines, warm fronts, cold fronts, and outflow boundaries.

Drylines are a unique type of boundary that is most commonly found in the Great Plains region of the United States. A dryline separates warm, moist air from hot, dry air and is often characterized by a sharp contrast in temperature and humidity across the boundary. As the sun heats the ground during the day, the hot, dry air on one side of the dryline rises, creating a localized area of low pressure. This low-pressure area then draws in the warm, moist air from the other side of the boundary, setting the stage for severe thunderstorm development.
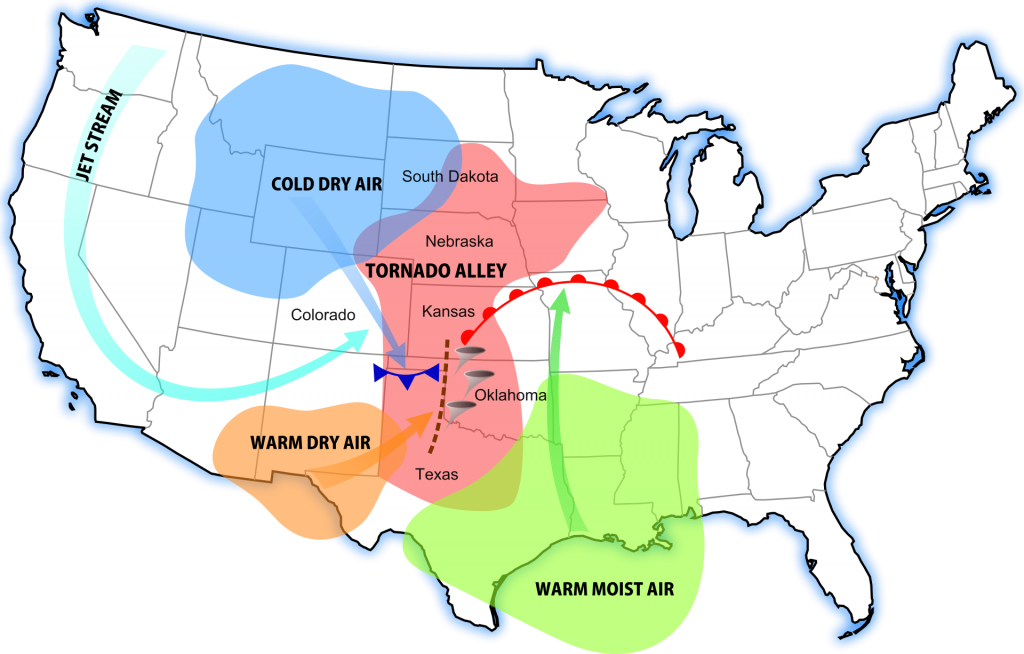
Dryline storms are notorious for their rapid development and intense nature. As the warm, moist air is forced upward by the rising hot, dry air, it cools and condenses, forming towering cumulus clouds that can quickly evolve into severe thunderstorms. These storms often produce large hail, damaging winds, and even tornadoes, making them a significant threat to life and property in the regions where they occur.
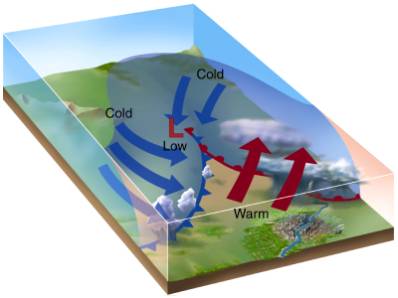
Warm fronts, on the other hand, are a type of boundary that occurs when a mass of warm air advances into a region of cooler air. As the warm air rises over the cooler air, it cools and condenses, forming clouds and precipitation. Warm front storms are generally characterized by widespread cloudiness, steady rain, and occasionally, thunderstorms.

One of the unique features of warm front storms is the gradual nature of their development. Unlike dryline storms, which can form and intensify rapidly, warm front storms tend to develop slowly over a period of several hours or even days. This slow development can lead to prolonged periods of rain and cloudiness, which can have significant impacts on local weather patterns and human activities.
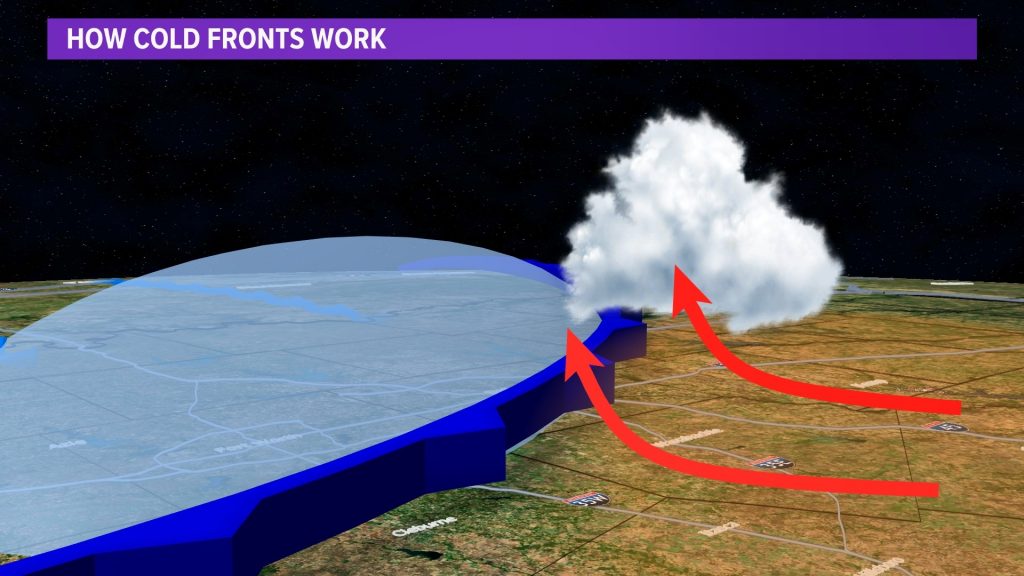
Cold fronts are perhaps the most well-known type of atmospheric boundary, and for a good reason. These boundaries occur when a mass of cold air overtakes a region of warmer air, forcing the warm air to rise rapidly. As the warm air rises, it cools and condenses, forming a line of intense thunderstorms known as a squall line.

Cold front storms are often accompanied by a dramatic change in weather conditions, with temperatures dropping sharply and winds shifting direction as the front passes through. These storms can produce a wide range of severe weather hazards, including damaging winds, large hail, and tornadoes, making them a significant threat to life and property.
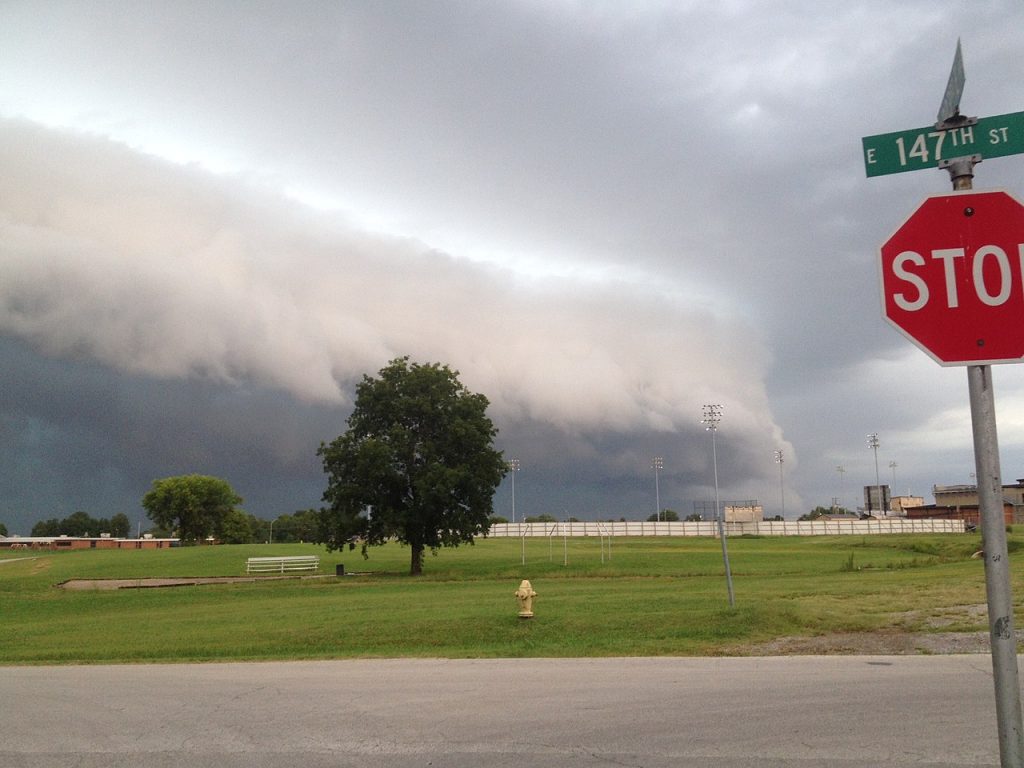
Outflow boundaries are a type of boundary that forms when cool, dense air from a previous storm or rain-cooled air rushes out ahead of the storm, creating a mini cold front. As this cool air undercuts the warm, moist air ahead of it, it can trigger the development of new thunderstorms, often in a repeating cycle known as “training.”

Outflow boundary storms can be particularly dangerous because they can form quickly and with little warning, catching even the most prepared individuals off guard. These storms often produce heavy rain, strong winds, and occasionally, severe weather hazards such as large hail and tornadoes.

While atmospheric boundaries are a critical factor in the formation of severe storms, they are not the only factors at play. Moisture, instability, and wind shear are also essential ingredients in the development of severe thunderstorms and tornadoes. When these factors combine with a strong atmospheric boundary, the result can be a significant severe weather outbreak.
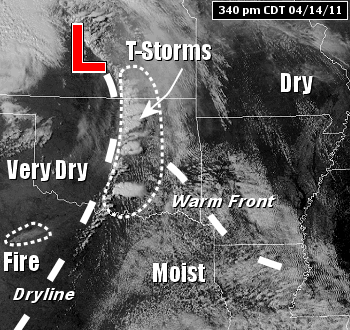
Drylines and Tornadoes: Drylines are known to be a significant factor in the formation of severe thunderstorms and tornadoes, particularly in the Great Plains region of the United States. A study by Hoch and Markowski (2005) found that “70% of all tornadoes in the southern Great Plains from 1999 to 2001 occurred within 100 km of a dryline.”

One notable example of a dryline-related tornado outbreak occurred on May 3, 1999, in Oklahoma and Kansas. According to the National Weather Service, this outbreak produced 74 tornadoes, including the devastating F5 tornado that struck Moore, Oklahoma, causing 36 fatalities and over $1 billion in damage.
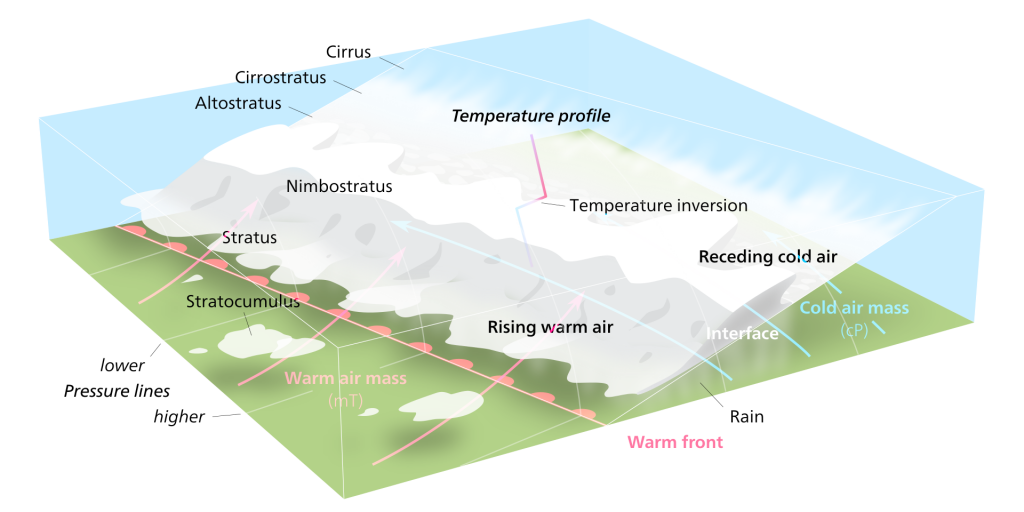
Warm Fronts and Tornadoes: While warm fronts are less commonly associated with tornado formation than other boundary types, they can still contribute to the development of severe thunderstorms and occasional tornadoes. A study by Gaffin and Parker (2006) found that “approximately 10% of all tornadoes in the United States are associated with warm fronts.”

An example of a warm front-related tornado event occurred on March 2, 2012, in the Ohio Valley region. The National Weather Service reported that an EF4 tornado touched down in Henryville, Indiana, causing significant damage and 11 fatalities. This tornado was associated with a warm front that had been draped across the region, providing the necessary moisture and instability for severe storm development.

Cold Fronts and Tornadoes: Cold fronts are a well-known contributor to severe thunderstorm and tornado formation. A study by Trapp et al. (2005) found that “approximately 60% of all tornadoes in the United States are associated with cold fronts.”
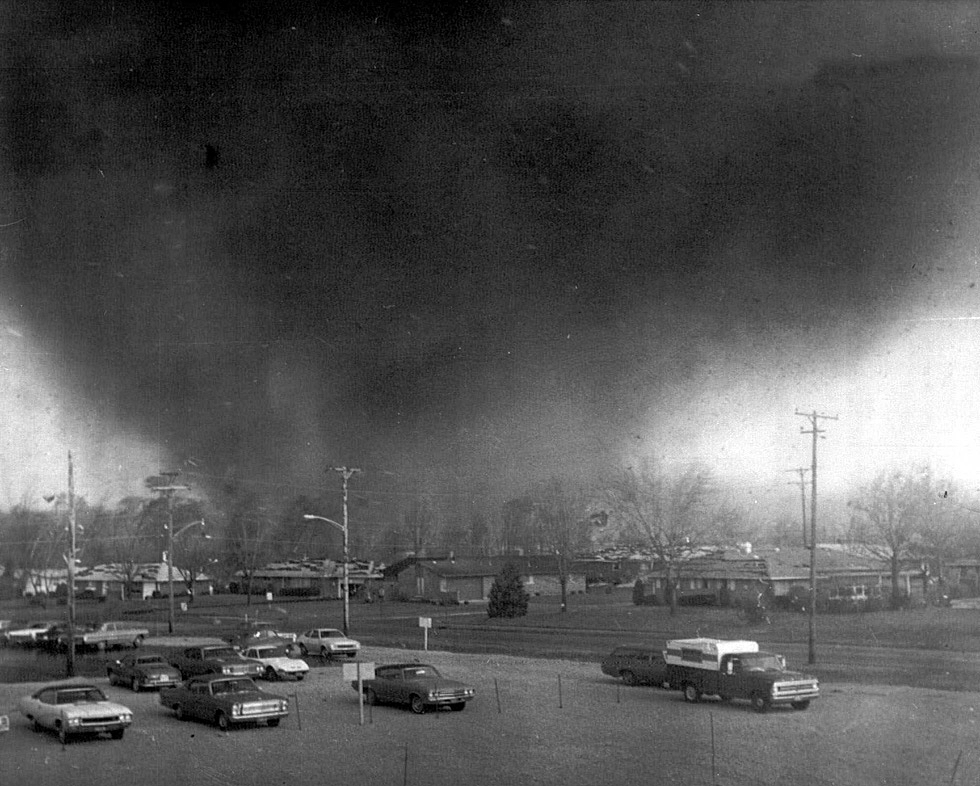
The “Super Outbreak” of April 3-4, 1974, is a prime example of a cold front-related tornado event. During this outbreak, 148 tornadoes touched down across 13 states, causing 330 fatalities and over $600 million in damage (adjusted for inflation). The outbreak was associated with a powerful cold front that swept across the eastern United States, providing the necessary ingredients for widespread severe weather.

Outflow Boundaries and Tornadoes: Outflow boundaries, which are created by the cool, dense air that flows out of thunderstorms, can also contribute to tornado formation. A study by Markowski et al. (1998) found that “nearly 20% of all tornadoes in the central United States are associated with outflow boundaries.”
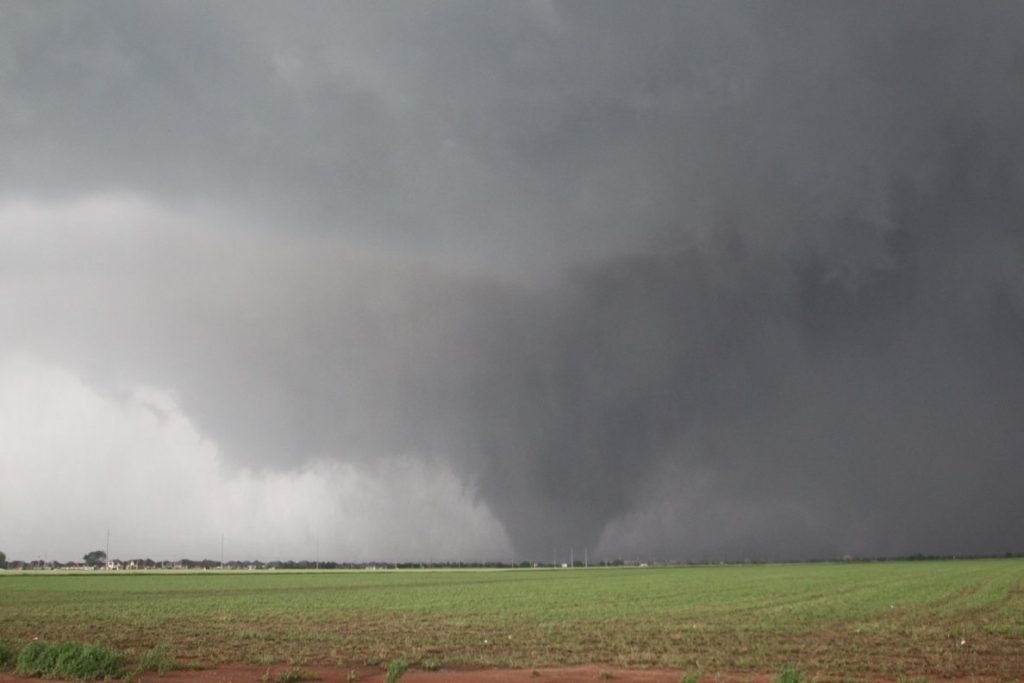
One example of an outflow boundary-related tornado event occurred on May 20, 2013, in Moore, Oklahoma. On this day, an EF5 tornado touched down, causing 24 fatalities and over $2 billion in damage. The tornado formed along an outflow boundary that had been generated by earlier thunderstorms in the area, highlighting the importance of these boundaries in severe weather formation.

Graphcast: A Breakthrough AI Model for Highly Accurate and Efficient Global Weather Forecasting

Weather forecasting is one of the most complex and important scientific challenges facing humanity today. Accurate predictions of weather conditions days in advance can help save lives, optimize industries, and inform critical decision making. However, traditional numerical weather prediction (NWP) approaches rely on complex physics-based simulations that require immense computing power and deep expertise to develop and run.

Now, a groundbreaking new AI model called Graphcast, developed by researchers at Google, is poised to revolutionize global weather forecasting. By leveraging advanced machine learning techniques and decades of historical weather data, Graphcast can generate highly accurate 10-day global forecasts with unprecedented computational efficiency. A paper published in the journal Science details how Graphcast outperforms the current industry gold-standard weather simulation in accuracy while requiring orders of magnitude less computing power and time.

How Graphcast Works


At its core, Graphcast is a deep learning model based on graph neural networks (GNNs), an architecture well-suited for processing the spatially structured data of global weather systems. The model was trained on over 40 years of historical weather data from the ERA5 reanalysis dataset compiled by the European Centre for Medium-Range Weather Forecasts (ECMWF). This dataset combines historical observations from satellites, radar, weather stations and other sources with NWP techniques to reconstruct a comprehensive record of past global weather conditions.

From this vast trove of training data, Graphcast learned the complex web of cause-and-effect relationships governing the evolution of weather systems over time. The resulting model can ingest just the weather conditions at the present time and 6 hours prior, and roll forward highly accurate predictions in 6-hour increments out to 10 days in the future.

Graphcast makes predictions at a high spatial resolution of 28km x 28km grids spanning the entire globe – over 1 million data points. At each grid point, it forecasts five key surface variables like temperature and wind speed, as well as six atmospheric variables at 37 different altitudes. Despite this level of detail and complexity, Graphcast can generate a full 10-day global forecast in under 1 minute using a single TPU v4 machine. In contrast, the ECMWF’s HRES model, widely considered the best in the world, requires hours of computation from a supercomputer with hundreds of nodes to produce a forecast of similar length.

Unprecedented Accuracy When evaluated against the HRES model in comprehensive tests, Graphcast delivered more accurate predictions for over 90% of the 1380 weather variables and forecast timespans analyzed. Focusing on just the troposphere, the critical 6-20km band of atmosphere closest to the Earth’s surface, Graphcast beat HRES for 99.7% of variables tested.

This leap in predictive accuracy can have profound real-world impacts. In one striking example, Graphcast locked onto an accurate forecast track for Hurricane Lee’s Nova Scotia landfall a full 9 days in advance during a live trial in September 2022. HRES predictions vacillated until converging on the correct track only 6 days out. Earlier and more accurate hurricane path forecasts enabled by Graphcast could give affected populations more time to prepare and evacuate.

Graphcast also shows promise in predicting other extreme weather events beyond what it was specifically trained for. By applying a cyclone tracking algorithm to its outputs, researchers found Graphcast maintained higher accuracy than HRES in projecting cyclone paths as the forecast window lengthened. The model can characterize atmospheric rivers to help predict flood risks, and it can flag upcoming heat waves sooner by identifying when temperatures will exceed historical maximums for a given time and place.

Efficiency and Accessibility Perhaps just as significant as Graphcast’s accuracy gains is the dramatic reduction in computational cost and complexity it demonstrates compared to physics-based simulations. The ability to produce world-class forecasts on a single machine in under a minute opens up new possibilities for making weather prediction more accessible and useful for a wider range of applications.

To accelerate this progress, the Graphcast model code has been open-sourced, enabling researchers and forecasters worldwide to experiment with and build upon it. ECMWF is already running a live trial of Graphcast forecasts. The code could be adapted to focus on specific weather phenomena or optimized for regional prediction needs.

Graphcast joins other cutting-edge weather models developed by Google researchers, including a nowcasting system for short-term forecasts and MetNet-3 for improved 24-hour regional predictions already deployed across the U.S. and Europe. Together, these AI-powered tools promise to democratize access to faster, more accurate, and more useful weather forecasts for billions worldwide.

Looking Ahead As climate change continues to disrupt historical weather patterns, adaptable AI prediction systems like Graphcast will become increasingly vital. The model will continue to evolve and improve as more and higher-quality weather observations become available to train it.

Beyond its practical utility for weather forecasting, Graphcast demonstrates the immense potential for AI and machine learning to help us better understand and predict the workings of complex natural systems. With further research and development, these technologies could become integral for climate modeling, ecological monitoring, disaster response, and more.

By enabling us to anticipate future conditions with greater foresight and confidence, AI-powered predictive tools like Graphcast can empower scientists, policymakers, and society at large to make better decisions in the face of growing environmental risks and challenges. While we may not be able to control the weather, breakthroughs like Graphcast bring us one step closer to being able to plan for whatever it may bring.

Weather in Art and Literature: How Artists Have Captured the Elements

Throughout history, artists and writers have been captivated by the power and beauty of the weather. From the gentle brush of a summer breeze to the fury of a raging storm, the elements have served as a source of inspiration for countless works of art and literature. In this article, we will explore how artists have captured the essence of weather in their creations and how it has shaped our perception of the natural world.

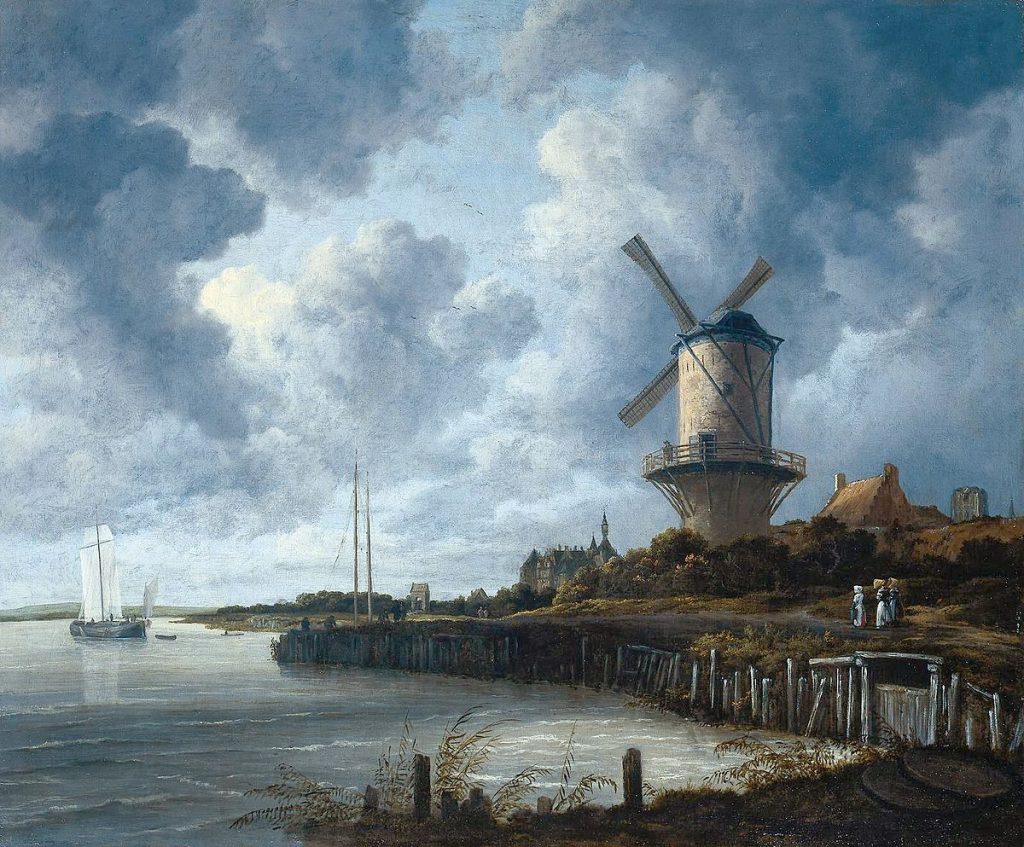
In the realm of visual arts, weather has been a recurring theme for centuries. One of the earliest examples can be found in the works of the Dutch Golden Age painters of the 17th century. Artists like Jacob van Ruisdael and Aelbert Cuyp were renowned for their landscapes that depicted the changing skies and atmospheric conditions of the Netherlands. Ruisdael’s “The Windmill at Wijk bij Duurstede” (1670) showcases a dramatic sky with billowing clouds and a windmill silhouetted against the light, capturing the essence of the Dutch countryside.

The Romantic era of the late 18th and early 19th centuries saw a surge in the representation of weather in art. Painters like J.M.W. Turner and Caspar David Friedrich were drawn to the sublime and awe-inspiring aspects of nature, often depicting turbulent seas, misty mountains, and stormy skies. Turner’s “Snow Storm: Steam-Boat off a Harbour’s Mouth” (1842) is a prime example of his mastery in conveying the raw power of the elements. The painting depicts a steamboat struggling against the fury of the wind and waves, with the sky and sea merging into a vortex of energy.

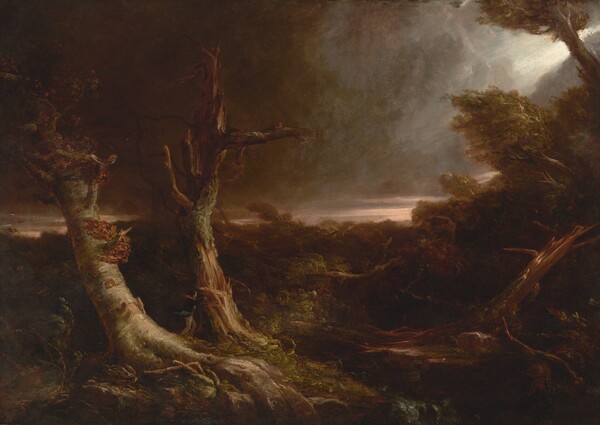
In “Tornado over the Wilderness” (1831), American painter Thomas Cole captures the terrifying majesty of a twister tearing through a desolate landscape. The canvas is dominated by the swirling vortex of the tornado, its funnel cloud descending from a dark and ominous sky. The twisted forms of trees and debris caught in the wind’s fury emphasize the destructive power of the storm, while a distant bolt of lightning illuminates the scene with an eerie, otherworldly glow. Cole’s painting serves as a reminder of nature’s untameable force and the insignificance of man in the face of such awesome might, a theme that resonated deeply with the Romantic sensibilities of the time.

In “Cottage Destroyed by Lightning” (1777), English artist Joseph Wright of Derby captures the devastating aftermath of a lightning strike on a rural cottage. The painting is dominated by the shattered ruins of the building, its roof and walls collapsed and smoldering in the wake of the powerful bolt. The dark, turbulent sky above is illuminated by a jagged streak of lightning, casting an eerie, unsettling light across the scene. Wright’s use of dramatic chiaroscuro and his attention to the details of the destruction emphasize the raw, destructive power of nature and the fragility of human life in the face of such overwhelming force.

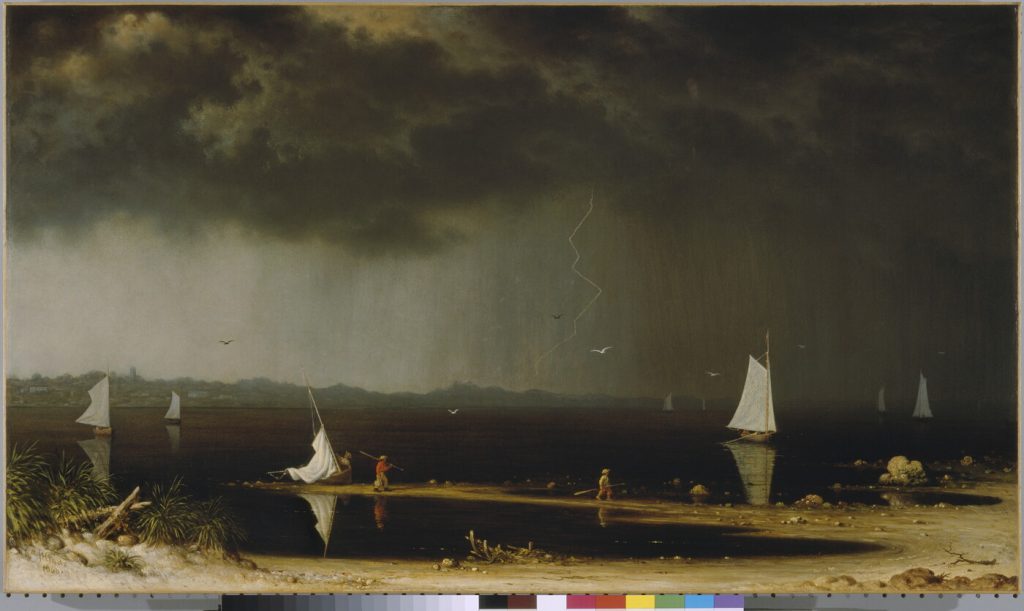
American painter Martin Johnson Heade’s “Thunderstorm on Narragansett Bay” (1868) depicts a dramatic moment during a powerful coastal storm. The canvas is divided between the dark, roiling clouds above and the choppy, wind-whipped waters below, with a distant shoreline barely visible through the haze. A brilliant flash of lightning illuminates the sky, its jagged bolt reflected in the turbulent waves and casting a stark, almost supernatural light across the scene. Heade’s precise, detailed brushwork and his skillful rendering of the atmospheric effects of the storm create a sense of both awe and unease, capturing the sublime beauty and terror of nature’s fury.

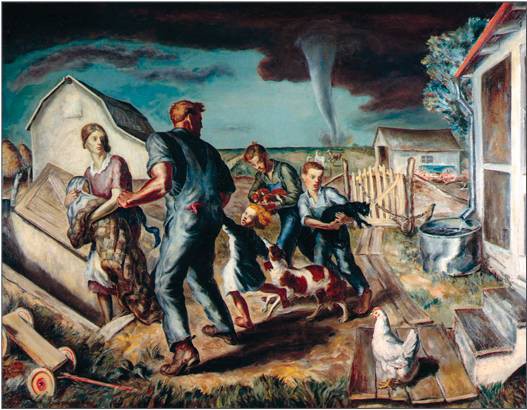
“The Tornado” (1927) by American painter John Steuart Curry. Although Curry was active in the early 20th century, this painting depicts a scene from the previous century. The canvas shows a massive, swirling tornado tearing through a rural landscape, with a farmhouse and barn being ripped apart by the powerful winds. The twister’s funnel cloud is rendered in shades of black and gray, conveying a sense of menace and destruction. In the foreground, a group of figures can be seen seeking shelter, their bodies bent against the force of the wind.

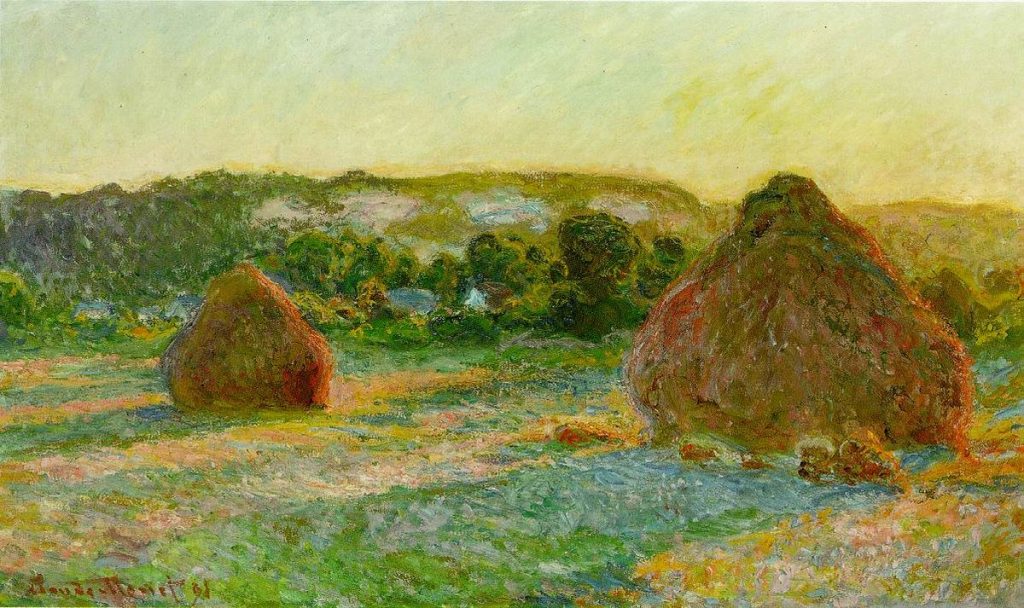
Impressionist painters of the late 19th century were also fascinated by the fleeting effects of light and weather on the landscape. Claude Monet, one of the most prominent figures of the movement, dedicated numerous series to capturing the changing light and atmosphere at different times of the day and in various weather conditions. His “Haystacks” series (1890-1891) depicts the same subject under different light and weather conditions, showcasing how the perception of color and form shifts with the changing elements.

Giorgione’s “The Tempest” (c. 1506-1508) is a masterpiece of Renaissance art that captures the intense drama of a powerful thunderstorm. In this enigmatic painting, a dark and foreboding sky looms over a lush landscape, punctuated by streaks of lightning that illuminate the scene with an eerie glow. The figures in the foreground, a nude woman nursing a child and a soldier standing nearby, appear small and vulnerable against the backdrop of the raging storm, highlighting the awesome power of nature. Giorgione’s use of chiaroscuro, the interplay of light and shadow, adds to the sense of mystery and unease that pervades the painting, inviting the viewer to contemplate the deeper meanings behind this haunting image.

In Rembrandt van Rijn’s “The Storm on the Sea of Galilee” (1633), the Dutch master depicts the biblical story of Jesus calming the storm, capturing the terror and chaos of the moment with his signature mastery of light and shadow. The painting shows the disciples’ boat being tossed about by the turbulent waves, their faces contorted in fear as they struggle against the raging wind and water. Rembrandt’s use of dramatic contrasts, with the dark sky and sea juxtaposed against the bright highlights on the figures and boat, heightens the sense of danger and desperation. The composition draws the viewer’s eye to the figure of Christ, who stands calmly amidst the chaos, his hand raised in a gesture of command, demonstrating his divine power over the elements.
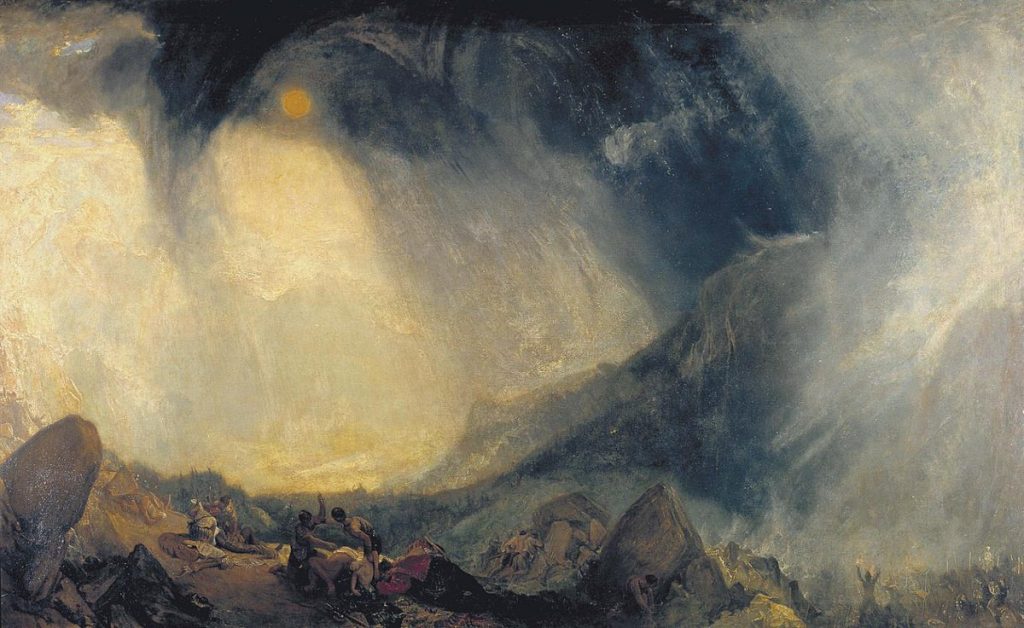
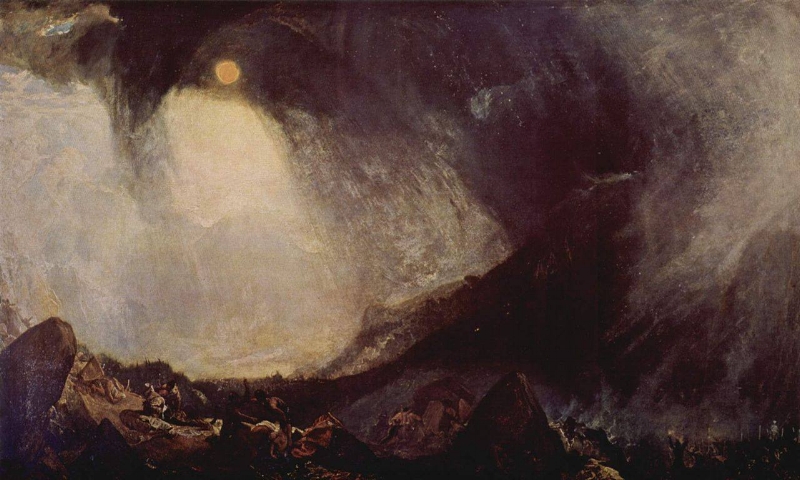
English Romantic painter J.M.W. Turner’s “Snowstorm: Hannibal and his Army Crossing the Alps” (1812) is a powerful example of the artist’s fascination with the sublime forces of nature. The painting depicts the legendary Carthaginian general Hannibal leading his army across the treacherous Alps, battling against a fierce blizzard that threatens to engulf them. Turner’s swirling brushstrokes and pale, almost monochromatic color scheme convey the disorienting fury of the snowstorm, with the tiny figures of Hannibal and his soldiers nearly lost amidst the maelstrom. The painting serves as a testament to the awesome power of nature and the insignificance of human endeavors in the face of such overwhelming might, a central theme of the Romantic movement that Turner helped to define.

In the 20th century, artists continued to explore the theme of weather in their works. American painter Georgia O’Keeffe, known for her abstract depictions of nature, often incorporated elements of the sky and clouds in her paintings. Her “Sky Above Clouds IV” (1965) presents a vast expanse of clouds viewed from above, inviting the viewer to contemplate the immensity and beauty of the atmosphere.

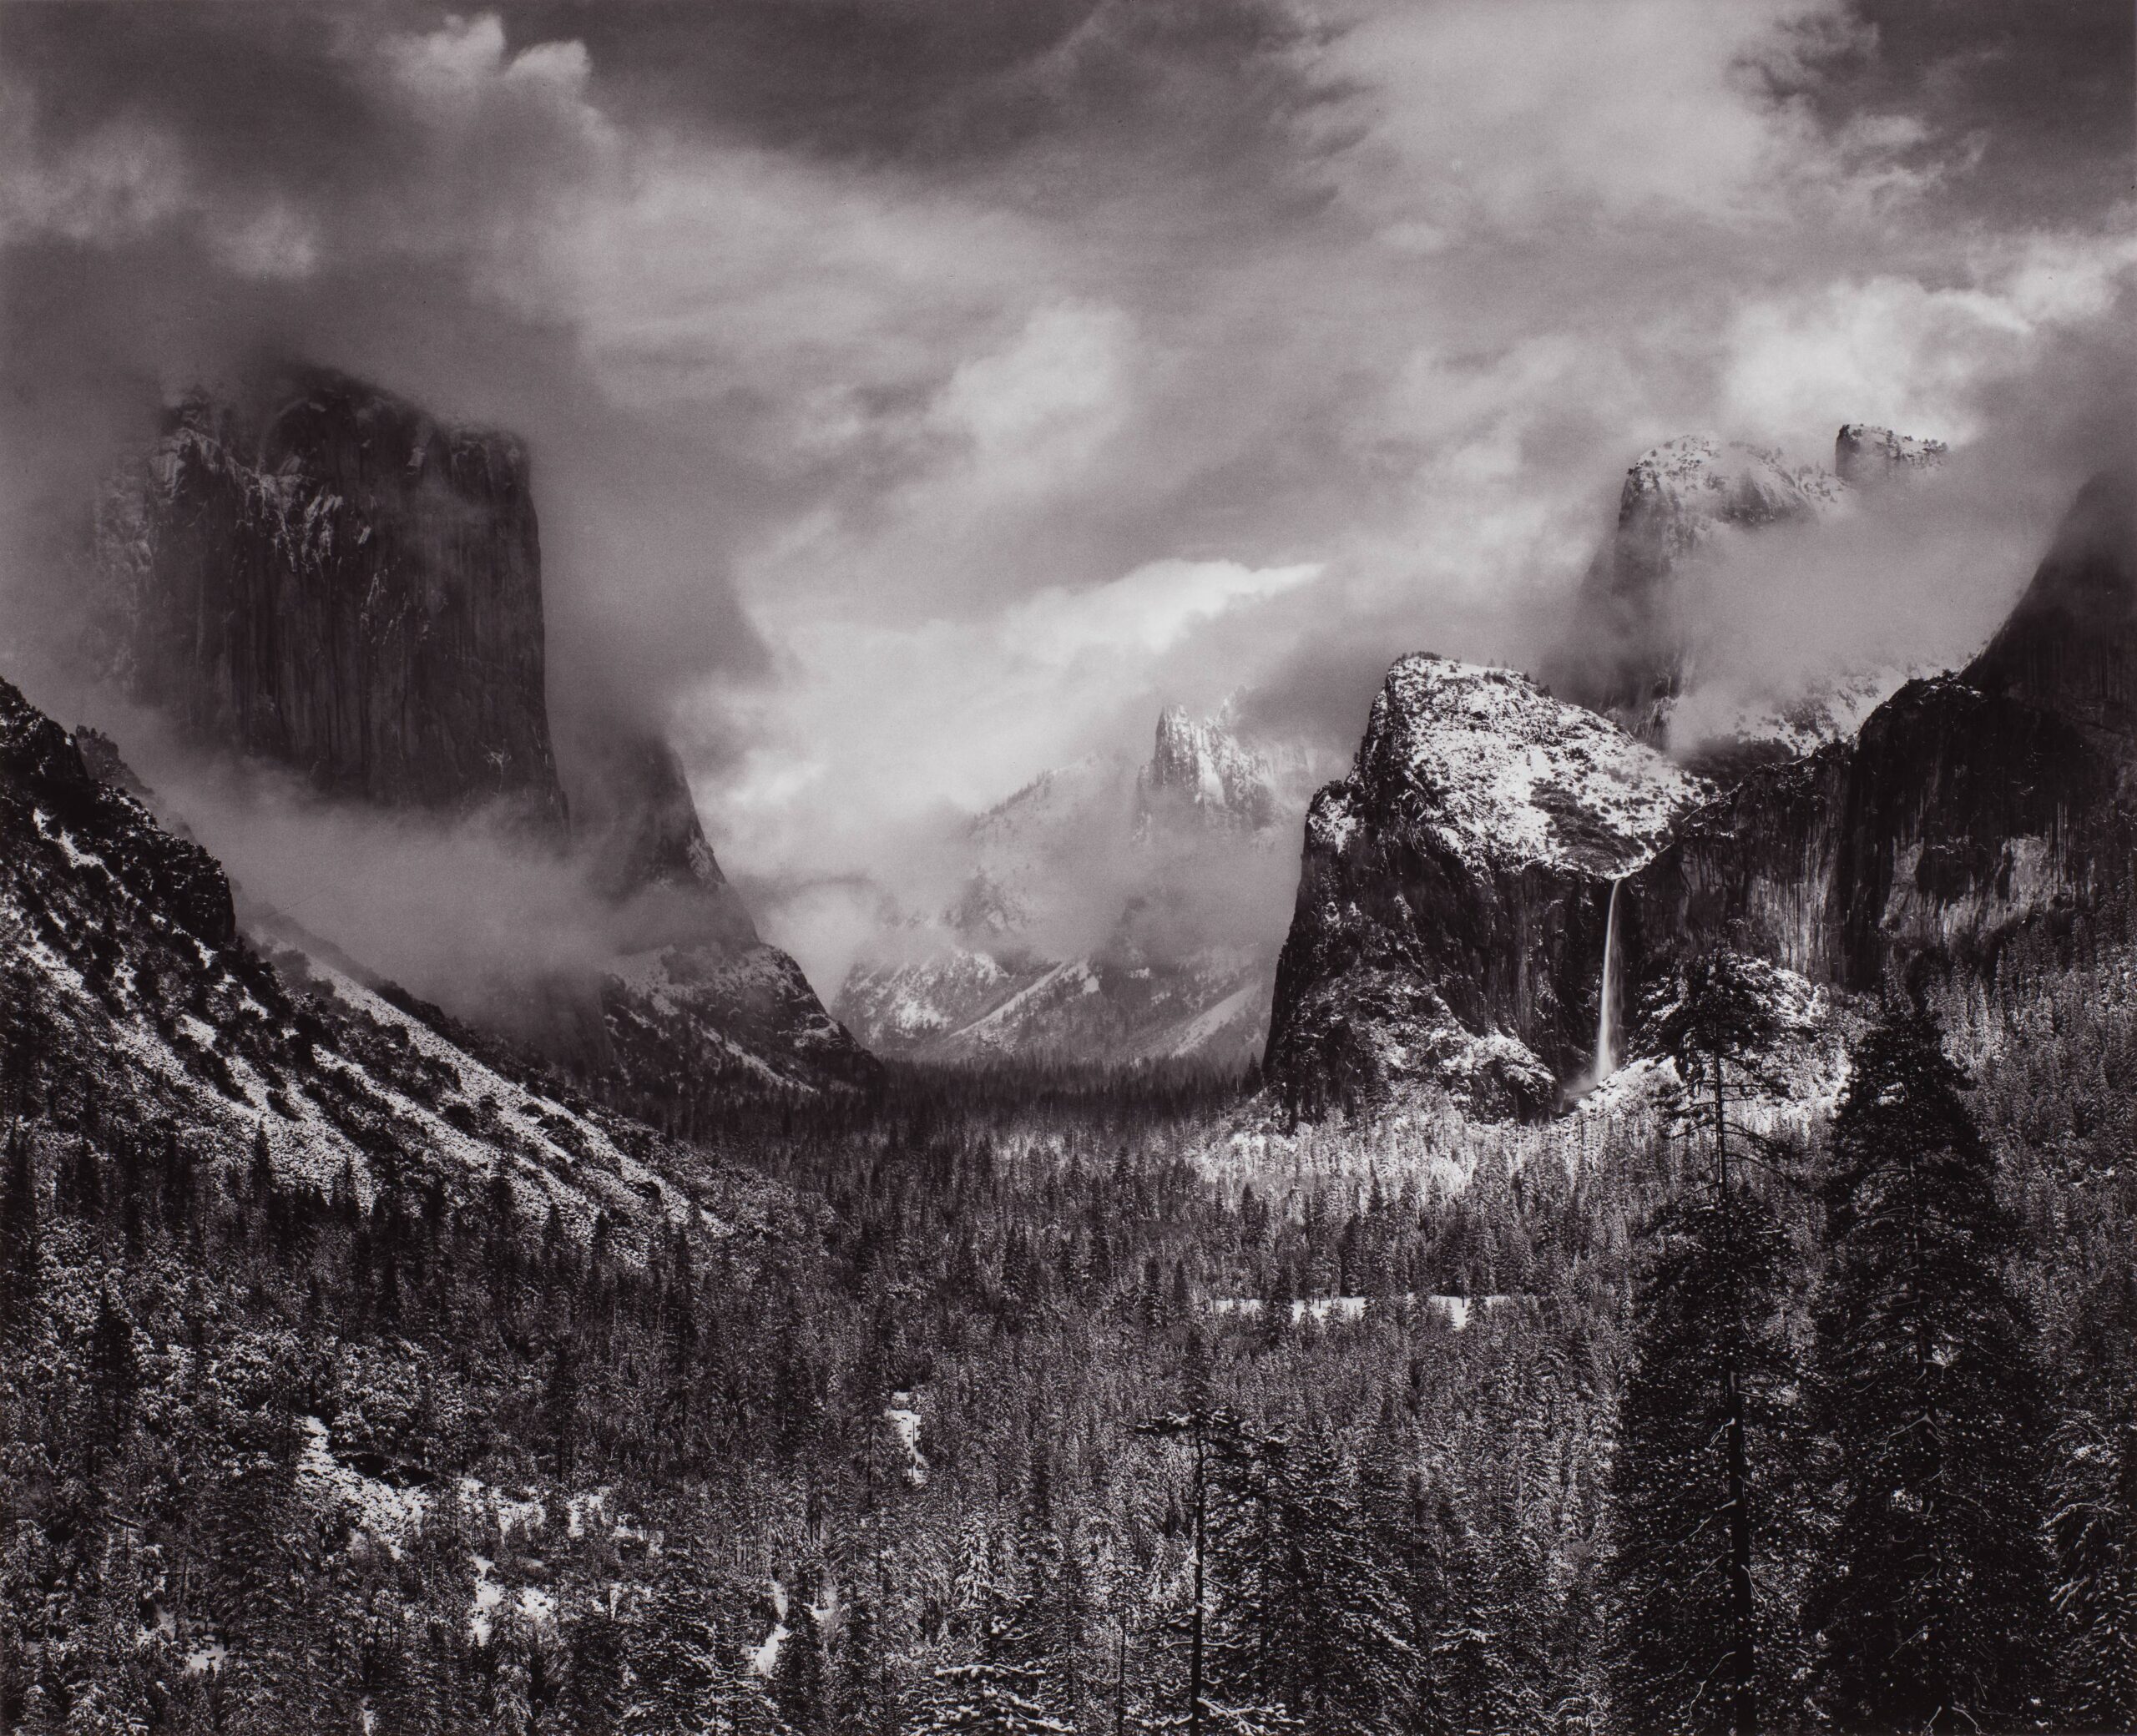
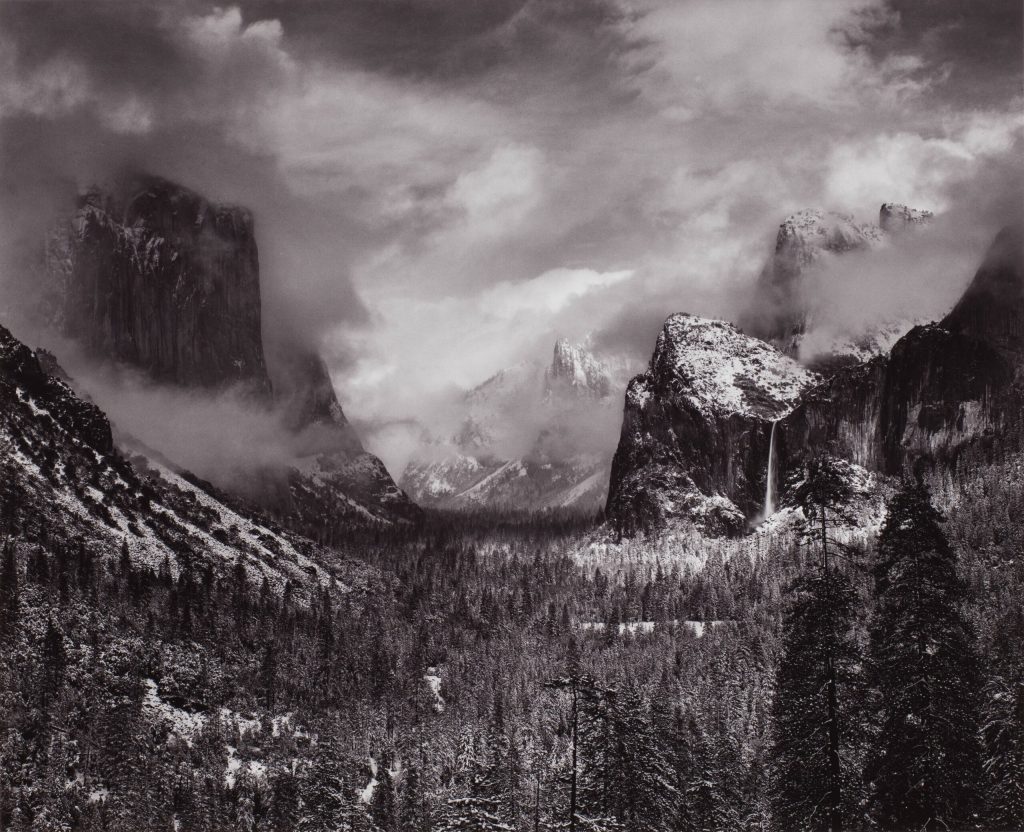
Photography has also played a significant role in capturing the essence of weather. Ansel Adams, one of the most influential photographers of the 20th century, was renowned for his black and white landscapes that often featured dramatic skies and atmospheric conditions. His photograph “Clearing Winter Storm, Yosemite National Park” (1944) depicts the aftermath of a storm, with mist rising from the valley and sunlight breaking through the clouds, creating a sense of tranquility and renewal.

In literature, weather has been used as a powerful tool to set the mood, reflect the emotions of characters, and symbolize deeper themes. Shakespeare frequently employed weather as a metaphor in his plays, with storms and tempests often representing the inner turmoil of his protagonists. In “King Lear,” the raging storm on the heath mirrors the madness and despair of the titular character, while in “The Tempest,” the storm that opens the play serves as a catalyst for the events that unfold.

The Romantic poets of the 19th century, such as William Wordsworth and Percy Bysshe Shelley, often drew inspiration from the natural world and the changing seasons. Wordsworth’s “I Wandered Lonely as a Cloud” (1807) captures the joy and wonder of stumbling upon a field of daffodils on a breezy spring day, while Shelley’s “Ode to the West Wind” (1819) invokes the power of the wind as a force of change and renewal.

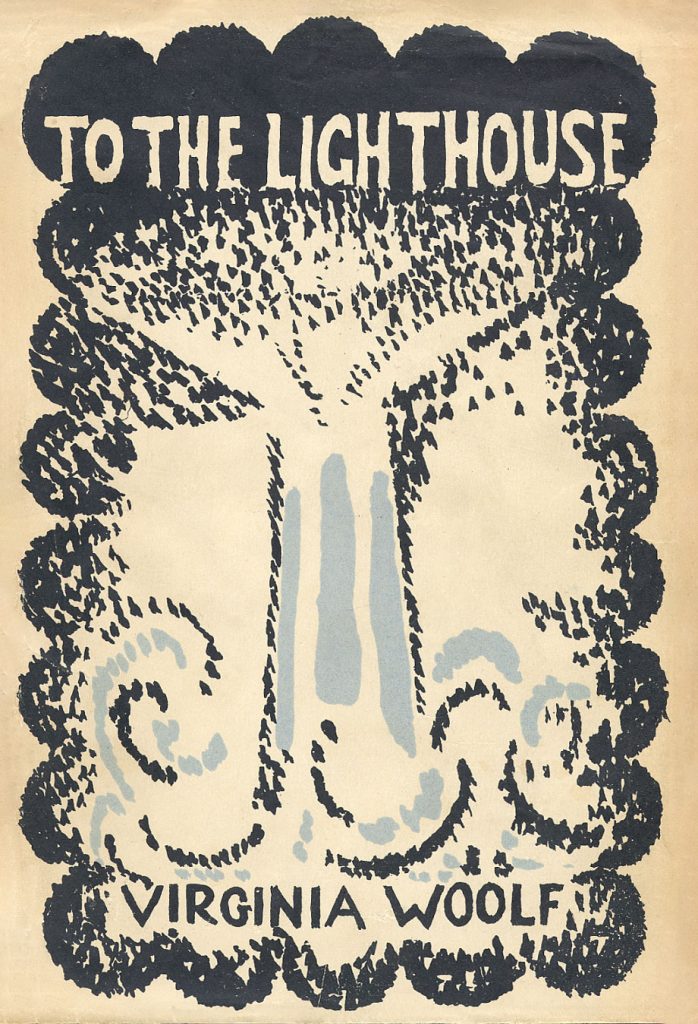
In the 20th century, modernist writers like Virginia Woolf and James Joyce used weather to create atmosphere and reflect the inner lives of their characters. In Woolf’s “To the Lighthouse” (1927), the shifting weather patterns at the seaside mirror the changing dynamics of the Ramsay family, while in Joyce’s “Ulysses” (1922), the city of Dublin is brought to life through vivid descriptions of the weather and its effects on the characters’ moods and actions.

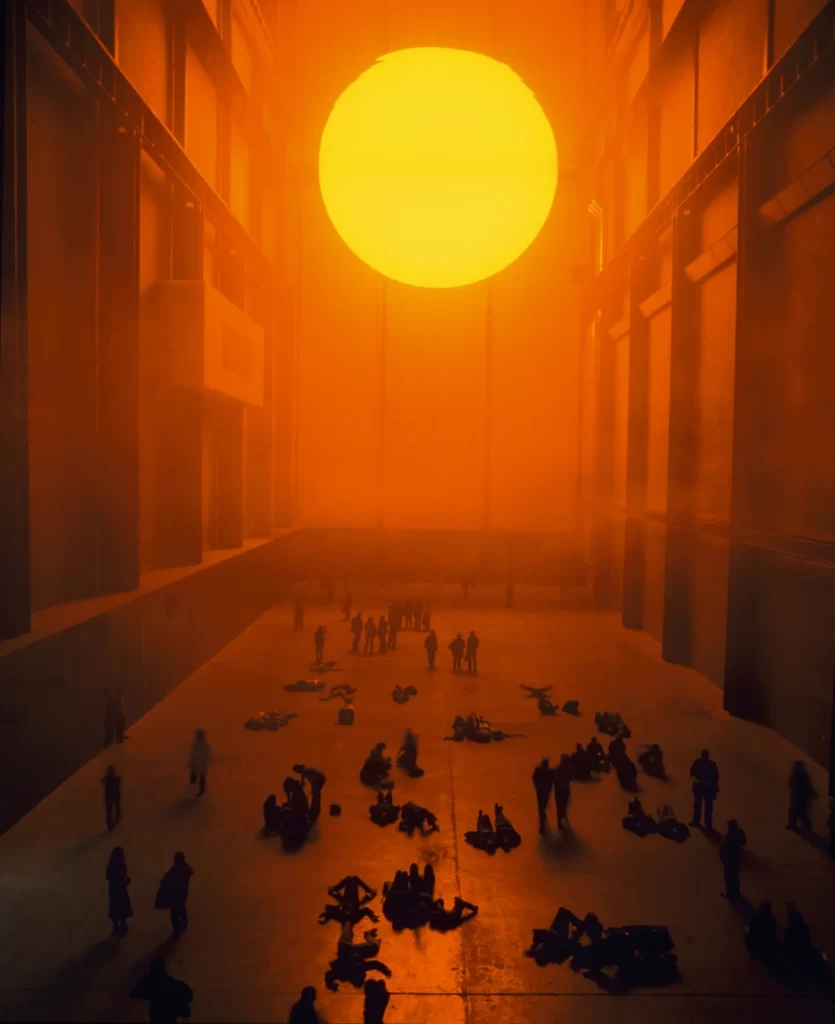
Contemporary artists and writers continue to be inspired by the weather and its many manifestations. In the world of installation art, artists like Olafur Eliasson have created immersive environments that simulate natural phenomena, such as his “The Weather Project” (2003) at the Tate Modern, which recreated the experience of a giant sun in the museum’s turbine hall. In literature, authors like Amitav Ghosh have explored the impact of climate change and extreme weather events on human lives and communities, as seen in his novel “The Hungry Tide” (2004), set in the Sundarbans delta of India and Bangladesh.

The representation of weather in art and literature serves as a reminder of our deep connection to the natural world and the power of the elements to shape our experiences and emotions. Whether captured in paint, pixels, or words, the ever-changing face of the weather continues to captivate and inspire artists and writers, inviting us to marvel at the beauty and complexity of the world around us.

From the gentle brush strokes of the Dutch Golden Age painters to the immersive installations of contemporary artists, weather has been a constant presence in the history of art. It has served as a source of inspiration, a metaphor for the human condition, and a reminder of the awesome power of nature. Similarly, in literature, weather has been used to create atmosphere, reflect the inner lives of characters, and explore deeper themes of change, renewal, and the human relationship with the environment.

Surviving the Storm: How to Build a Home That Defies Tornadoes & Hurricanes

Home strength by materials:

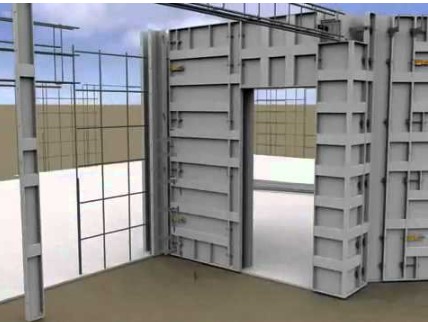
1.Reinforced concrete: Reinforced concrete is one of the most tornado-resistant materials due to its high strength and durability. The combination of concrete and embedded steel reinforcement provides excellent resistance to high winds and flying debris. Walls made of reinforced concrete should be at least 6 inches thick to provide adequate protection.
    2. Steel: Steel is another strong material that can withstand the forces of a tornado. Steel structures, such as shipping containers or specially designed safe rooms, can provide a high level of protection when anchored properly to a concrete foundation.
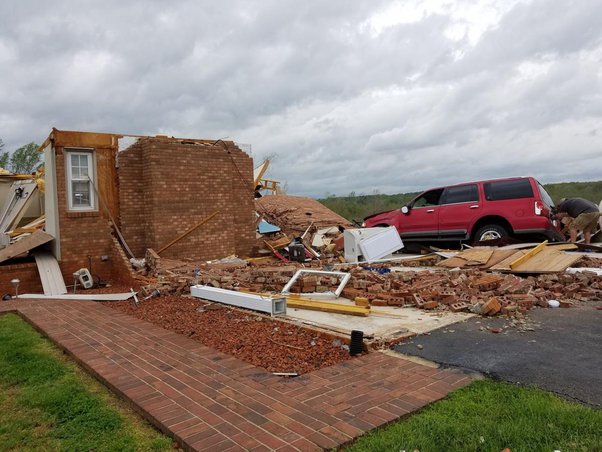
    3. Brick and masonry: While not as strong as reinforced concrete, brick and masonry structures can still offer some protection during a tornado. However, it’s important to note that unreinforced masonry can be vulnerable to collapse under extreme winds. Reinforced masonry, with steel reinforcements embedded in the mortar joints, provides a higher level of protection.
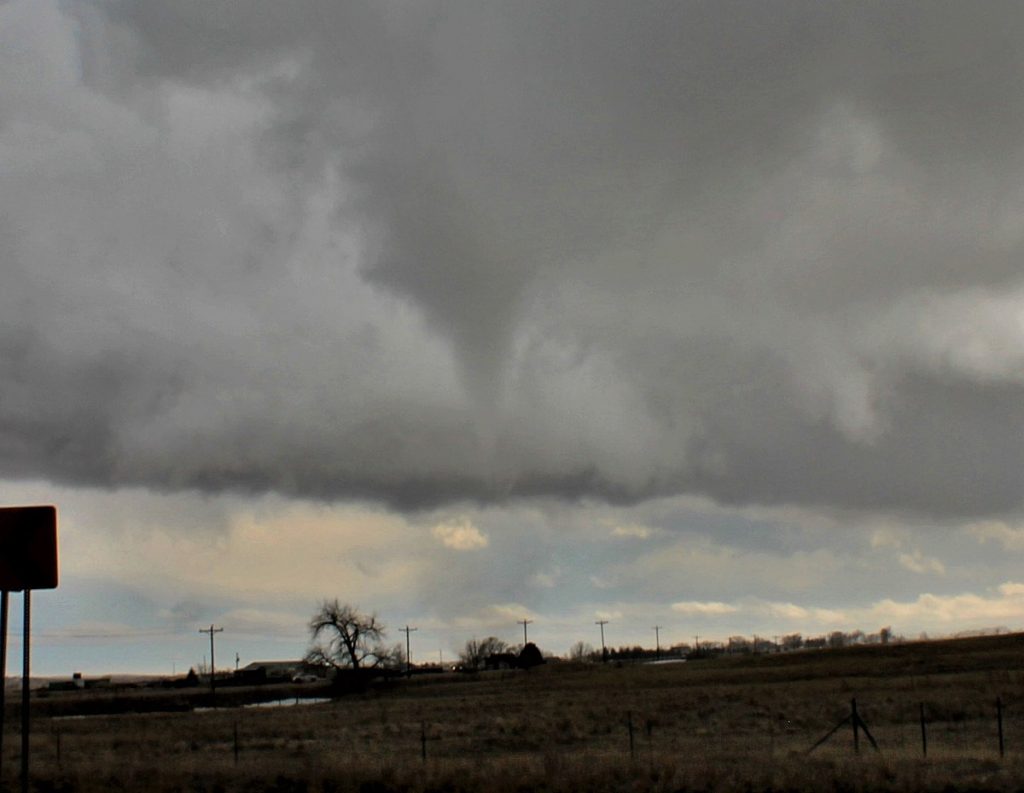
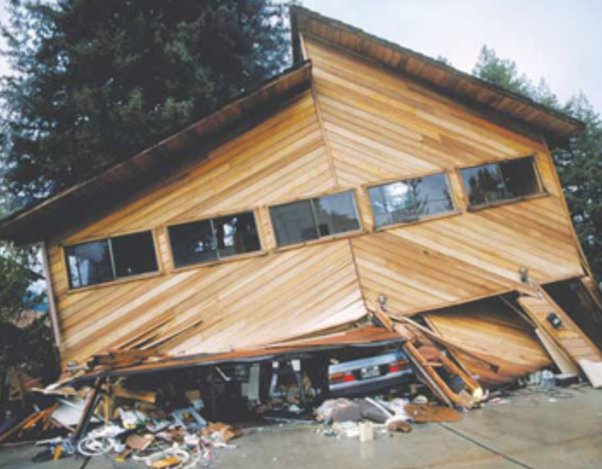
    4, Wood: Wood structures are the most vulnerable to tornado damage due to their lightweight nature and susceptibility to flying debris. However, wood-framed homes can be strengthened with the use of hurricane clips, anchor bolts, and other connectors that help tie the structure together and improve its overall resistance to wind forces.

      Rooms and Structures:

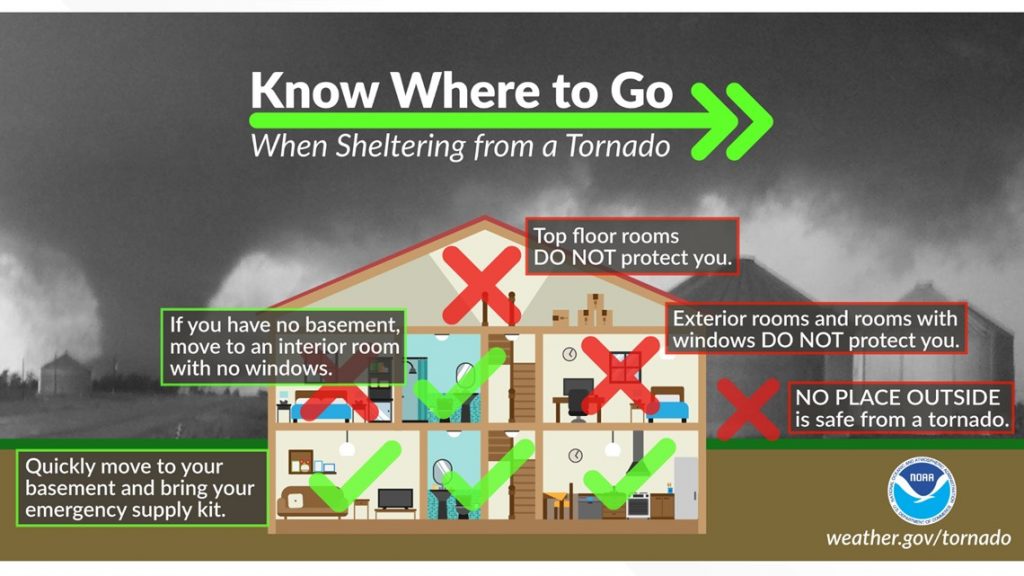
      1. Basements: Basements are one of the safest places to be during a tornado, as they are below ground level and surrounded by earth, which provides natural protection. The basement walls should be made of reinforced concrete or reinforced masonry for optimal protection. If possible, choose a corner of the basement away from windows and exterior walls.
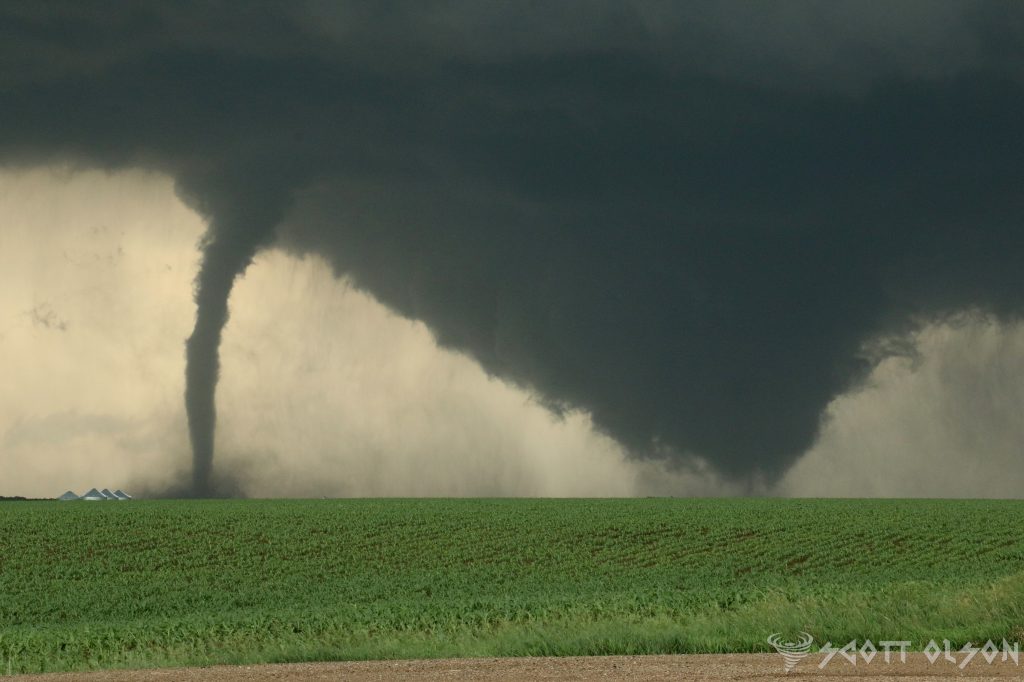
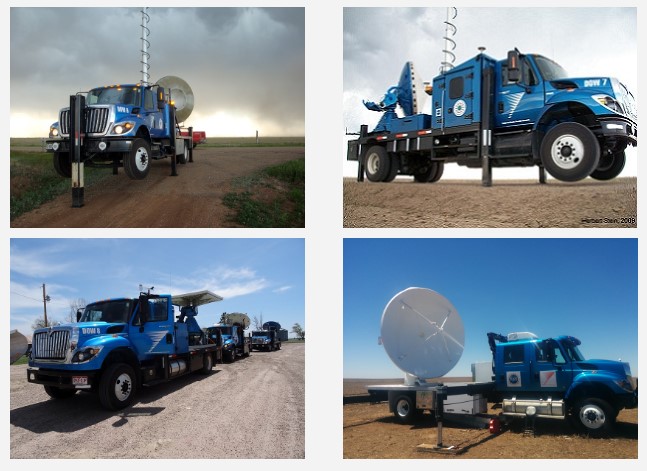
      2. Interior rooms: Small, interior rooms on the lowest floor of a building, such as closets, bathrooms, or hallways, can provide some protection during a tornado. These rooms should be located away from exterior walls and windows. The smaller the room, the better, as it will have less space for potential debris to accumulate.
      3. Bathtubs: If you don’t have access to a basement or a small interior room, a bathtub can provide some protection. Bathtubs are typically made of sturdy materials like cast iron or steel, which can withstand some impact from debris. Lie in the bathtub and cover yourself with a thick blanket or mattress for added protection.
      4. Closets: A small, interior closet can be a good place to seek shelter during a tornado. Choose a closet on the lowest floor, away from exterior walls and windows. The closet should have a strong door frame and hinges to resist wind forces.
      5. Safe rooms: Specially designed safe rooms, built to FEMA guidelines, offer the highest level of protection during a tornado. These rooms are typically constructed with reinforced concrete or steel and are anchored securely to a concrete foundation. The walls, ceiling, and door are designed to withstand extreme wind speeds and flying debris.
      6. Doorways: While it is a common misconception that doorways are safe during a tornado, they do not provide significant protection unless they are part of a specially designed safe room. In fact, doorways can be dangerous due to the potential for flying debris and the lack of structural support in modern homes.

      If you’re building a new home, here are some important considerations:

      Continuous load path: Ensure that your home’s design incorporates a continuous load path, which means that all structural elements (roof, walls, and foundation) are properly connected to transfer wind forces down to the ground. This can be achieved through the use of metal connectors, anchor bolts, and reinforced concrete.


      Impact-resistant windows and doors: Install impact-resistant windows and doors, which are designed to withstand high winds and flying debris. These may include laminated glass, reinforced frames, and sturdy hardware.


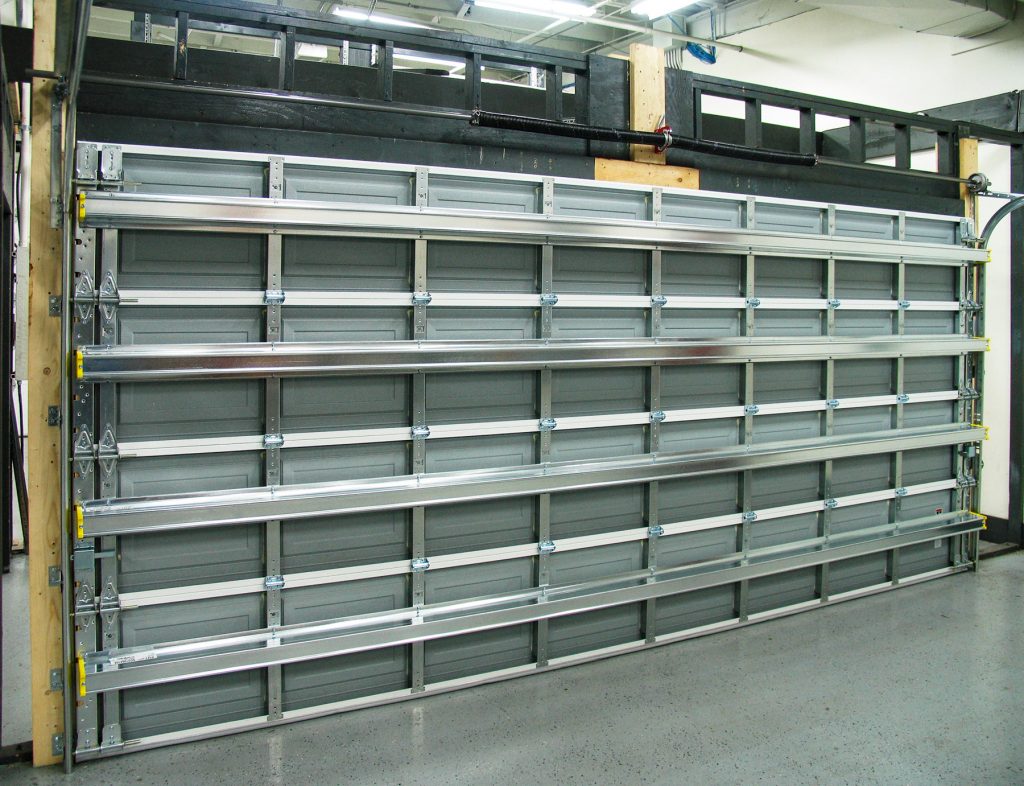
      Reinforced garage doors: Garage doors are often a weak point in a home’s structure during a tornado. Install reinforced garage doors that are designed to withstand high winds, or consider eliminating the garage altogether and opting for a carport or detached garage.


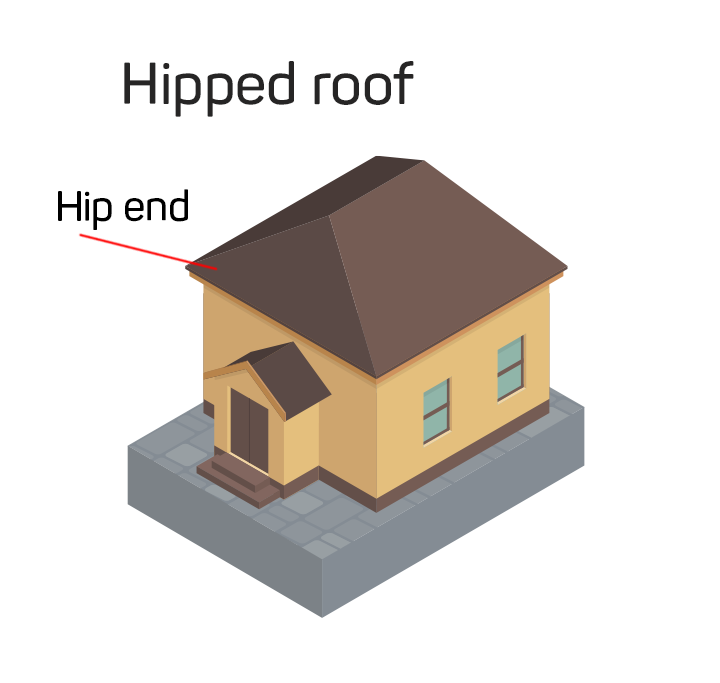
      Hip roof design: A hip roof (slopes on all four sides) is more aerodynamic and resistant to wind forces than a gable roof (slopes on two sides). If possible, incorporate a hip roof design with a 30-45 degree slope to minimize wind uplift forces.


      Proper anchoring: Ensure that your home’s foundation is properly anchored to the ground using anchor bolts or other suitable methods. This helps prevent the structure from being lifted or shifted off its foundation during a tornado.


      Minimize overhangs and projections: Reduce the size of roof overhangs, balconies, and other projections, as these can be vulnerable to wind forces and provide a pathway for wind to enter the structure.

      Properly anchoring the roof to the walls is a critical aspect of creating a continuous load path and ensuring that your home can resist the high wind forces associated with tornadoes. The goal is to create a strong, uninterrupted connection from the roof to the walls and down to the foundation. Here are some recommendations for anchoring the roof to the walls:

      1. Hurricane clips or straps: Use hurricane clips or straps to connect the roof trusses or rafters to the top plate of the exterior walls. These metal connectors are designed to resist uplift forces and prevent the roof from being separated from the walls during high winds. Hurricane clips should be installed according to the manufacturer’s specifications and local building codes.
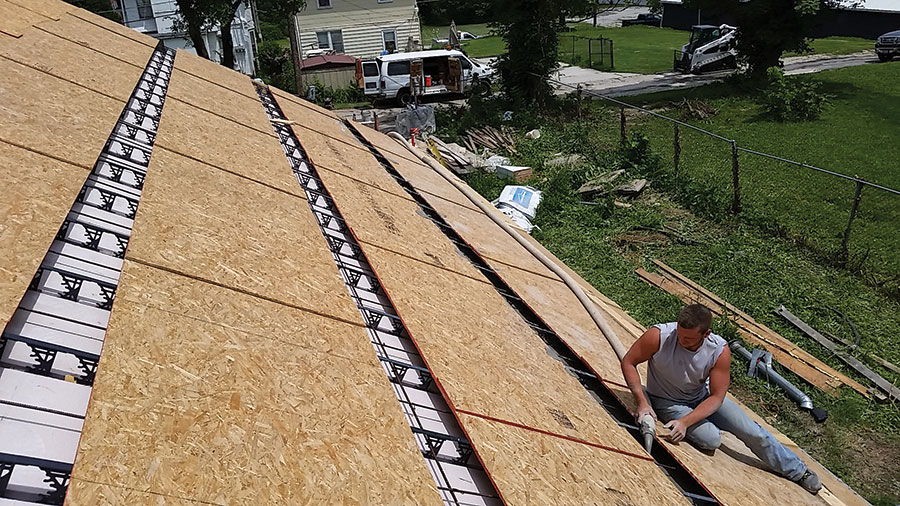
      2. Continuous roof sheathing: Use continuous roof sheathing, such as plywood or oriented strand board (OSB), to create a solid, uninterrupted surface that can distribute wind forces across the entire roof. The sheathing should be properly fastened to the roof trusses or rafters with ring-shank nails or screws.
      3. Roof-to-wall anchors: In addition to hurricane clips, consider using roof-to-wall anchors, which are heavy-duty metal connectors that tie the roof framing directly to the wall studs. These anchors provide a more robust connection and can further improve the roof’s resistance to uplift forces.
      4. Reinforced roof-to-wall connections: For added strength, consider using reinforced roof-to-wall connections, such as continuous steel straps or cables that run from the roof framing, down the exterior walls, and into the foundation. These continuous ties help transfer wind forces from the roof to the foundation, bypassing the potential weak points at the wall-to-foundation connection.
      5. Proper fastening: Ensure that all connections, including roof sheathing, hurricane clips, and anchors, are fastened using the appropriate fasteners (e.g., ring-shank nails or structural screws) and fastening patterns as specified by the manufacturer and local building codes.
      6. Gable end bracing: If your home has a gable roof, pay special attention to the gable end walls, as these are particularly vulnerable to wind forces. Install gable end bracing, such as diagonal braces or shear walls, to provide additional support and prevent the gable end from collapsing during a tornado.
      7. Professional installation: Have your roof-to-wall connections designed and installed by experienced professionals, such as licensed contractors or structural engineers, to ensure that they meet or exceed the requirements for your area’s wind loads and building codes.

      When it comes to surviving a tornado, having a dedicated storm shelter or safe room built to FEMA guidelines is the best option. However, if you don’t have access to a shelter, there are still certain types of rooms, places, home designs, materials, and structures that can increase your chances of survival during a tornado.

      1. Basements: If your home has a basement, it is one of the safest places to be during a tornado. The below-ground location provides added protection from flying debris and the collapse of the structure above. Choose a corner of the basement away from windows and exterior walls. If possible, get under a sturdy piece of furniture like a table or workbench for added protection.
      2. Interior rooms: If you don’t have a basement, seek shelter in a small, interior room on the lowest floor of your home. Closets, bathrooms, and hallways are often good choices, as they are typically located away from exterior walls and have a smaller area that can be more easily reinforced. In a bathroom, the plumbing in the walls can provide additional structural support.
      3. Center of the house: The center of your home is usually the most structurally sound area, as it is furthest from the exterior walls that are more vulnerable to damage from high winds and flying debris.
      4. Rooms with no windows: Windows are weak points in your home’s structure and can easily shatter during a tornado, creating a dangerous situation with flying glass. Choose a room with no windows or the fewest windows possible.
      5. Manufactured homes: Manufactured homes, also known as mobile homes, are particularly vulnerable to tornadoes due to their lightweight construction and lack of a solid foundation. If you live in a manufactured home, it is crucial to have a separate storm shelter or evacuate to a sturdy building before the tornado hits.
      6. Concrete and brick structures: Homes made of concrete or brick are generally more resistant to tornado damage than those made of wood or other lightweight materials. The added weight and strength of these materials can help the structure withstand high winds and flying debris.
      7. Safe rooms: If you don’t have a basement or storm shelter, consider building or installing a safe room in your home. These rooms are specifically designed to withstand extreme winds and flying debris. They can be constructed from reinforced concrete, steel, or other materials and should be anchored securely to a solid foundation.
      8. Helmets and protective covering: Regardless of where you take shelter, protect your head and neck by wearing a helmet, such as a bicycle or motorcycle helmet. Cover your body with thick blankets, sleeping bags, or even a mattress to shield yourself from flying debris.
      9. Avoid certain areas: During a tornado, stay away from exterior walls, doors, and windows. Also, avoid rooms with large spans, such as gymnasiums, auditoriums, or warehouses, as the roof is more likely to collapse in these spaces.
      10. Community shelters: If your home does not have a suitable place to take shelter, familiarize yourself with community shelters in your area. These can include schools, public buildings, or designated storm shelters.

      Is it possible to have two tornadoes at the same time?

      Tornadoes are one of the most destructive and fascinating weather phenomena on Earth. These rapidly rotating columns of air can cause significant damage and pose a serious threat to life and property. While most people are familiar with the concept of a single tornado, the question of whether two tornadoes can exist simultaneously is a topic of interest for meteorologists and weather enthusiasts alike. In this article, we will explore the possibility of concurrent tornadoes, focusing on the processes of cyclic tornadogenesis and occluding mesocyclones.

      Cyclic Tornadogenesis: Cyclic tornadogenesis is a process by which a supercell thunderstorm produces multiple tornadoes over its lifetime. This phenomenon occurs when a supercell’s mesocyclone (a rotating updraft) undergoes a series of cycles, each producing a new tornado. As the first tornado dissipates, the mesocyclone reorganizes and gives birth to a subsequent tornado. This process can repeat several times, resulting in a series of tornadoes forming from the same parent supercell.

      Research has shown that cyclic tornadogenesis is more likely to occur in environments with strong wind shear and high instability. A study by Adlerman and Droegemeier (2005) used high-resolution numerical simulations to investigate the mechanisms behind cyclic mesocyclogenesis. They found that the cycling process is driven by the interaction between the rear-flank downdraft (RFD) and the updraft, which leads to the formation of a new mesocyclone and subsequent tornadogenesis.

      Occluding Mesocyclones and Simultaneous Tornadoes: An occluding mesocyclone is a mesocyclone that is in the process of dissipating, often due to the ingestion of cooler, more stable air from the rear-flank downdraft. During this occlusion process, it is possible for the original tornado to still be present while a new mesocyclone and tornado are forming. This scenario can lead to the presence of two simultaneous tornadoes.

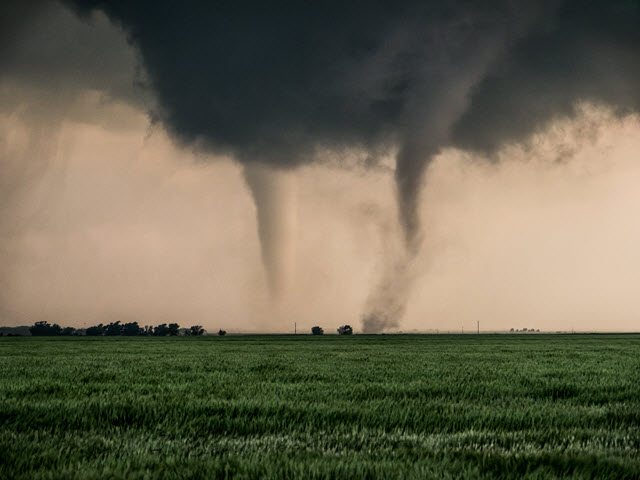
      On June 16, 2014, the town of Pilger, Nebraska, experienced a rare and devastating tornado event. Two tornadoes, both rated as violent EF-4, touched down simultaneously and caused significant damage to the town. This event is a notable example of simultaneous tornadoes occurring as a result of cyclic tornadogenesis.

      The Pilger tornado event was well-documented by storm chasers and researchers, providing valuable data for studying the formation and evolution of these concurrent tornadoes. Wicker et al. (2015) analyzed the event using high-resolution radar data and found evidence of cyclic mesocyclogenesis. The study revealed that the two tornadoes formed from separate mesocyclones within the same supercell thunderstorm, with the second tornado developing as the first one was weakening.

      The simultaneous occurrence of the Pilger tornadoes highlights the complexity of cyclic tornadogenesis and the potential for multiple tornadoes to form within a single supercell. This event also emphasizes the importance of advanced radar technology and real-time observations in understanding and forecasting these rare and dangerous phenomena.

      Multi-Vortex Tornadoes: Multi-vortex tornadoes are another fascinating aspect of tornado dynamics. These tornadoes are characterized by the presence of multiple smaller vortices rotating around a central axis. While multi-vortex tornadoes are not the same as simultaneous tornadoes, they demonstrate the complex nature of tornado structure and the potential for multiple vortices to exist within a single tornado.

      Agee et al. (1977) conducted one of the earliest studies on multi-vortex tornadoes, using photographs and films to analyze the structure and evolution of these tornadoes. They found that multi-vortex tornadoes often exhibit a cyclic behavior, with vortices forming, merging, and dissipating over time. This cyclic nature of multi-vortex tornadoes is similar to the cyclic tornadogenesis process observed in supercell thunderstorms.

      More recent studies, such as those by Wurman and Kosiba (2013) and Wakimoto et al. (2016), have used high-resolution mobile Doppler radar data to investigate the dynamics of multi-vortex tornadoes. These studies have revealed the complex interactions between the main vortex and the smaller subvortices, as well as the role of surface friction and debris in modulating the structure and intensity of multi-vortex tornadoes.

      The presence of multiple vortices can lead to more erratic and unpredictable tornado paths, as well as localized areas of intense damage. Additionally, the cyclic nature of multi-vortex tornadoes can make it challenging to issue timely and accurate warnings, as the tornado’s intensity and structure can change rapidly.

      Unraveling the Mystery: Why Severe Storms Have Green, Teal, and Blue Colors

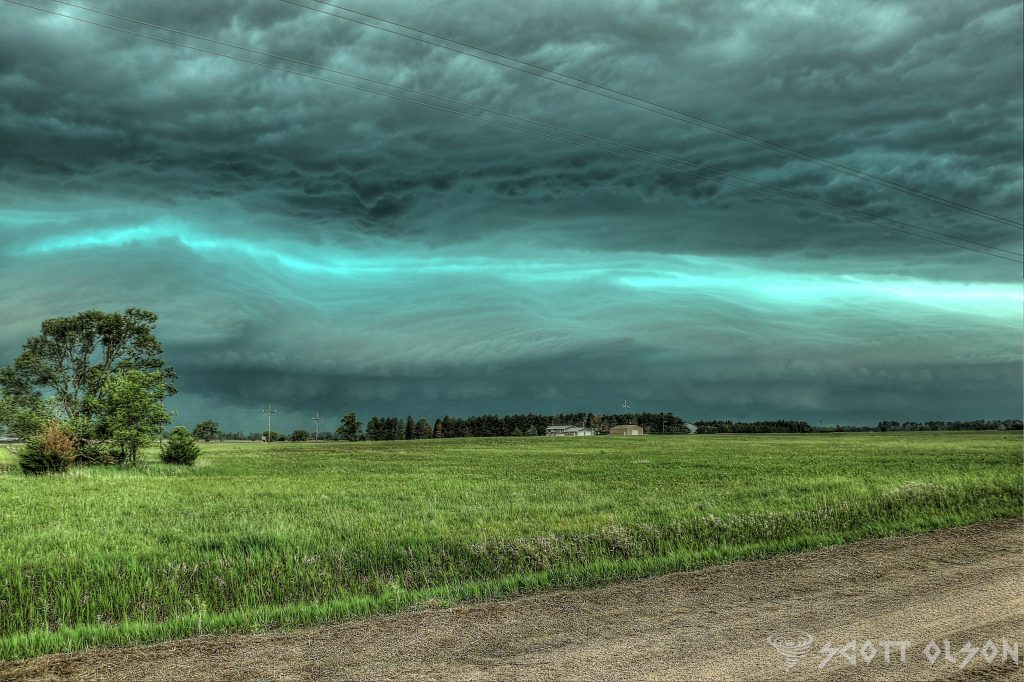
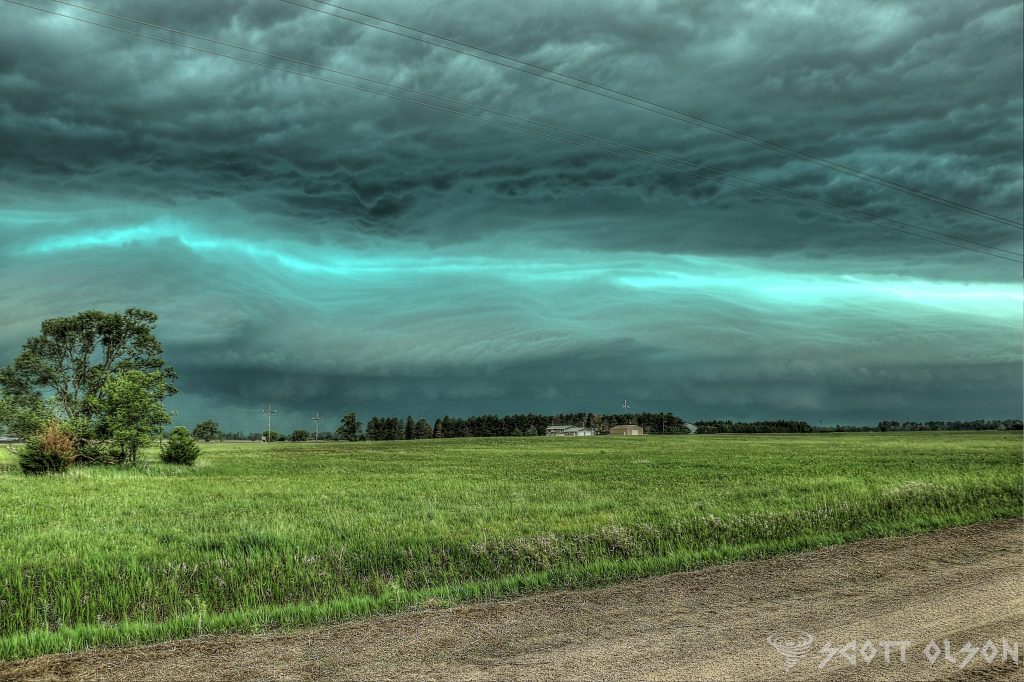
      Supercell thunderstorms are among the most awe-inspiring and powerful weather phenomena on Earth. These storms are characterized by their rotating updrafts, known as mesocyclones, which can produce severe weather conditions such as large hail, damaging winds, and even tornadoes. One of the most striking features of supercells is the occasional appearance of a green or teal color in the sky, particularly near the storm’s base. This unique coloration has fascinated both weather enthusiasts and scientists alike, prompting numerous studies to unravel the mystery behind this phenomenon.

      The presence of these large water droplets is crucial to the formation of the green or teal color. Water droplets are particularly effective at absorbing red light, which is at the longer wavelength end of the visible spectrum. As sunlight enters the storm and interacts with these water droplets, a significant portion of the red light is absorbed, leaving the remaining light dominated by shorter wavelengths, which correspond to blue and green colors.

      However, the absorption of red light by water droplets alone is not sufficient to explain the intense green or teal hue sometimes observed. Another critical factor is the presence of ice crystals in the upper portions of the storm, particularly in the updraft and the rear flank downdraft (RFD). The RFD is another area of descending air, located on the back side of the storm, often associated with strong winds and large hail.

      Ice crystals in the upper portions of the storm can scatter the remaining blue light, further enhancing the green appearance. The combination of red light absorption by water droplets in the lower levels and blue light scattering by ice crystals in the upper levels creates the distinctive green or teal color.

      The green coloration is most likely to be observed when the sun is at a low angle on the horizon, typically during the late afternoon or early evening. During this time, sunlight has to travel through more of the Earth’s atmosphere, which can further filter out red light and enhance the green appearance. Additionally, the presence of large amounts of hail in the storm can intensify the green color, as hail can also absorb and scatter light in a manner similar to water droplets and ice crystals. Most storm chasers have experienced the largest hail when storms take on green and teal colors.

      It is important to note that not all supercells exhibit a green or teal color, and the absence of this coloration does not necessarily indicate a less severe storm. The appearance of the green hue depends on a delicate balance of factors, including the storm’s structure, the concentration and size of hydrometeors, and the angle of the sun.

      While the green or teal color in supercells is a fascinating phenomenon, it is important to remember that it is often associated with the most severe and dangerous storms. Supercells that exhibit this coloration are likely to be producing large hail, damaging winds, and possibly even tornadoes. If you find yourself in the vicinity of a supercell with a green or teal hue, it is crucial to seek shelter immediately and follow the advice of local weather authorities.

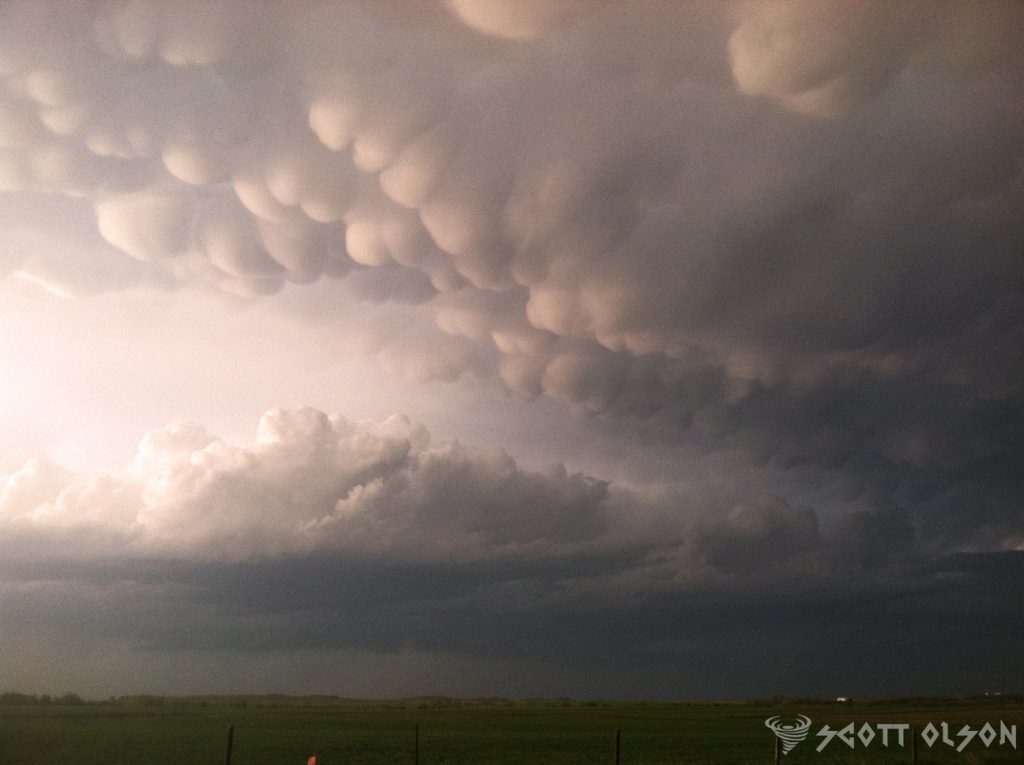
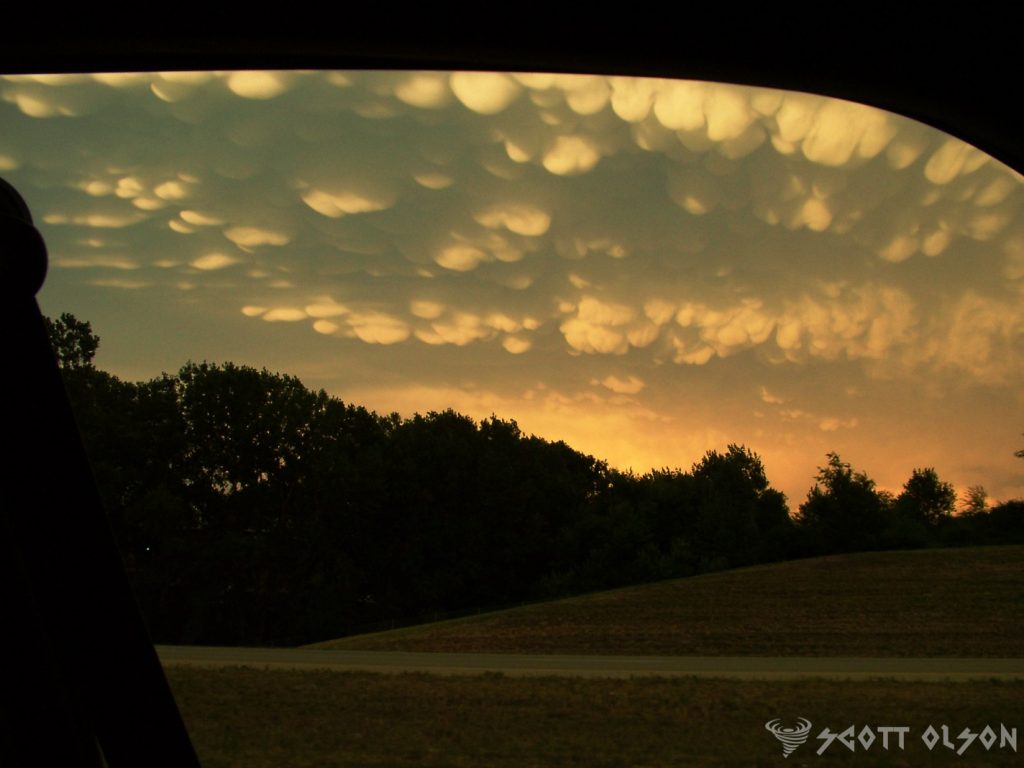
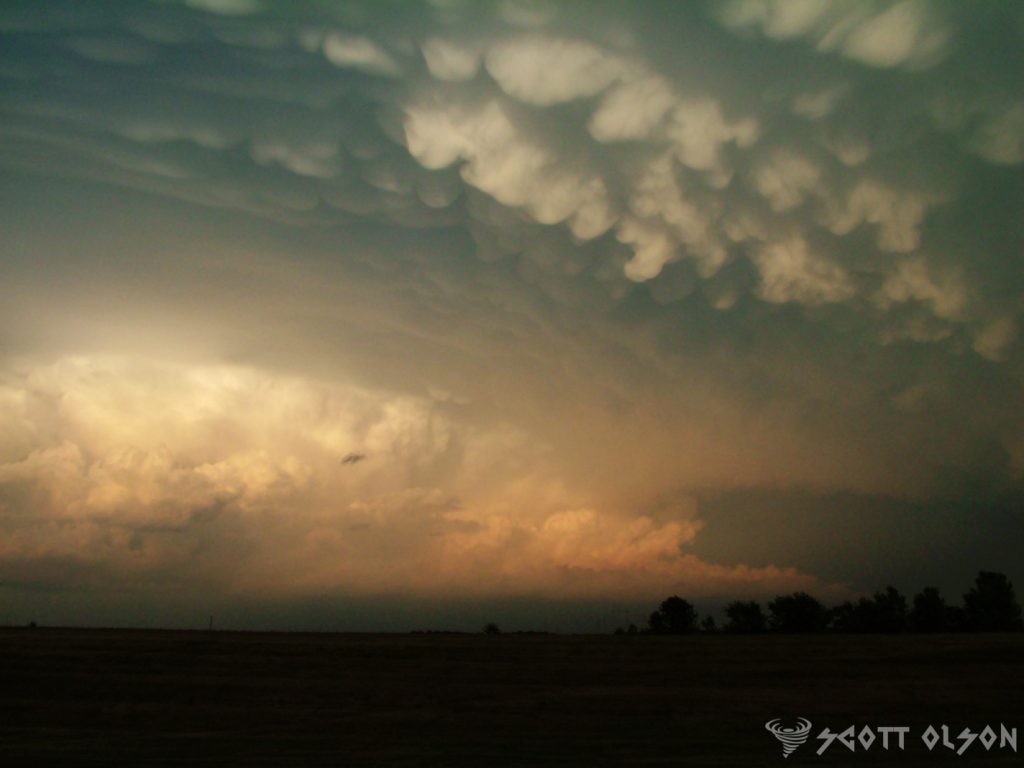
      Mammatus Clouds: Nature’s Breathtaking Spectacle in the Sky

      Have you ever gazed up at the sky and witnessed a mesmerizing display of pouches or bubble-like structures hanging from the underside of a cloud? If so, you’ve had the privilege of observing one of nature’s most captivating phenomena: mammatus clouds. These distinctive formations have intrigued scientists, photographers, and cloud enthusiasts alike for centuries, and their appearance never fails to leave observers in awe.

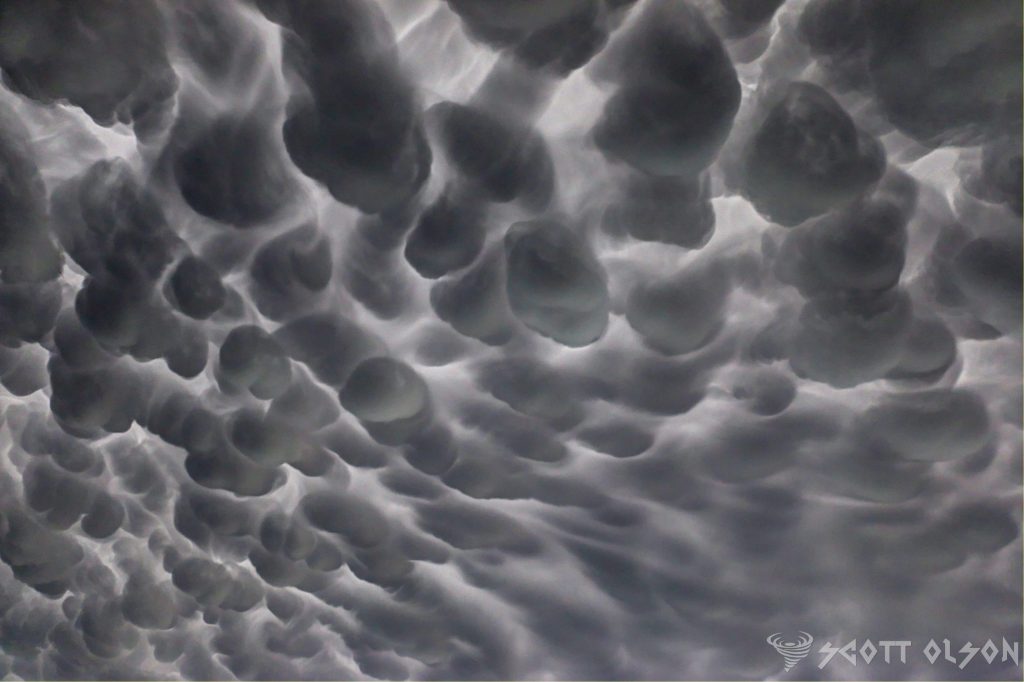
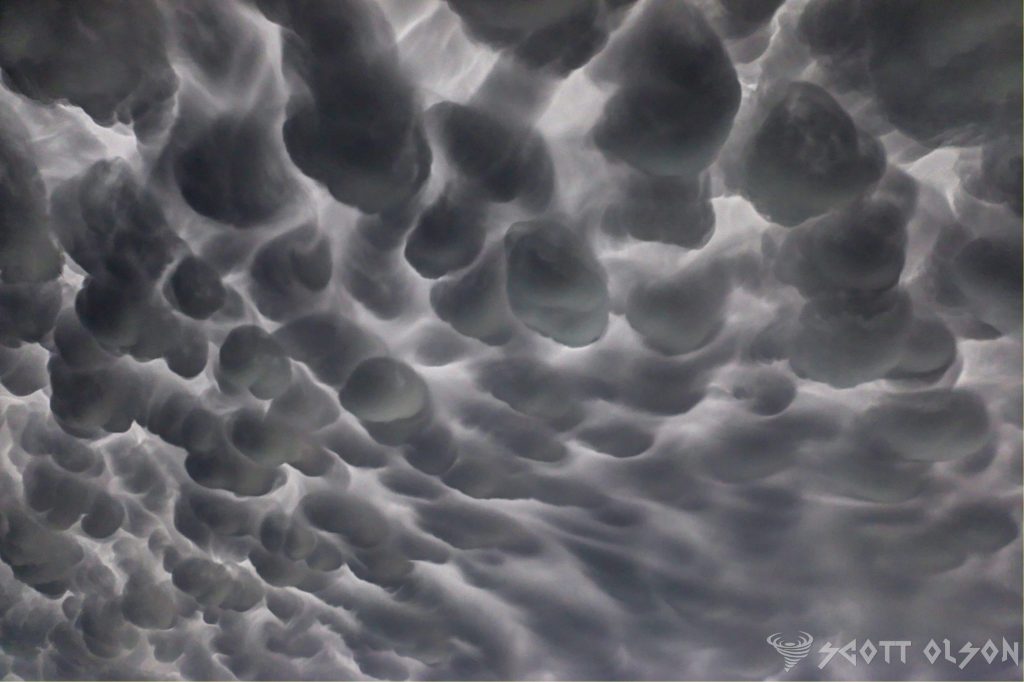
      Mammatus clouds, scientifically known as mammatocumulus, are a rare and stunning sight to behold. The term “mammatus” is derived from the Latin word “mamma,” meaning “udder” or “breast,” which aptly describes the appearance of these clouds. They are characterized by their unique pouch-like protrusions that hang down from the base of a cloud, creating a striking visual contrast against the sky.

      The formation of mammatus clouds is a complex process that involves a combination of atmospheric conditions. These clouds typically occur in association with large cumulonimbus clouds, which are the towering thunderstorm clouds responsible for heavy rainfall, lightning, and even tornadoes. As the cumulonimbus cloud begins to dissipate, the sinking motion of cold air within the cloud can cause the formation of mammatus clouds.

      One of the leading theories behind the formation of mammatus clouds suggests that they are the result of a process called “cloud-base detrainment.” This occurs when cold, dense air from the upper parts of the cumulonimbus cloud sinks and pushes into the warmer, more humid air below. As the cold air descends, it creates a series of lobes or pouches that protrude from the bottom of the cloud, giving rise to the distinctive mammatus appearance.

      Another factor that contributes to the formation of mammatus clouds is the presence of strong wind shear. Wind shear refers to the change in wind speed or direction with height in the atmosphere. When there is a significant difference in wind speed or direction between the upper and lower levels of a cumulonimbus cloud, it can cause the cloud to become unstable and promote the development of mammatus structures.

      The sight of mammatus clouds is not only visually stunning but also a testament to the incredible forces at work in Earth’s atmosphere. These clouds often appear during severe weather events, such as thunderstorms or even tornadoes, adding an element of drama and intensity to the sky. The pouches can range in size from small, grape-like structures to large, udder-like protrusions that can span several kilometers in length.

      Mammatus clouds are not only a treat for the eyes but also a subject of fascination for scientists and researchers. While the exact mechanisms behind their formation are still being studied, these clouds serve as a reminder of the complex and dynamic nature of our atmosphere. They showcase the delicate interplay between temperature, humidity, and wind, resulting in a breathtaking display that captures the imagination of all who witness it.

      For photographers and cloud enthusiasts, mammatus clouds present a unique opportunity to capture nature’s artistry at its finest. The contrast between the dark, ominous base of the cumulonimbus cloud and the soft, billowing pouches of the mammatus creates a striking visual composition that is both eerie and beautiful. Many photographers spend hours chasing storms and waiting patiently for the perfect moment to capture these elusive clouds in all their glory.

      Beyond their aesthetic appeal, mammatus clouds also serve as an important indicator of atmospheric conditions. Their presence often signifies the potential for severe weather, such as strong winds, hail, or even tornadoes. Meteorologists and weather forecasters pay close attention to the development of mammatus clouds, as they can provide valuable insights into the stability of the atmosphere and the likelihood of extreme weather events.

      Mammatus clouds are a true marvel of nature, captivating the hearts and minds of people around the world. Their unique appearance, born from the complex interplay of atmospheric conditions, serves as a reminder of the awe-inspiring beauty and power of our planet’s weather systems. Whether you are a scientist, photographer, or simply someone who appreciates the wonders of the natural world, the sight of mammatus clouds is an unforgettable experience that will leave you marveling at the incredible forces at work in the sky above us.

      So the next time you find yourself gazing up at a stormy sky, keep an eye out for these mesmerizing pouches of clouds. Take a moment to appreciate the intricate dance of nature’s elements that come together to create such a spectacular display.

      Inside the Storm: Decoding Radar’s Secrets – From Bow Echo to Debris Ball

      Radar meteorology is one of the most important tools for monitoring and predicting severe weather events. By analyzing radar data, meteorologists can identify specific features that indicate the presence of dangerous storms, such as supercell thunderstorms and tornadoes. In this article, we will discuss some of the most common radar features to look for when assessing severe weather threats.

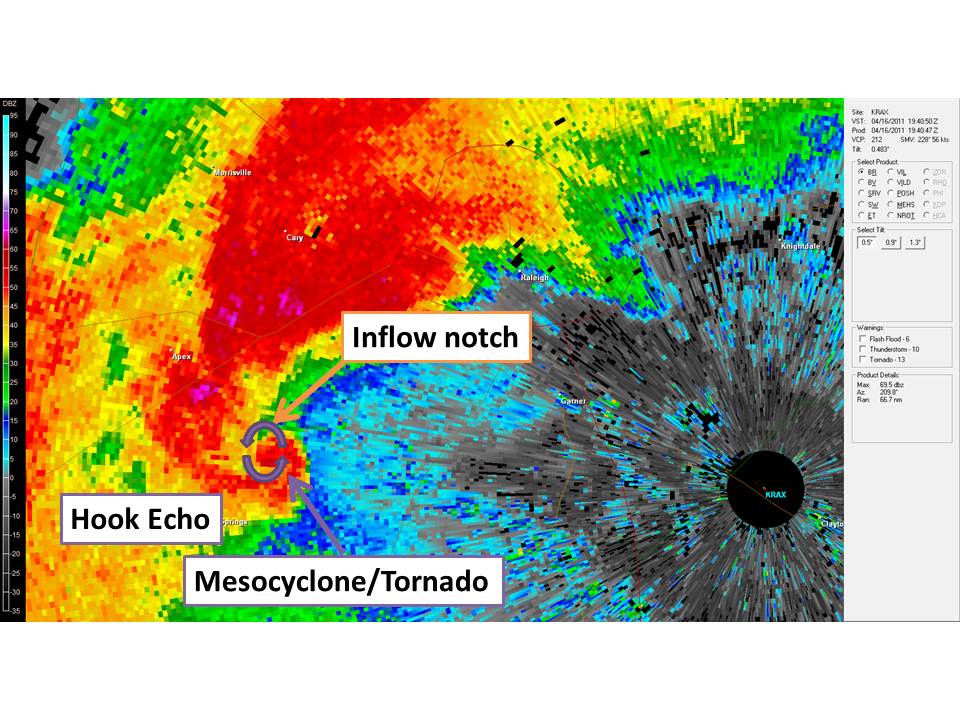
      1. Hook Echo:
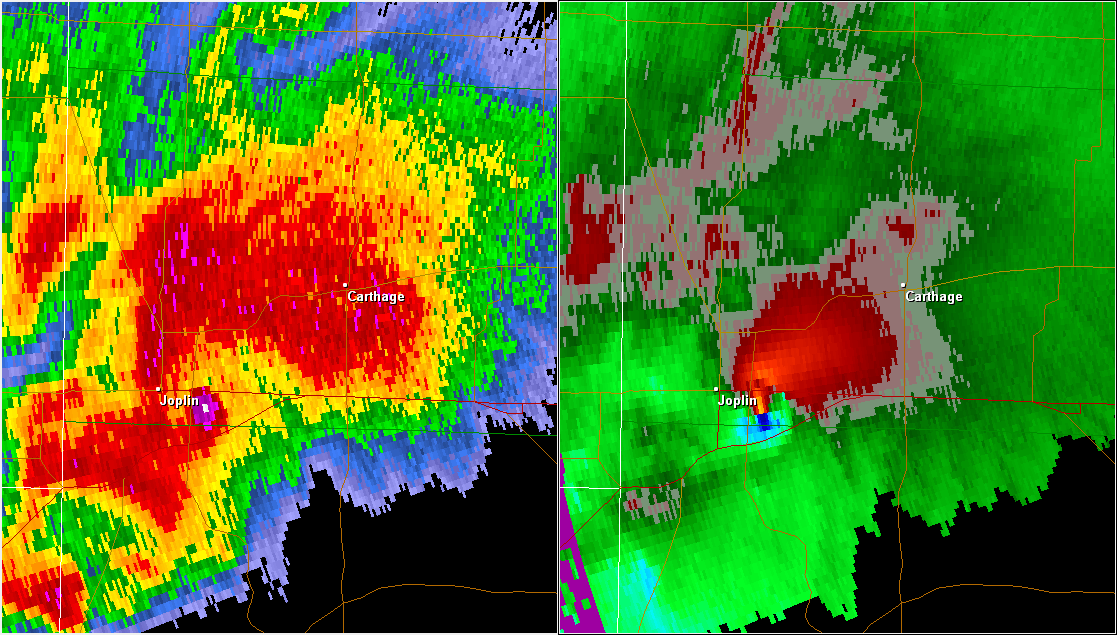
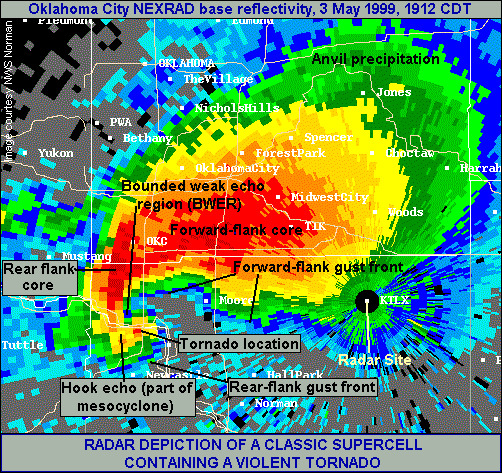
        A hook echo is a distinctive radar signature that often indicates the presence of a supercell thunderstorm capable of producing tornadoes. This feature appears as a hook-shaped appendage extending from the main storm cell on the radar display. The hook shape is formed by the rotation of the storm’s updraft, which can cause rain and hail to wrap around the updraft, creating a hook-like appearance.

        When a hook echo is detected, it is essential to monitor the storm closely, as it has a higher likelihood of producing a tornado. The tightness and persistence of the hook echo can provide clues about the storm’s intensity and potential for tornadogenesis. A tight, well-defined hook echo that persists for an extended period is more likely to be associated with a strong, long-lived tornado.

        1. Bow Echo:
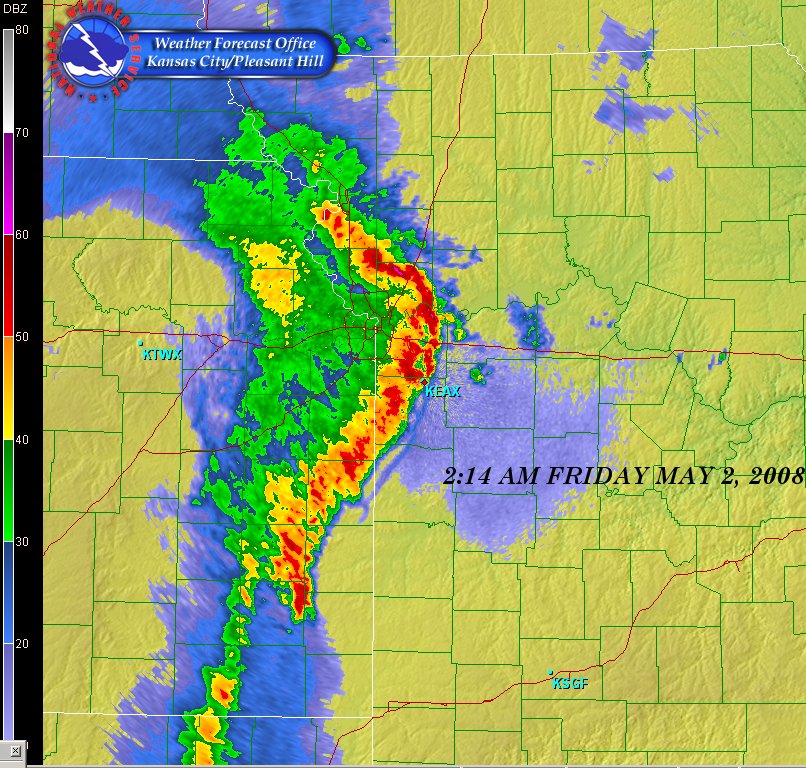
          A bow echo is a radar signature that indicates the presence of a strong, linear wind storm known as a derecho. This feature appears as a bow-shaped line of storms on the radar display, with the apex of the bow pointing in the direction of the storm’s movement. Bow echoes are often associated with widespread damaging winds, which can exceed 100 mph in extreme cases.

        The formation of a bow echo is related to the development of a strong rear-inflow jet behind the main line of storms. This jet of fast-moving air descends to the surface and spreads out, causing the line of storms to bow outward. As the rear-inflow jet continues to strengthen, it can lead to the formation of embedded circulations within the line, known as mesovortices, which can produce brief, spin-up tornadoes.

        1. Debris Ball:
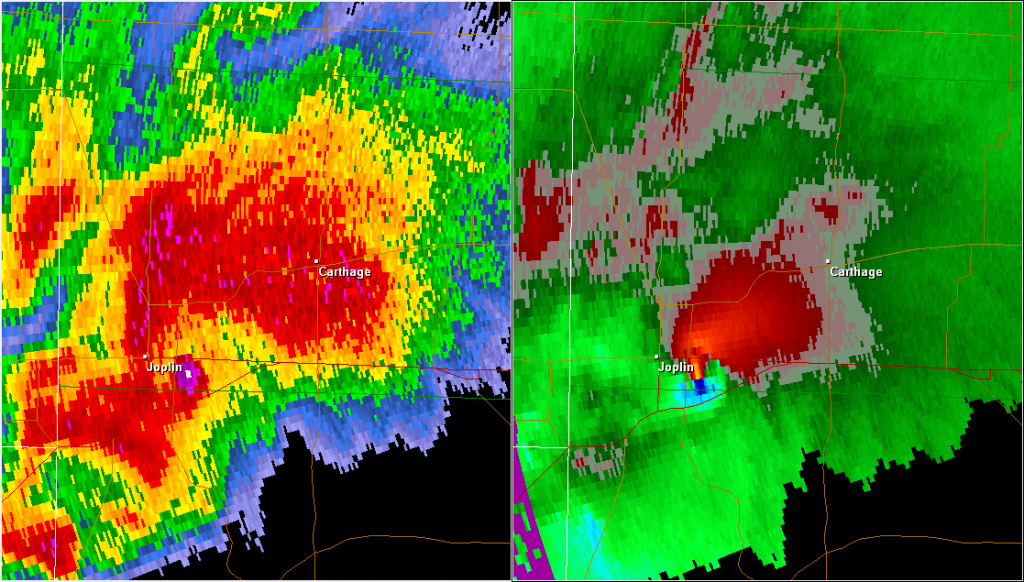
          A debris ball, also known as a tornado debris signature (TDS), is a radar feature that indicates the presence of lofted debris associated with a tornado. This signature appears as a localized area of high reflectivity (bright colors) on the radar display, often coinciding with the location of a hook echo or other tornado-related features.

        The debris ball is caused by the tornado lofting large amounts of debris, such as trees, building materials, and other objects, high into the air. When the radar beam intersects this debris, it produces a strong return signal, which appears as a bright, concentrated area on the radar display. The presence of a debris ball is a strong indication that a tornado is causing damage on the ground.

        1. Three-Body Scatter Spike (TBSS):
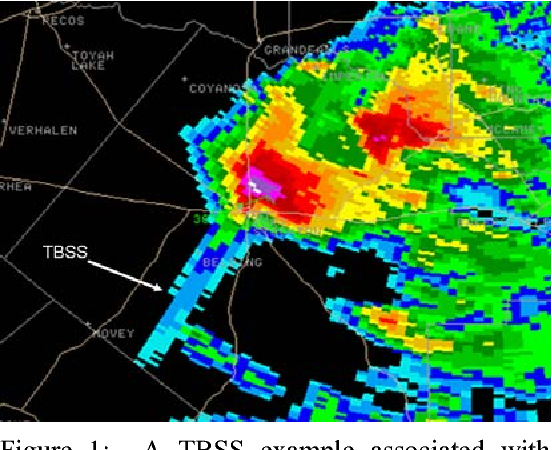
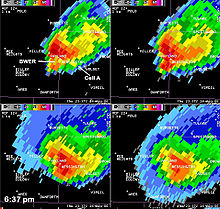
          A three-body scatter spike is a radar signature that can indicate the presence of a large hail core within a thunderstorm. This feature appears as a narrow, linear spike of high reflectivity extending radially outward from the storm on the radar display. The TBSS is caused by the radar beam reflecting off a layer of large hailstones and then reflecting again off the ground before returning to the radar.

        The presence of a TBSS suggests that the storm contains a significant amount of large hail, which can cause extensive damage to property and pose a serious risk to public safety. When a TBSS is detected, it is important to issue warnings for large hail and to advise people to seek shelter immediately.

        1. Bounded Weak Echo Region (BWER):
          A bounded weak echo region is a radar feature that indicates the presence of a strong, persistent updraft within a thunderstorm. This feature appears as a localized area of low reflectivity (dark colors) surrounded by higher reflectivity values on the radar display. The BWER is caused by the strong updraft lifting precipitation particles high into the storm, creating a region of relatively low radar returns.

        The presence of a BWER suggests that the storm has a powerful updraft, which can support the formation of large hail and tornadoes. When a BWER is detected, it is important to monitor the storm closely for the development of other severe weather signatures, such as hook echoes or debris balls.

        1. Inflow Notch:
          An inflow notch is a radar signature that indicates the presence of strong, localized inflow into a thunderstorm. This feature appears as a small, localized area of low reflectivity (dark colors) along the leading edge of the storm on the radar display. The inflow notch is caused by the rapid inflow of warm, moist air into the storm, which can fuel the development of strong updrafts and severe weather.

        The presence of an inflow notch suggests that the storm is actively ingesting warm, moist air, which can lead to rapid intensification and the formation of severe weather hazards, such as large hail, damaging winds, and tornadoes. When an inflow notch is detected, it is important to monitor the storm closely for the development of other severe weather signatures.

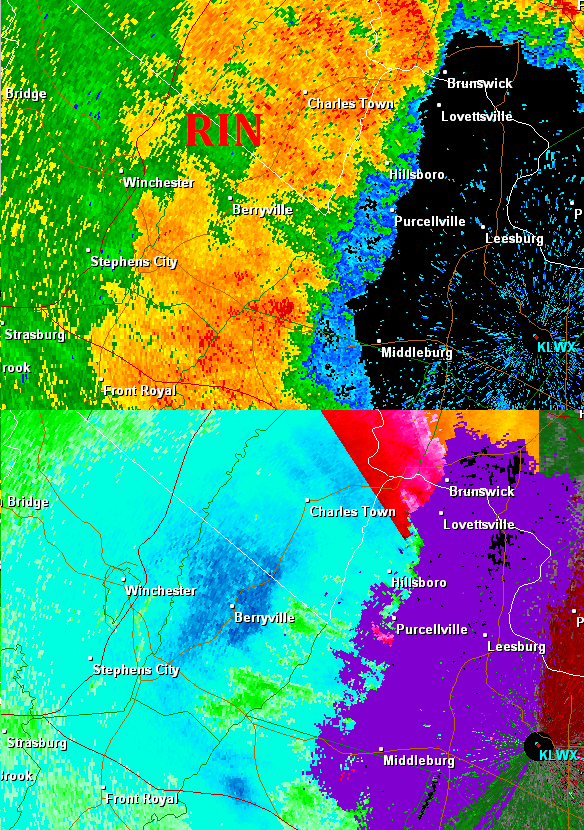
        1. Rear Inflow Notch (RIN):
          A rear inflow notch is a radar feature that indicates the presence of strong, localized inflow into the back side of a thunderstorm. This feature appears as a small, localized area of low reflectivity (dark colors) along the rear flank of the storm on the radar display. The RIN is caused by the rapid inflow of cooler, drier air into the storm, which can help to strengthen the storm’s updraft and increase the potential for severe weather.

        The presence of a RIN suggests that the storm is actively ingesting cooler, drier air on its back side, which can lead to the formation of a strong rear-flank downdraft (RFD). The RFD can help to tighten the storm’s rotation and increase the risk of tornadogenesis. When a RIN is detected, it is important to monitor the storm closely for the development of hook echoes, debris balls, and other tornado-related signatures.

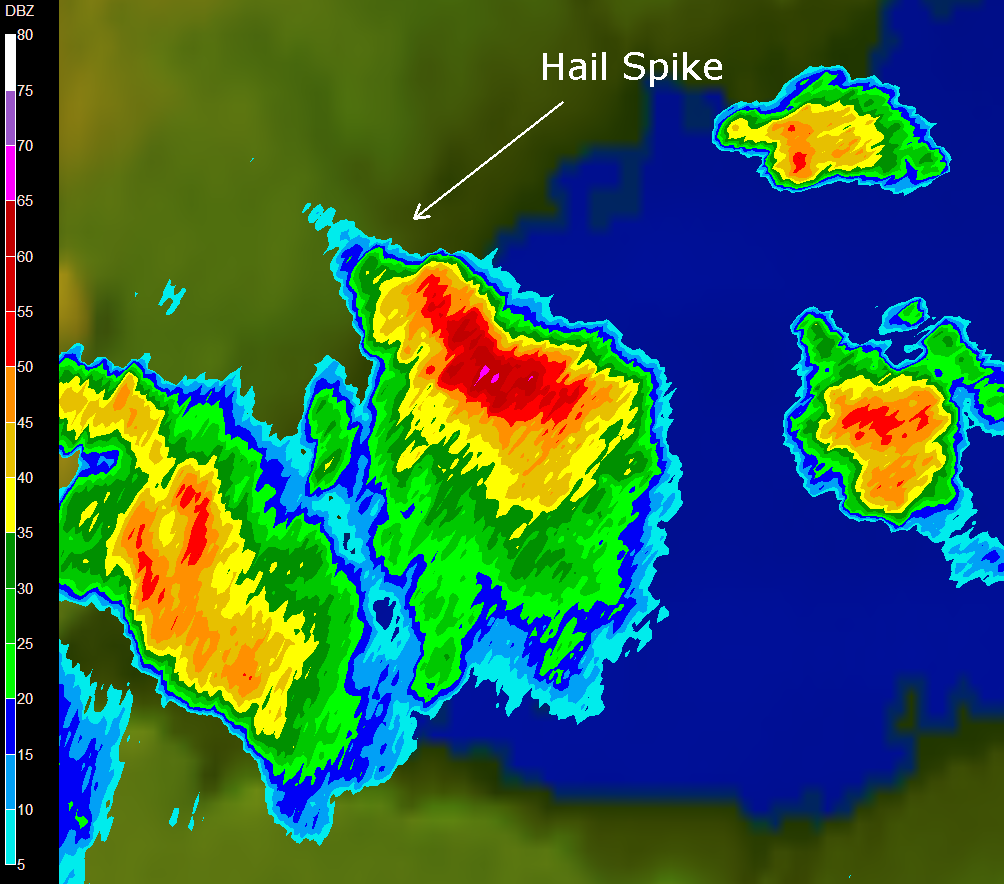
        1. Hail Spike:
          A hail spike is a radar signature that indicates the presence of a strong updraft capable of producing large hail. This feature appears as a narrow, vertical spike of high reflectivity extending upward from the storm on the radar display. The hail spike is caused by the strong updraft lofting large hailstones high into the storm, where they can grow even larger before falling back to the ground.

        The presence of a hail spike suggests that the storm has a powerful updraft that can support the formation of large, damaging hail. When a hail spike is detected, it is important to issue warnings for large hail and to advise people to seek shelter immediately.

        Hurricanes and Climate Change: Is There a Connection?

        As the world grapples with the increasingly visible effects of climate change, one question that often arises is whether there is a link between global warming and the frequency and intensity of hurricanes. To shed light on this complex issue, we spoke with leading climate scientists and examined the latest research on the subject.

        The Basics of Hurricane Formation:


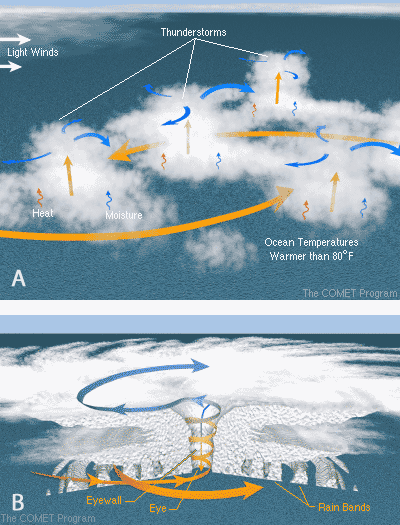
        Before going into the potential connection between hurricanes and climate change, it’s key to understand how these powerful storms form. Hurricanes, also known as tropical cyclones, are fueled by warm ocean waters and low wind shear. As warm, moist air rises from the ocean surface, it creates an area of low pressure, which draws in more air from surrounding areas. This process continues, causing the storm to rotate and intensify.

        Rising Sea Surface Temperatures:


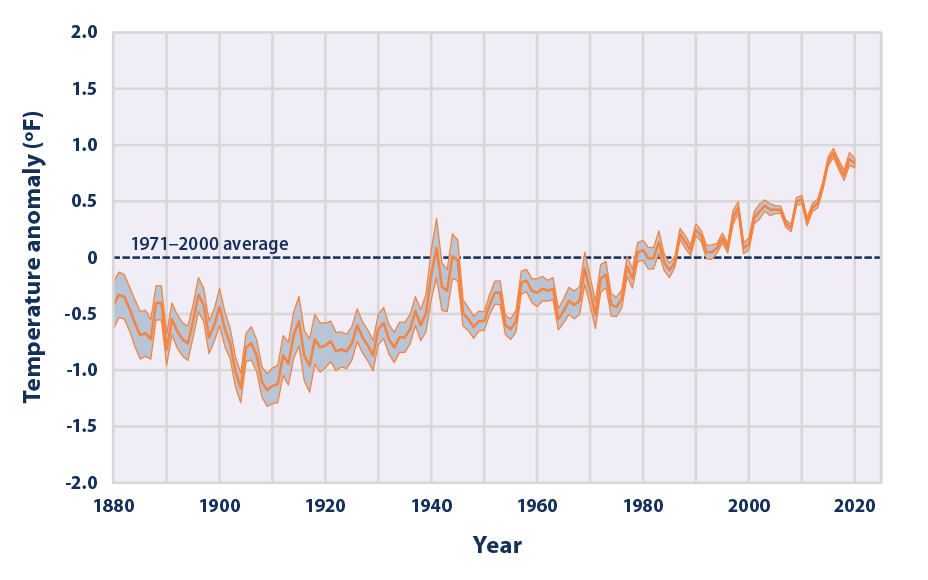
        One of the most significant factors that climate scientists point to when discussing the potential link between hurricanes and climate change is rising sea surface temperatures. According to the National Oceanic and Atmospheric Administration (NOAA), global ocean temperatures have increased by approximately 0.13°F (0.07°C) per decade since 1901. This trend is particularly pronounced in the tropical regions where hurricanes form.

        Dr. James Kossin, a climate scientist at NOAA’s National Centers for Environmental Information, explains, “Warmer ocean temperatures provide more energy for hurricanes to form and intensify. As the climate continues to warm, we expect to see more instances of rapidly intensifying hurricanes, which can be particularly dangerous because they give coastal communities less time to prepare.”

        Increased Water Vapor in the Atmosphere:


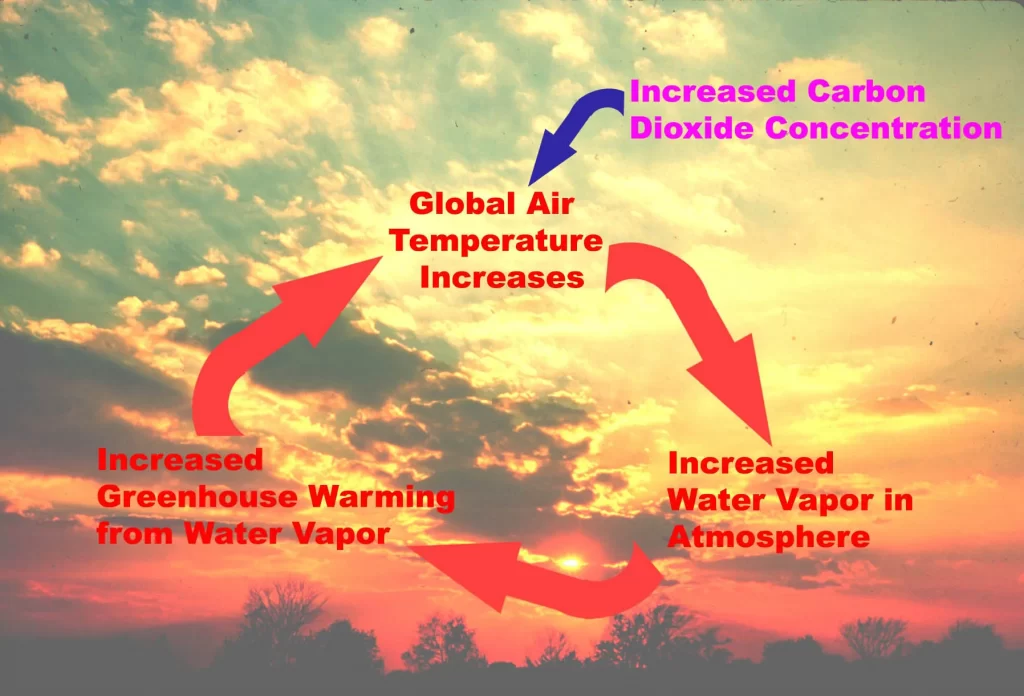
        Another factor that may contribute to the intensification of hurricanes is the increased water vapor in the atmosphere due to global warming. As the Earth’s surface temperatures rise, more water evaporates from the oceans and land, leading to higher humidity levels.

        Dr. Kerry Emanuel, a professor of atmospheric science at the Massachusetts Institute of Technology, notes, “The amount of water vapor in the atmosphere has increased by about 7% since the 1970s, which is consistent with the expected effect of global warming. This extra moisture can fuel more intense hurricanes, as well as lead to heavier rainfall during these events.”

        The Debate on Hurricane Frequency:
        While there is growing evidence to suggest that climate change may lead to more intense hurricanes, the question of whether global warming is causing an increase in the frequency of these storms is still a topic of debate among climate scientists.

        A 2015 study published in the journal Nature Climate Change found that the frequency of global hurricane activity has remained relatively stable since the 1970s. However, the study also noted that the proportion of Category 4 and 5 hurricanes—the most intense storms on the Saffir-Simpson scale—has increased significantly during this period.

        Dr. Tom Knutson, a research meteorologist at NOAA’s Geophysical Fluid Dynamics Laboratory, cautions, “While we have not seen a clear trend in the overall frequency of hurricanes, it’s important to recognize that even a small increase in the proportion of the most intense storms can have devastating consequences for coastal communities.”

        Recent Hurricane Seasons:
        The 2020 Atlantic hurricane season was one of the most active on record, with 30 named storms, 13 of which reached hurricane strength. This season also saw a record-breaking 12 landfalling storms in the United States, causing billions of dollars in damage and claiming dozens of lives.

        While it’s difficult to attribute any single hurricane season to climate change, Dr. Kossin points out, “The 2020 season exhibited many of the characteristics we expect to see more of in a warming world, such as rapidly intensifying storms and increased rainfall rates. It’s a reminder that we need to be prepared for more extreme hurricane seasons in the future.”

        The Need for Further Research:
        Despite the growing body of evidence suggesting a link between climate change and hurricane intensity, climate scientists stress the need for continued research to better understand this complex relationship.

        Dr. Emanuel emphasizes, “While we have made significant progress in understanding how global warming may affect hurricanes, there are still many uncertainties. We need to invest in more advanced modeling techniques and observational tools to improve our ability to predict and prepare for these storms.”

        Recent hurricanes:

        1. 2023: 8 hurricanes, highest category – Category 5 (Hurricane Lee)
        2. 2022: 8 hurricanes, highest category – Category 4 (Hurricane Ian)
        3. 2021: 7 hurricanes, highest category – Category 4 (Hurricane Ida)
        4. 2020: 14 hurricanes, highest category – Category 4 (Hurricane Iota)
        5. 2019: 3 hurricanes, highest category – Category 5 (Hurricane Dorian)
        6. 2018: 8 hurricanes, highest category – Category 5 (Hurricane Michael)
        7. 2017: 10 hurricanes, highest category – Category 5 (Hurricane Irma and Hurricane Maria)
        8. 2016: 7 hurricanes, highest category – Category 5 (Hurricane Matthew)
        9. 2015: 4 hurricanes, highest category – Category 4 (Hurricane Joaquin)
        10. 2014: 6 hurricanes, highest category – Category 4 (Hurricane Gonzalo)
        11. 2013: 2 hurricanes, highest category – Category 1 (Hurricane Humberto and Hurricane Ingrid)

        For comparison here’s the 1980s:

        1. 1989: 7 hurricanes, highest category – Category 4 (Hurricane Hugo)
        2. 1988: 5 hurricanes, highest category – Category 3 (Hurricane Gilbert)
        3. 1987: 3 hurricanes, highest category – Category 3 (Hurricane Emily)
        4. 1986: 4 hurricanes, highest category – Category 3 (Hurricane Bonnie)
        5. 1985: 7 hurricanes, highest category – Category 3 (Hurricane Gloria)
        6. 1984: 5 hurricanes, highest category – Category 4 (Hurricane Diana)
        7. 1983: 4 hurricanes, highest category – Category 3 (Hurricane Alicia)
        8. 1982: 2 hurricanes, highest category – Category 1 (Hurricane Alberto and Hurricane Debby)
        9. 1981: 7 hurricanes, highest category – Category 3 (Hurricane Harvey)
        10. 1980: 9 hurricanes, highest category – Category 4 (Hurricane Allen)