Unraveling the Mystery: Why Severe Storms Have Green, Teal, and Blue Colors

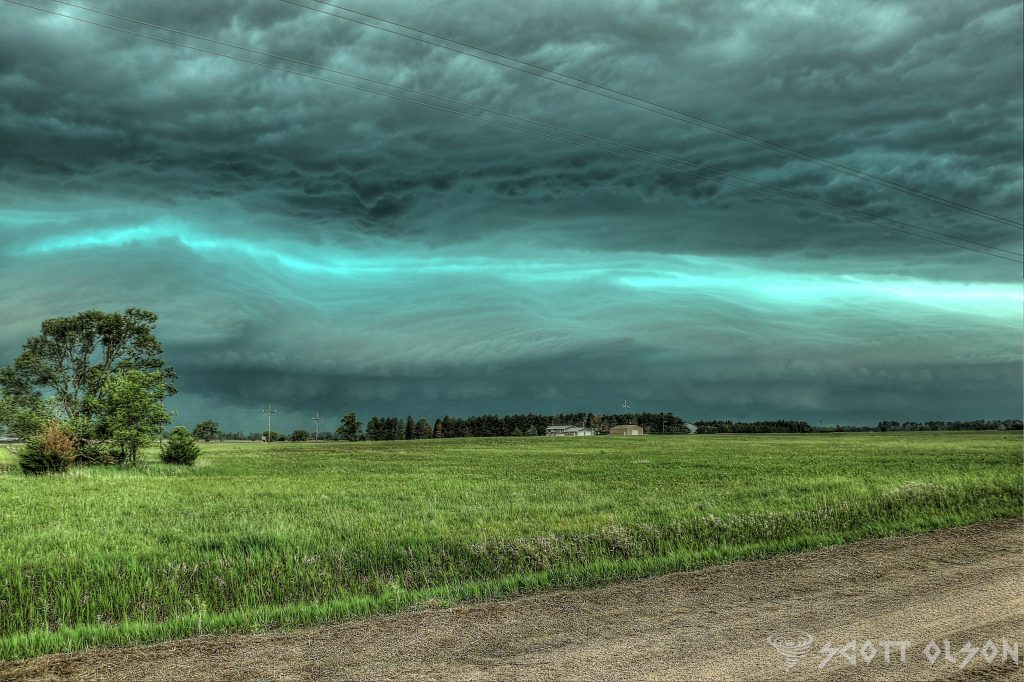
Supercell thunderstorms are among the most awe-inspiring and powerful weather phenomena on Earth. These storms are characterized by their rotating updrafts, known as mesocyclones, which can produce severe weather conditions such as large hail, damaging winds, and even tornadoes. One of the most striking features of supercells is the occasional appearance of a green or teal color in the sky, particularly near the storm’s base. This unique coloration has fascinated both weather enthusiasts and scientists alike, prompting numerous studies to unravel the mystery behind this phenomenon.
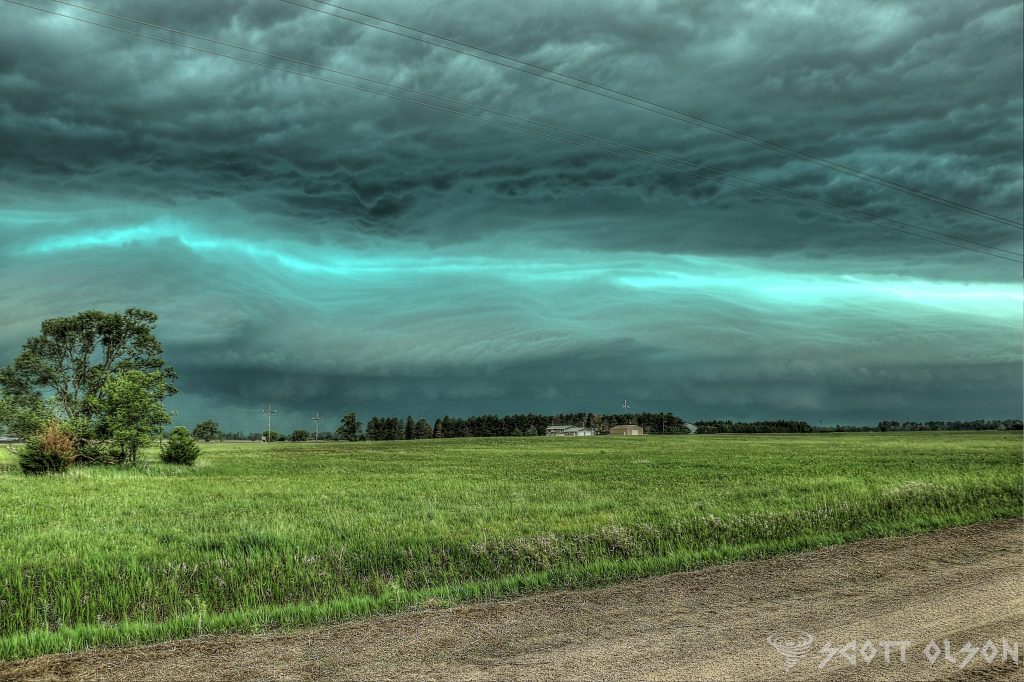
The presence of these large water droplets is crucial to the formation of the green or teal color. Water droplets are particularly effective at absorbing red light, which is at the longer wavelength end of the visible spectrum. As sunlight enters the storm and interacts with these water droplets, a significant portion of the red light is absorbed, leaving the remaining light dominated by shorter wavelengths, which correspond to blue and green colors.

However, the absorption of red light by water droplets alone is not sufficient to explain the intense green or teal hue sometimes observed. Another critical factor is the presence of ice crystals in the upper portions of the storm, particularly in the updraft and the rear flank downdraft (RFD). The RFD is another area of descending air, located on the back side of the storm, often associated with strong winds and large hail.

Ice crystals in the upper portions of the storm can scatter the remaining blue light, further enhancing the green appearance. The combination of red light absorption by water droplets in the lower levels and blue light scattering by ice crystals in the upper levels creates the distinctive green or teal color.

The green coloration is most likely to be observed when the sun is at a low angle on the horizon, typically during the late afternoon or early evening. During this time, sunlight has to travel through more of the Earth’s atmosphere, which can further filter out red light and enhance the green appearance. Additionally, the presence of large amounts of hail in the storm can intensify the green color, as hail can also absorb and scatter light in a manner similar to water droplets and ice crystals. Most storm chasers have experienced the largest hail when storms take on green and teal colors.

It is important to note that not all supercells exhibit a green or teal color, and the absence of this coloration does not necessarily indicate a less severe storm. The appearance of the green hue depends on a delicate balance of factors, including the storm’s structure, the concentration and size of hydrometeors, and the angle of the sun.

While the green or teal color in supercells is a fascinating phenomenon, it is important to remember that it is often associated with the most severe and dangerous storms. Supercells that exhibit this coloration are likely to be producing large hail, damaging winds, and possibly even tornadoes. If you find yourself in the vicinity of a supercell with a green or teal hue, it is crucial to seek shelter immediately and follow the advice of local weather authorities.

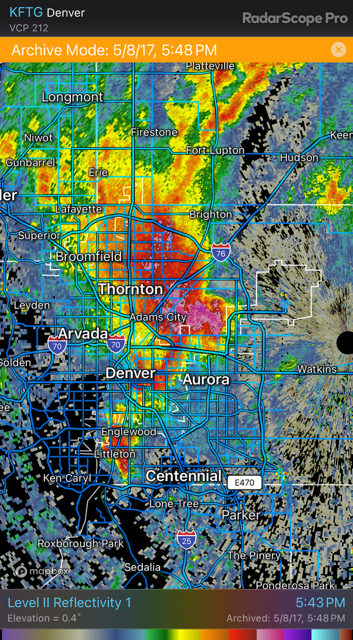
May 8, 2017 Insane Denver Hailstorm

On May 8, 2017, a severe hailstorm struck the Denver metropolitan area, causing widespread damage and disrupting daily life for thousands of residents. The storm, which lasted for several hours, produced hailstones ranging in size from small pellets to golf ball-sized chunks of ice, leaving a trail of destruction in its wake. This article will provide a comprehensive overview of the event, including the storm’s timeline, the meteorological conditions that led to its formation, and the extent of the damage it caused.

The hailstorm began to develop in the early afternoon hours of May 8, as a potent upper-level disturbance moved across the Rocky Mountains and into the Denver area. This disturbance, combined with strong daytime heating and abundant low-level moisture, created an unstable atmosphere that was primed for severe thunderstorm development. By 2:30 PM MDT, the first severe thunderstorm warnings were issued for the Denver metro area, as radar indicated the presence of large hail and strong winds within the developing storms.

As the afternoon progressed, the thunderstorms continued to intensify and expand in coverage. By 3:00 PM MDT, large hail was being reported across much of the Denver area, with some locations experiencing hailstones up to 2.5 inches in diameter. The largest hail was reported in the western and southern suburbs of Denver, including Lakewood, Littleton, and Highlands Ranch. In these areas, the hail was large enough to cause significant damage to vehicles, roofs, and landscaping.

The hailstorm reached its peak intensity between 3:30 PM and 4:30 PM MDT, as multiple severe thunderstorms merged into a large, slow-moving complex over the Denver metro area. During this time, the National Weather Service issued a rare “Flash Flood Emergency” for the city of Denver and its surrounding suburbs, as the combination of heavy rain and melting hail created dangerous flooding conditions on many roads and highways. The flooding was particularly severe in the southern and eastern portions of the metro area, where some locations received up to 3 inches of rain in less than an hour.

As the storm system slowly moved off to the east, the hail and heavy rain began to subside, but not before leaving a significant amount of damage in its wake. According to insurance industry estimates, the May 8 hailstorm caused more than $2.3 billion in damage, making it the costliest hailstorm in Colorado history. The majority of the damage was to vehicles, with more than 150,000 auto insurance claims filed in the wake of the storm. Many homes and businesses also suffered damage to roofs, siding, and windows, with some buildings experiencing complete roof failures due to the weight of the accumulated hail.

In the days following the storm, cleanup and repair efforts began in earnest across the Denver area. Insurance companies set up mobile claims centers to process the large volume of auto and property damage claims, while roofing and construction companies worked around the clock to repair damaged buildings. The City of Denver also launched a major cleanup effort to remove debris from streets and public spaces, with crews working 12-hour shifts to clear the affected areas.

From a meteorological perspective, the May 8 hailstorm was a classic example of a severe thunderstorm event in the High Plains region of the United States. The combination of strong upper-level winds, abundant low-level moisture, and intense daytime heating created an environment that was highly conducive to the development of large hail and damaging winds. The slow-moving nature of the storm system also allowed for a prolonged period of hail accumulation, which contributed to the extensive damage that occurred.

One of the unique aspects of the May 8 storm was the size and density of the hailstones that fell. According to the National Weather Service, the largest hailstone reported during the storm had a diameter of 2.75 inches, which is roughly the size of a baseball. However, many of the hailstones that fell were much smaller in size but incredibly dense, with some reports describing the hail as feeling like “small rocks” when they hit the ground. This high density of the hailstones likely contributed to the extensive damage that occurred to vehicles and roofs, as the impact of the hail was more severe than what would typically be expected from hailstones of a similar size.

Hail No: App Review

Hail No is an app designed for anyone who needs to know of an approaching hail storm, this could be a car dealership, people who are traveling, motorcyclists, meteorologists, storm chasers. When you first download the app you select your location and the hail size and how long of a lead time you want a warning for. For instance, if you are concerned about damage to your vehicle, you could select 1.5″ hail as a threshold and 30 miles as your warning radius, which is plenty of time to move your truck.

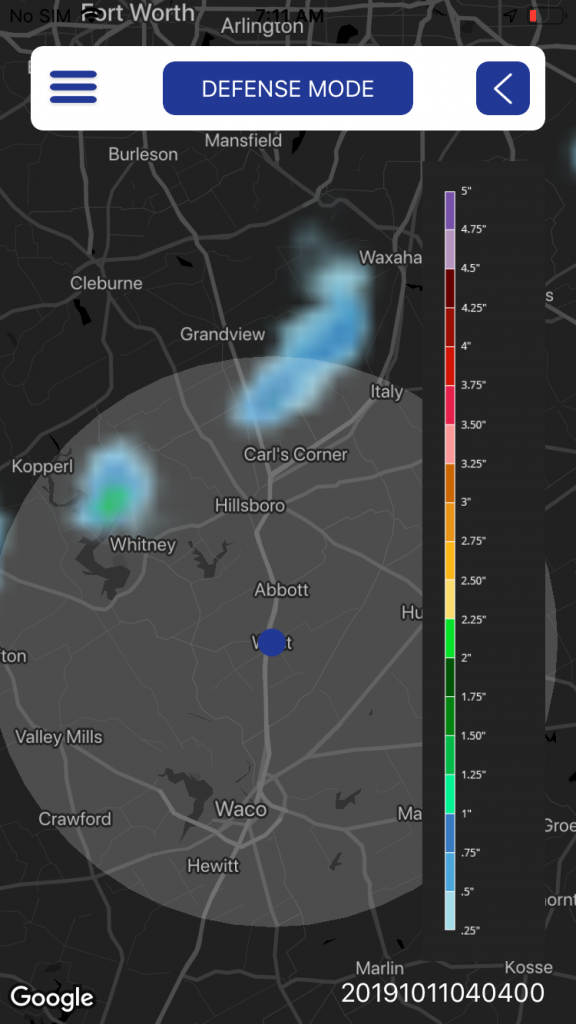
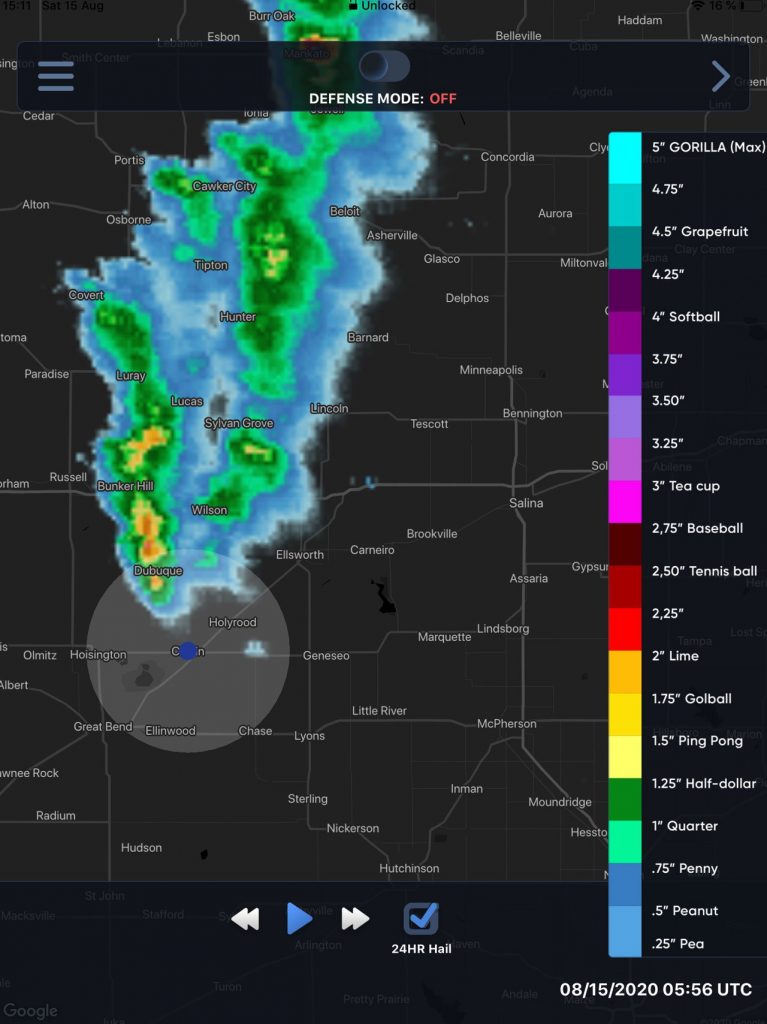
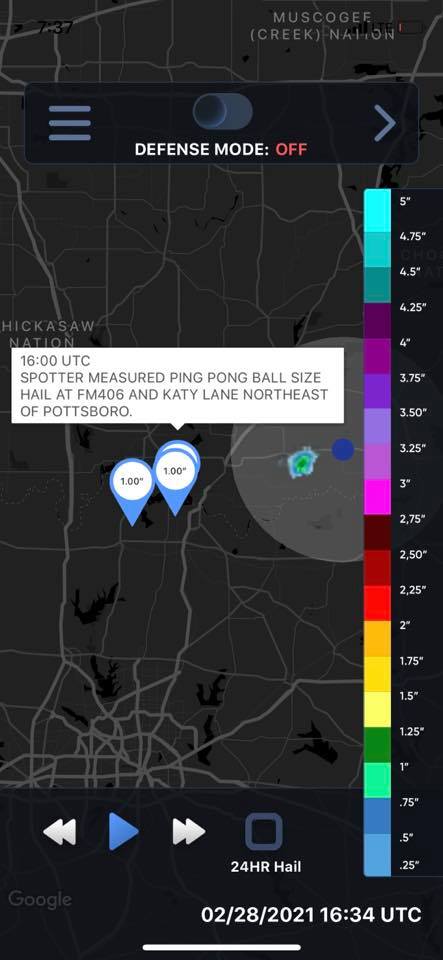
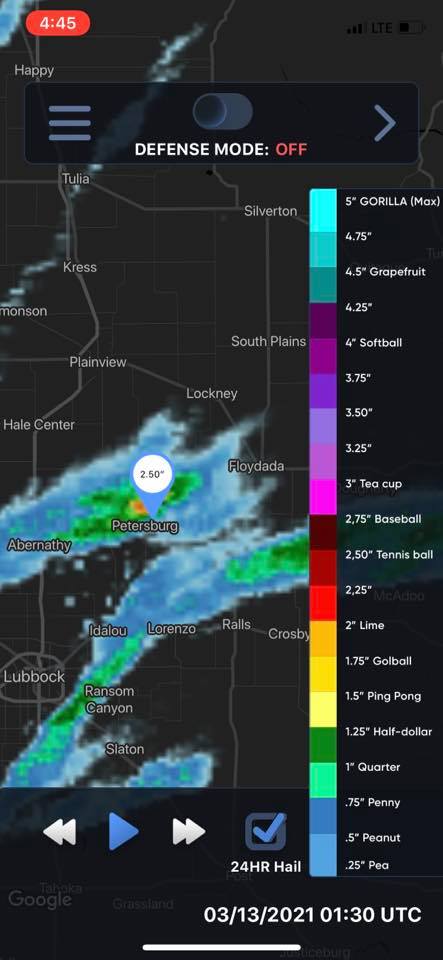
An alert will be sent as a push notification, so there is no need to have the app opened. When you open the app you will see a map with your selected location, your radius and colors denoting the hail size and a legend. This hail map is produced with the latest NSSL algorithm for hail size estimation and updated ever 3-4 minutes.

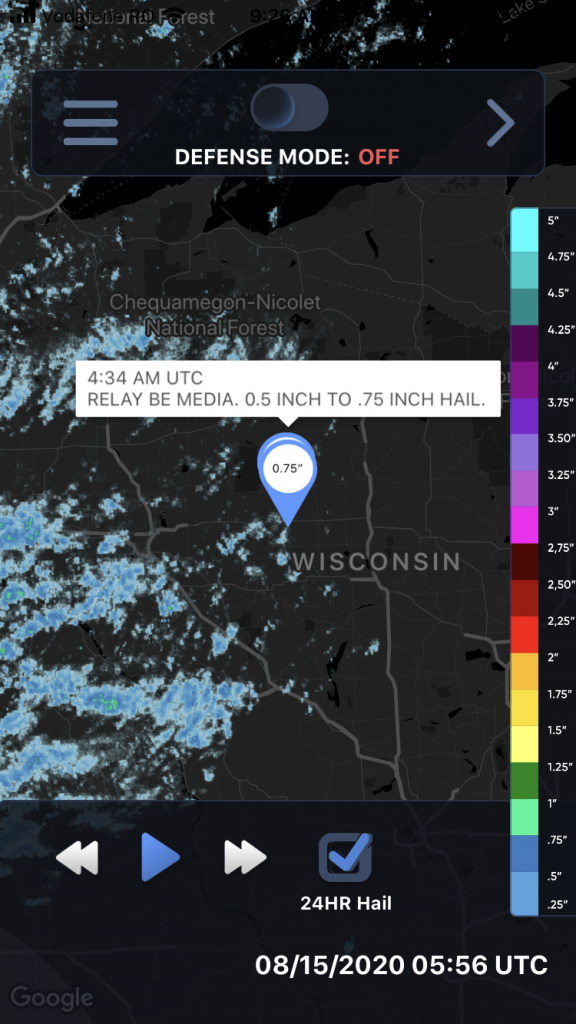
Real-time storm reports from multiple feeds will display on the map you can click on these for more information.

Hail No PRO subscribers have access to defense mode. Let’s say you are going on the move, traveling across country – just hit Defense Mode and Hail No will monitor your location for the next 24 hours. If you happen to be driving and a hail storm is detected you’ll get an immediate alert!

Another feature of Hail No is for people who want to see the hail tracks for the last 24 hours, just hit 24HR Hail and it will display the full map of the last 24 hours.

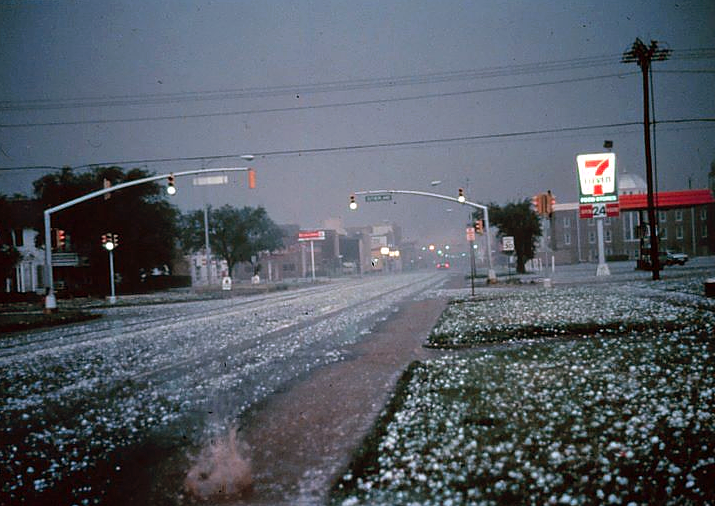
Here’s more images of Hail No in action:

The Destructive Dallas 2012 Hail Storm

On June 13, 2012, a single, isolated supercell thunderstorm pummeled the Dallas-Fort Worth (DFW) metroplex with golfball-sized hail, ranging from 1.75 inches (4.4 cm) to a staggering 4.25 inches (10.8 cm) in diameter – some exceeding the size of softballs. This event, classified as a PDS (Particularly Destructive Storm) by the National Weather Service (NWS), caused widespread devastation, with estimated costs reaching $900 million. This white paper delves into the meteorological setup, the extent of the damage, and the community’s response and recovery efforts.

2. Meteorological Conditions

An analysis by the NWS Fort Worth office revealed the following key factors:

  • High CAPE (Cape Accumulation of Potential Energy): The atmosphere held a significant amount of potential energy (CAPE) exceeding 3,000 J/kg, which fueled the storm’s intensity.
  • Strong Vertical Wind Shear: A strong change in wind speed and direction with increasing altitude created powerful updrafts within the storm, allowing hailstones to grow significantly.
  • Moist Mid-Levels: Abundant moisture present in the middle levels of the atmosphere provided ample water vapor for hailstone formation.

3. Extent of Damage

Data from various sources paints a grim picture:

  • Hailstone Size Distribution: According to insurance claim data, approximately 60% of the hail measured between 1.75-2.75 inches (4.4-7 cm), with 25% reaching 2.75-3.75 inches (7-9.5 cm), and the remaining 15% exceeding 3.75 inches (9.5 cm).
  • Property Damage: Over 150,000 residential and commercial property claims were filed, with an estimated 70,000 roofs punctured or destroyed.
  • Vehicle Damage: Insurance companies reported over 600,000 auto hail damage claims, with many vehicles deemed totaled.
  • Infrastructure Damage: Power outages affected over 200,000 residents, and numerous communication towers were damaged, disrupting phone and internet services.
  • Agricultural Damage: Over 50,000 acres of crops were destroyed, impacting local agriculture and raising food prices.

4. Economic Impact

The estimated economic cost of the storm was staggering:

  • $600 million: Property damage repairs and replacements.
  • $200 million: Vehicle repairs and replacements.
  • $50 million: Lost business revenue due to power outages and infrastructure disruptions.
  • $50 million: Infrastructure repair costs.
  • $100 million: Crop losses and agricultural impact.

These figures highlight the significant economic burden placed on individuals, businesses, and local governments.

5. Community Response and Recovery

The DFW community demonstrated remarkable resilience:

  • Emergency Response: Over 1,000 emergency responders worked tirelessly to ensure public safety, clear debris, and provide assistance to affected residents.
  • Volunteer Efforts: Thousands of volunteers emerged to help with cleanup efforts, organize donation drives, and provide emotional support.
  • Government Assistance: Local, state, and federal governments declared disaster zones, offering financial assistance to individuals and businesses for repairs.
  • Building Code Review: Building code revisions were initiated, focusing on strengthening roof structures and improving hail resistance for new construction.

Predict Now – The Ultimate Weather Forecasting App for Enthusiasts

As the creator of Predict Now, I wanted an app that fit the needs of meteorologists, storm chasers, and weather enthusiasts who are passionate about forecasting severe weather. Predict Now is the result of thousands of hours of research, development, and conversations with people who forecast weather.

One of the standout features of Predict Now is its detailed radar maps. I have ensured that the app provides a comprehensive view of radar activity across the entire United States, enabling users to easily track storms and precipitation. Whether you’re monitoring a local thunderstorm or following the path of a hurricane, Predict Now’s radar maps will keep you informed and ahead of the game with updates every 2 minutes.

In addition to radar, I have incorporated a powerful front tracking feature in Predict Now. This allows users to visualize the movement of warm fronts, cold fronts, and other weather systems, providing valuable insights into upcoming changes in the weather pattern. By staying informed about frontal movements, users can make more accurate predictions and better prepare for potential severe weather events.

I am particularly proud of the integration of the Storm Prediction Center’s mesoanalysis tool in Predict Now. This feature grants users access to a wealth of data and visualizations, offering insights into current weather conditions and severe weather potential. Users can explore various indices like CAPE, wind shear, and more, empowering them to make well-informed forecasts and assess the likelihood of severe weather outbreaks.

Predict Now also includes a comprehensive surface observations feature, displaying detailed METARs from numerous locations across different regions, including the infamous Tornado Alley. This allows users to access real-time weather updates and monitor conditions on the ground, which is crucial for storm chasers and those in areas prone to severe weather. There are thousands of surface observations available in Predict Now.

To provide users with the most advanced satellite imagery available, I have integrated data from the cutting-edge GOES-16 satellite into Predict Now. This offers high-resolution visuals of water vapor, infrared, and visible satellite data, giving users a comprehensive understanding of atmospheric conditions. The GOES-16 imagery is a game-changer for weather enthusiasts, enabling them to analyze and predict weather patterns with unprecedented accuracy.

Predict Now also leverages the power of the High-Resolution Rapid Refresh (HRRR) model, which is particularly useful for tracking rapidly changing weather events. The HRRR provides short-term, high-resolution forecasts, allowing users to stay on top of evolving weather situations. Additionally, the app includes other weather models like the NAM and NSSL WRF, offering users a variety of forecasting perspectives to enhance their understanding and prediction capabilities.

I have designed Predict Now with the specific goal of aiding individuals interested in monitoring and preparing for severe weather events like tornadoes, hailstorms, hurricanes and flash floods. The app’s high-resolution data, sourced from advanced models and satellite imagery, ensures accurate and detailed weather visualization. Moreover, Predict Now is optimized for iPhone, providing a smooth and efficient user experience while minimizing data usage.

With its wide coverage spanning the United States and Southern Canada, Predict Now caters to a large user base, making it the go-to app for weather enthusiasts across the region.

I am confident that Predict Now will revolutionize the way you track, analyze, and forecast severe weather. Whether you’re a seasoned meteorologist, a passionate storm chaser, or simply someone who wants to stay informed about the weather, Predict Now is the ultimate tool to elevate your forecasting skills.

Download Predict Now today and join the community of weather enthusiasts who rely on this powerful app to stay one step ahead of the storm. I am committed to continuously improving and updating Predict Now based on user feedback, ensuring that it remains the leading choice for severe weather forecasting.