Weather radar has always been a cornerstone of meteorological observation and forecasting. Yet, traditional radar systems, while effective, were limited in their ability to decipher the complexities within storms, often leaving meteorologists with an incomplete picture. The advent of dual polarization radar technology marked a paradigm shift, ushering in an era of enhanced precision and understanding in severe weather detection and warnings.
Understanding the Dual Pol Advantage:
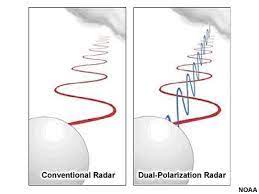
Traditional weather radars transmit and receive horizontally polarized waves, meaning the waves vibrate parallel to the ground. This provides information about the location and intensity of precipitation but lacks the ability to discern the size, shape, and variety of particles within a storm. Dual polarization technology builds upon this foundation by introducing a second dimension – vertical polarization. By transmitting and receiving both horizontally and vertically polarized waves, dual pol radar paints a more comprehensive picture of the storm environment.
Transforming Tornado Detection:
One of the most significant benefits of dual pol technology lies in its ability to enhance tornado detection and warnings. Traditional radar could identify areas of rotation within a storm, suggestive of a possible tornado. However, confirming the presence of a tornado often relied on visual sightings or the detection of debris lofted into the air, both of which could be unreliable or delayed.
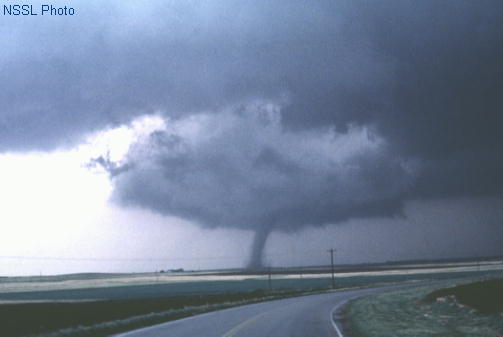
Dual pol radar brought a game-changing advantage: the ability to detect debris fields associated with tornadoes. When a tornado is on the ground, it lifts a variety of objects – from tree limbs and building materials to vehicles and even larger structures. These objects scatter radar waves differently than raindrops or hailstones, creating a distinct signature that dual pol radar can identify. This capability allows meteorologists to confirm the presence of a tornado with greater confidence and issue more timely and accurate warnings, potentially saving lives.
Sharper Images, Clearer Insights:
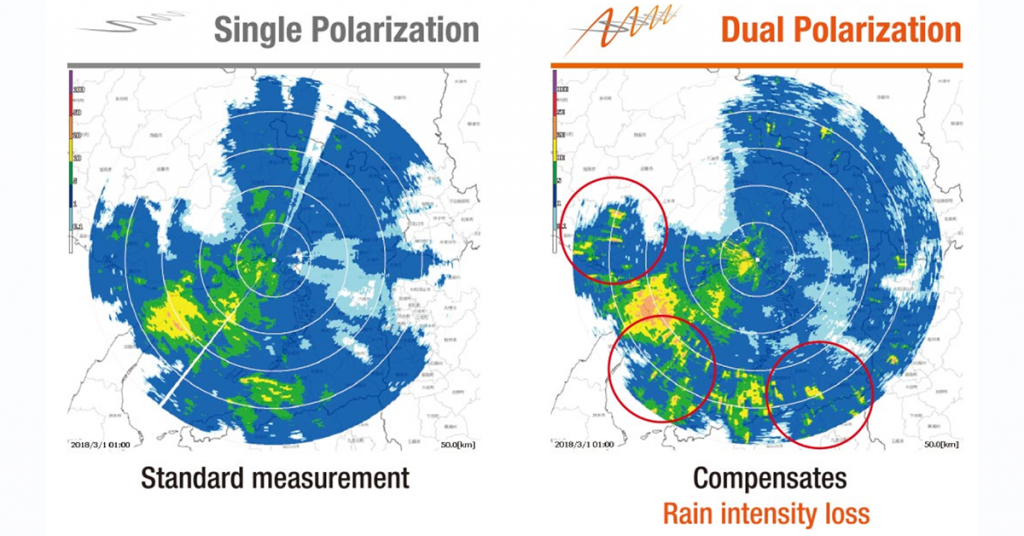
Beyond debris detection, dual pol technology enhances the overall resolution and clarity of radar data. By analyzing the way horizontally and vertically polarized waves interact with precipitation particles, meteorologists can estimate the size and shape of raindrops, hailstones, and snowflakes. This information provides valuable insights into the intensity of precipitation, the potential for flooding, and the type of winter weather expected.
A Nationwide Upgrade: The Dual Pol Rollout:
Recognizing the transformative potential of dual polarization technology, the National Weather Service (NWS) embarked on an ambitious endeavor to upgrade its entire network of radars across the United States. The rollout, initiated in 2010 and completed in 2013, involved retrofitting existing radars with dual pol capabilities, ensuring comprehensive coverage for the nation.
This nationwide upgrade has yielded substantial improvements in severe weather detection and warnings. Studies have shown a significant increase in lead times for tornado warnings and a reduction in false alarms, underscoring the life-saving potential of this technology.
Beyond Tornadoes: A Multifaceted Tool:
While the impact of dual pol radar on tornado warnings has been profound, its benefits extend far beyond this realm. The technology has proven invaluable for:
Improved Rainfall Estimates: By providing more accurate measurements of rainfall amounts, dual pol data enhances flash flood warnings and supports better water resource management.
Winter Weather Monitoring: The ability to differentiate between various types of frozen precipitation, such as snow, sleet, and freezing rain, leads to more precise winter storm forecasts and improved road condition monitoring.
Aviation Safety: Dual pol radar aids in identifying hazardous weather phenomena for aviation, including icing conditions and turbulence, contributing to safer air travel.
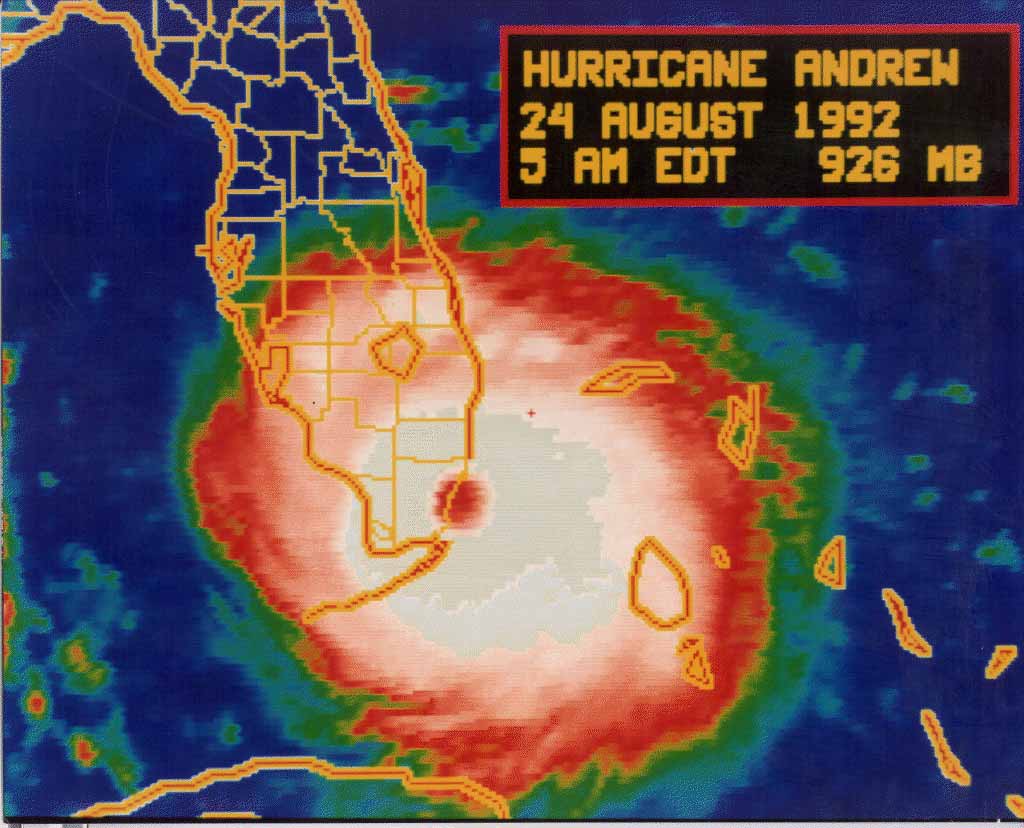
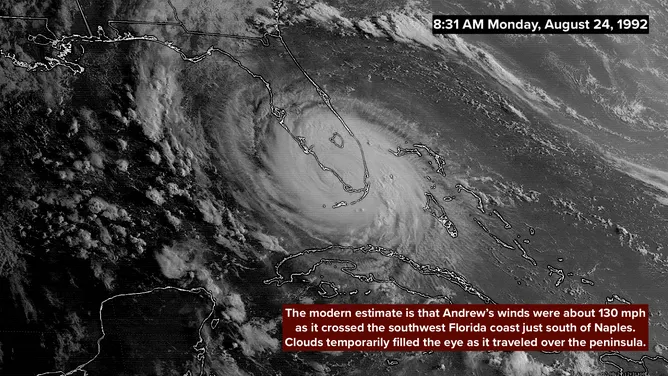
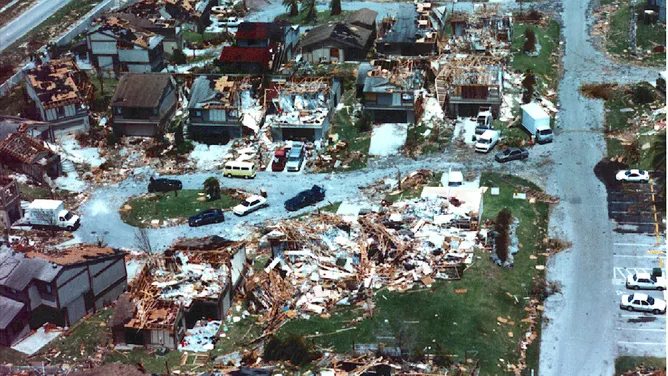
The morning of August 24, 1992, dawned bright and clear in South Florida, but the calm was a cruel deception. Lurking in the Atlantic, Hurricane Andrew, a Category 5 monster, was on a collision course. By the time the sun set, Andrew would etch its name in history as one of the most destructive hurricanes to ever strike the United States, leaving behind a trail of devastation that would take years to rebuild.
Andrew’s journey of destruction began in the eastern Atlantic as a tropical wave, gradually gaining strength as it moved westward. By August 22nd, it had intensified into a Category 5 hurricane with sustained winds of 175 mph. After pummeling the northern Bahamas, Andrew set its sights on South Florida. Despite weakening slightly to a Category 4, Andrew remained a formidable force, boasting winds of 145 mph as it approached the coast.
Around 5 AM on August 24th, the hurricane’s eyewall slammed into Elliott Key, just south of Miami. The anemometer at the National Hurricane Center in Coral Gables clocked a peak gust of 177 mph before being destroyed by the wind. Homes were ripped apart, boats tossed ashore like toys, and palm trees stripped bare. The storm surge, a wall of water pushed ashore by the hurricane, inundated coastal areas, flooding streets and homes.
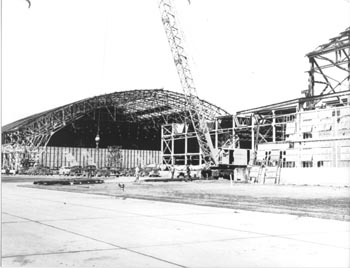
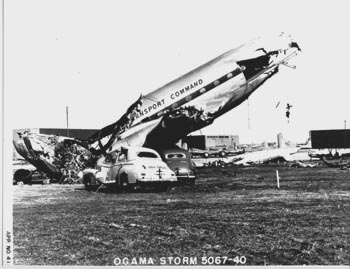
The devastation wasn’t confined to the immediate coastline. As Andrew moved inland, its powerful winds tore through Homestead, Florida City, and Kendall, leaving behind scenes reminiscent of a war zone. Homestead Air Force Base, located near the eye of the storm, was virtually destroyed, with aircraft hangars crumpled and fighter jets tossed about like paper airplanes. Mobile home parks were obliterated, shopping centers reduced to rubble, and thousands of homes left uninhabitable. The darkness of the early morning, combined with the howling winds and driving rain, created an atmosphere of pure terror for those trapped in the storm’s path.
Andrew’s destructive power was fueled by a combination of factors. The warm waters of the Atlantic provided ample energy for the storm to intensify. Additionally, a lack of wind shear, which can disrupt a hurricane’s organization, allowed Andrew to maintain its strength. The storm’s compact size, while limiting the geographic scope of its impact, concentrated its destructive winds over a smaller area, resulting in catastrophic damage. The pressure readings recorded in Homestead were some of the lowest ever observed in a hurricane striking the U.S. mainland, indicating the storm’s incredible intensity.
The aftermath of Hurricane Andrew revealed a landscape of unimaginable destruction. Over 125,000 homes were damaged or destroyed, leaving thousands homeless. Millions were left without power, and the economic losses reached an estimated $26 billion, making it the costliest natural disaster in U.S. history at the time. The storm exposed flaws in building codes and emergency preparedness, prompting significant changes in both areas.
The human cost of the disaster was equally staggering. In Florida alone, 44 deaths were directly attributed to the hurricane, with another 15 indirectly caused by the storm. Thousands more were injured, and the psychological scars left by the trauma of the event were deep and long-lasting.
While the physical scars of Hurricane Andrew have faded with time, the memories of its devastating impact remain vivid for those who lived through it. The storm serves as a stark reminder of the destructive power of nature and the importance of respecting and preparing for its fury. The lessons learned from Andrew have led to improved building codes, better emergency response systems, and a heightened awareness of hurricane preparedness, ultimately saving countless lives in subsequent storms.
Adjusted for inflation, the estimated $26 billion in damages translates to a staggering $55.6 billion in today’s dollars, underscoring the immense financial impact of the storm. This figure encompasses a wide range of losses, including:
Residential and Commercial Property Damage: Andrew obliterated thousands of homes and businesses, leaving behind a landscape of rubble. Rebuilding costs, coupled with lost economic activity, contributed significantly to the overall financial toll.
Infrastructure Damage: The storm inflicted severe damage on critical infrastructure, including power grids, communication systems, and transportation networks. Repairing and restoring these essential services added to the overall cost.
Agricultural Losses: The agricultural sector, particularly in South Florida, suffered extensive losses due to crop damage and destruction of farming infrastructure.
Insurance Payouts: Insurance companies faced massive payouts to cover property damage claims, leading to increased premiums and financial strain within the industry.
Timeline of Hurricane Andrew:
August 14, 1992: A tropical wave emerges off the coast of Africa, marking the genesis of what would become Hurricane Andrew.
August 16-22, 1992: The tropical wave strengthens as it tracks westward across the Atlantic, eventually becoming a tropical storm and then rapidly intensifying into a Category 5 hurricane by August 22nd.
August 23, 1992: Andrew makes landfall in the northern Bahamas as a Category 4 hurricane, causing significant damage.
August 24, 1992 (Early Morning): Hurricane Andrew makes landfall near Elliott Key, Florida, as a Category 5 hurricane with sustained winds of 165 mph, causing catastrophic damage in South Florida, including Homestead, Florida City, and Kendall.
August 24-26, 1992: Andrew weakens as it crosses the Gulf of Mexico but regains strength before making a second landfall as a Category 3 hurricane in Louisiana, causing further damage.
August 26-28, 1992: Andrew weakens into a tropical depression as it moves inland and dissipates over the eastern United States.
In today’s world, being prepared for changing weather conditions is crucial. Fortunately, there are numerous weather apps available that can help you stay informed and safe. Here are 20 game-changing weather apps you can’t afford to miss:
Dark Sky This app is known for its accurate hyperlocal forecasts and beautiful radar maps. It provides down-to-the-minute updates and alerts for precipitation, temperature, and severe weather events, making it a reliable choice for staying on top of changing weather conditions.
Hail No Defend yourself from hailstorms with Hail No, the first hail app to provide real-time tracking and alert notifications. See where the hail is, create a defensive radius around any location, and get automatic alerts. Hail No provides access to the National Severe Storms Laboratory hail algorithm, the most accurate available, ensuring you’re always aware of potential hail threats. Apple: https://apps.apple.com/us/app/hail-no/id1469253867
WeatherBug WeatherBug is a comprehensive weather app that offers real-time weather data, radar maps, and severe weather alerts. It also includes features like pollen and air quality forecasts, making it a great choice for those with allergies or respiratory issues. Stay informed about changing weather conditions and potential health impacts with WeatherBug.
Tornado Vision See severe weather with augmented reality! Tornado Vision can help you see tornadoes hiding in the rain or at night. Simply point your phone at any severe storm, and you’ll get a heads-up display on what is happening inside the storm. This groundbreaking weather technology provides information on the chance of a tornado, hail size, wind speed, and more, right on your screen. iOS: https://apps.apple.com/us/app/tornado-vision/id1469550036 Android: https://play.google.com/store/apps/details?id=com.tornadovision.app.presentation&hl=en&gl=US&pli=1
RadarScope Designed for weather enthusiasts and professionals, RadarScope is a powerful radar app that provides high-resolution radar data, storm tracking, and advanced analysis tools. Dive deep into weather data and gain a comprehensive understanding of weather patterns with this feature-rich app.
Predict Now Predict Now is a powerful weather app that provides hyperlocal forecasts and real-time alerts for severe weather events. With its user-friendly interface and advanced features, you can stay ahead of the game and plan your activities accordingly, ensuring you’re always prepared for changing weather conditions. Apple: https://apps.apple.com/us/app/predict-now/id1481839520
NOAA Weather Radar Live This free app provides access to real-time weather radar data from the National Oceanic and Atmospheric Administration (NOAA). Stay informed about severe weather events in your area with up-to-date radar information from a trusted source.
Weather Underground Weather Underground is a comprehensive weather app that offers hyperlocal forecasts, radar maps, and severe weather alerts. It also includes a community feature that allows users to share weather observations and photos, creating a collaborative weather-tracking experience.
AccuWeather AccuWeather is a popular weather app known for its accurate forecasts and user-friendly interface. It provides detailed weather information, including hourly and daily forecasts, radar maps, and severe weather alerts, ensuring you have all the information you need to plan your day.
The Weather Channel The Weather Channel app is a reliable source for weather information, offering forecasts, radar maps, and severe weather alerts. It also includes features like hurricane tracking and ski resort conditions, making it a versatile choice for various weather-related activities.
Clime: NOAA Weather Radar Clime: NOAA Weather Radar is a free app that provides access to real-time weather radar data from NOAA. Stay informed about severe weather events in your area with this simple yet effective app.
MyRadar Weather Radar MyRadar Weather Radar is a powerful app that offers high-resolution radar data, severe weather alerts, and customizable settings. Tailor the app to your specific needs and get a detailed view of weather conditions in your area.
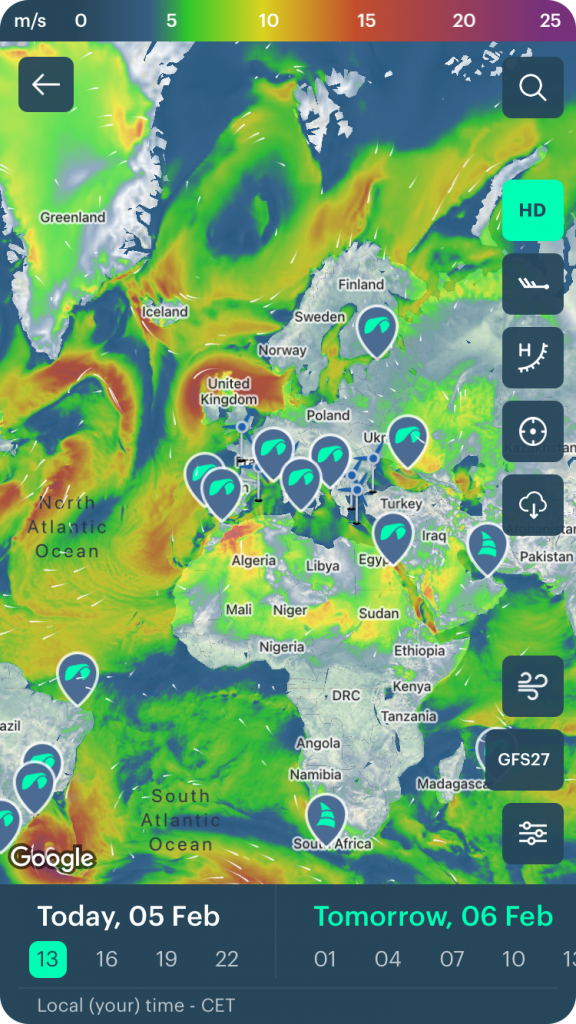
Windy Windy is a unique weather app that focuses on wind forecasts and patterns. It provides detailed wind maps, as well as forecasts for temperature, precipitation, and other weather conditions, making it an excellent choice for outdoor enthusiasts and those interested in wind-related activities.
Weather Mate Weather Mate is a comprehensive weather app that offers hyperlocal forecasts, radar maps, and severe weather alerts. It also includes features like air quality and pollen forecasts, making it a great choice for those with allergies or respiratory issues. Stay informed about weather conditions and potential health impacts with this all-in-one app.
Carrot Weather Carrot Weather is a unique weather app that combines accurate forecasts with a quirky and humorous personality. It provides detailed weather information, including hourly and daily forecasts, radar maps, and severe weather alerts, all delivered with a touch of humor to make weather tracking more enjoyable.
Storm Radar Storm Radar is a powerful app that provides real-time radar data, severe weather alerts, and storm tracking capabilities. Stay informed about severe weather events in your area and track storms with this comprehensive app.
Weather Live Weather Live is a comprehensive weather app that offers hyperlocal forecasts, radar maps, and severe weather alerts. It also includes features like air quality and pollen forecasts, making it a great choice for those with allergies or respiratory issues. Stay informed about weather conditions and potential health impacts with this versatile app.
Flowx Flowx is a unique weather app that focuses on visualizing weather patterns and forecasts. It provides detailed weather information, including wind patterns, precipitation, and temperature, in a visually stunning format, making it an excellent choice for those who appreciate beautiful data visualization.
Weather Maps Weather Maps is a powerful app that provides detailed weather maps and forecasts for various weather conditions, including precipitation, temperature, wind, and more. Get a comprehensive view of weather patterns with this data-rich app.
Weather Radar by ICM Weather Radar by ICM is a free app that provides access to real-time weather radar data from various sources, including NOAA and Environment Canada. Stay informed about severe weather events in your area with this simple yet effective app.
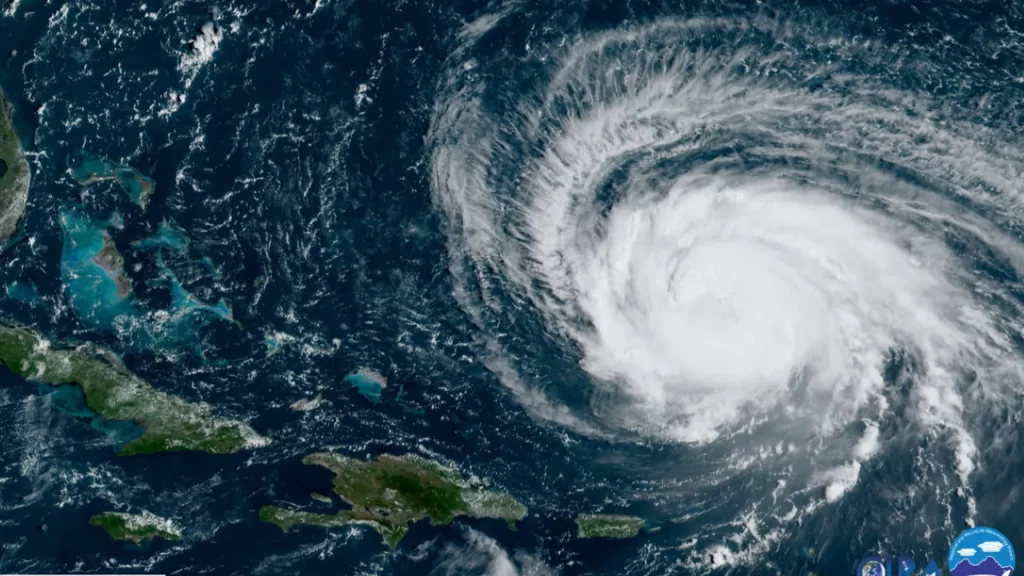
1.1 What is a hurricane? A hurricane is a type of tropical cyclone, which is a rotating, organized system of clouds and thunderstorms that originates over tropical or subtropical waters. Hurricanes are characterized by a low-pressure center, high winds, and heavy rainfall. In the North Atlantic Ocean, Caribbean Sea, and the eastern North Pacific Ocean, these storms are called hurricanes. In other parts of the world, they may be referred to as typhoons or tropical cyclones, depending on their location.
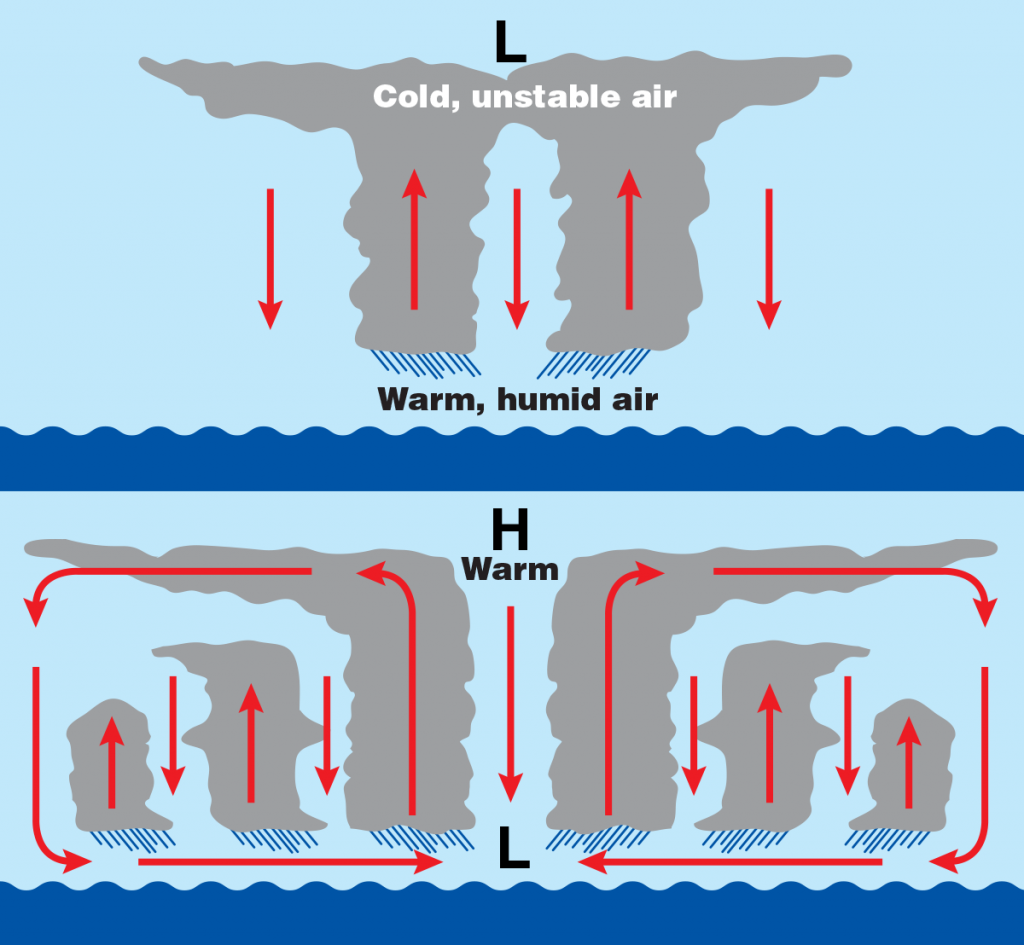
1.2 How do hurricanes form? Hurricanes form when specific atmospheric and oceanic conditions are met. The key factors that contribute to hurricane formation include: a. Warm ocean water (at least 26.5°C or 79.7°F) to a depth of about 50 meters b. Atmospheric instability, which allows the warm, moist air to rise and form thunderstorms c. Sufficient Coriolis force, which causes the storm to rotate (this force is minimal near the equator) d. A pre-existing disturbance, such as a tropical wave or a low-pressure system e. Low wind shear, which allows the storm to maintain its vertical structure
When these conditions are present, the warm, moist air rises, creating an area of low pressure near the surface. As the air continues to rise, it cools and condenses, forming clouds and thunderstorms. The rotation of the Earth and the Coriolis force cause the storm to spin, and as the system becomes more organized, it can intensify into a tropical depression, tropical storm, or hurricane.
1.3 The life cycle of a hurricane Hurricanes typically go through four stages of development: a. Tropical disturbance: An area of low pressure with thunderstorms, but no organized circulation b. Tropical depression: A low-pressure system with sustained winds of up to 38 mph (61 km/h) c. Tropical storm: A more organized system with sustained winds between 39 and 73 mph (63 to 118 km/h) d. Hurricane: A well-defined, rotating storm with sustained winds of 74 mph (119 km/h) or higher
Once a hurricane makes landfall or moves over cooler waters, it begins to weaken and eventually dissipates.
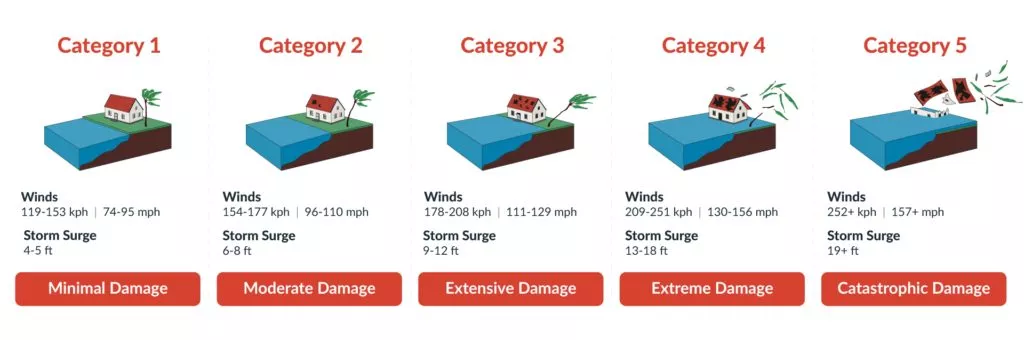
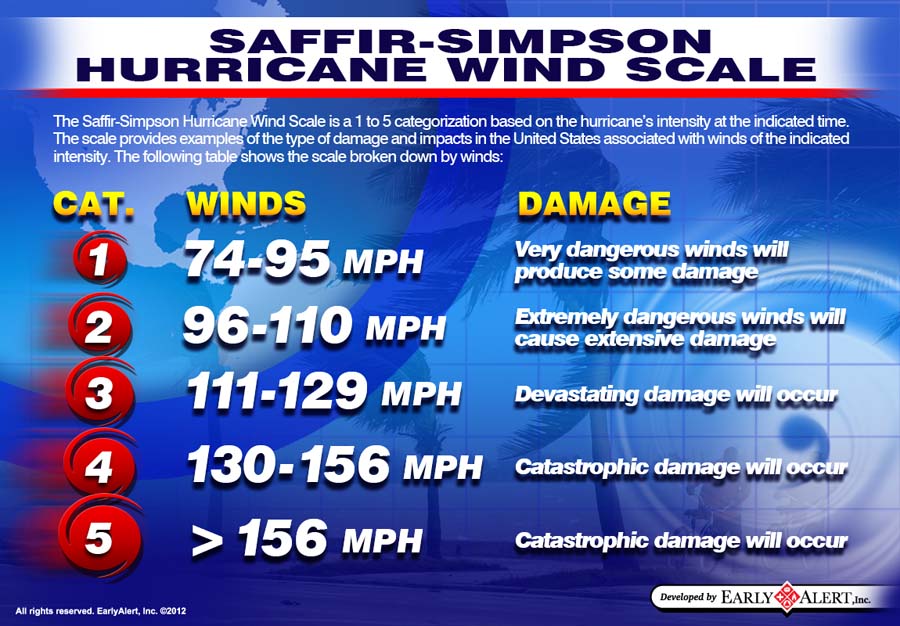
1.4 Categories of hurricane intensity Hurricanes are classified into five categories based on their maximum sustained wind speeds, using the Saffir-Simpson Hurricane Wind Scale:
Category 1: 74-95 mph (119-153 km/h)
Category 2: 96-110 mph (154-177 km/h)
Category 3: 111-129 mph (178-208 km/h)
Category 4: 130-156 mph (209-251 km/h)
Category 5: 157 mph (252 km/h) or higher
It is important to note that the Saffir-Simpson scale only measures wind speed and does not account for the potential damage caused by storm surge, rainfall, or other factors. Lower-category hurricanes can still cause significant damage and loss of life, particularly due to flooding and storm surge.
Part 2: Data Collection and Analysis
2.1 Observing and measuring hurricanes To accurately forecast hurricanes, scientists rely on various data collection methods to observe and measure the storms’ characteristics and the surrounding environment. The main tools used for this purpose are:
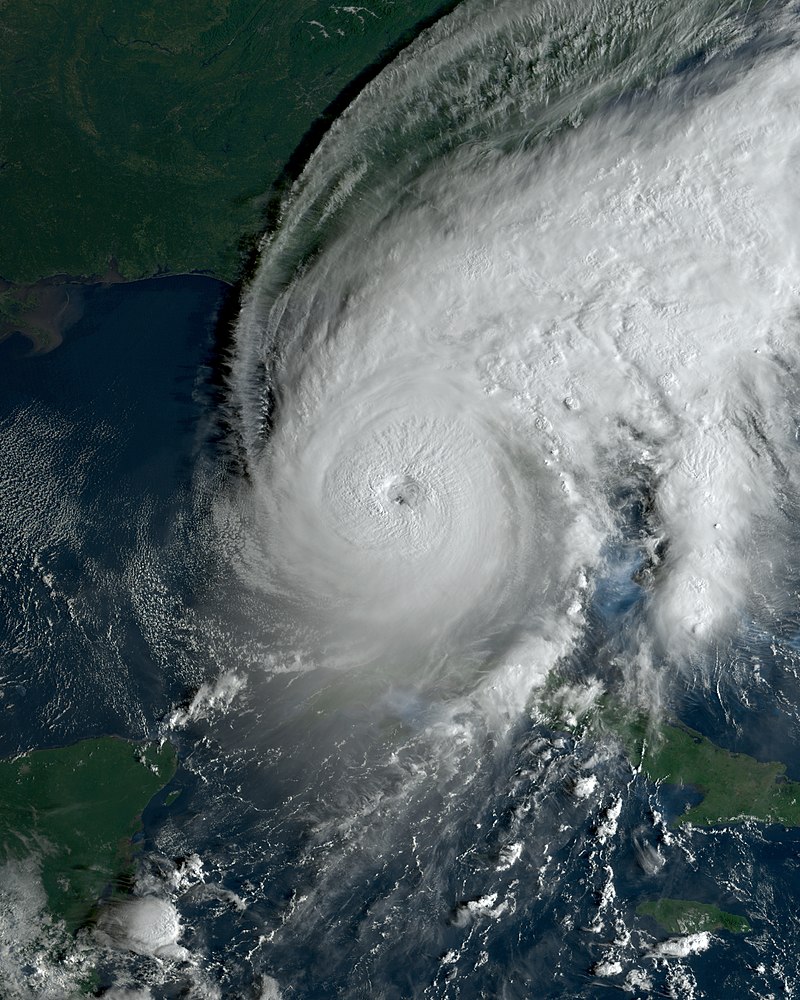
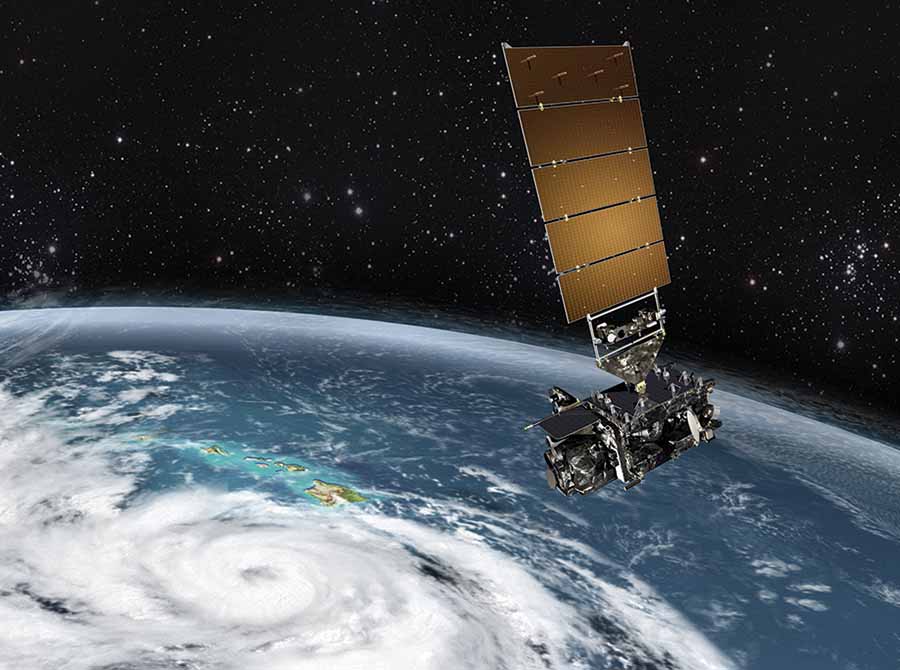
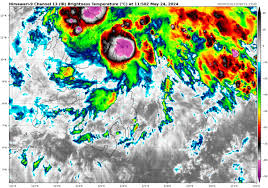
2.1.1 Satellite imagery Satellites provide a comprehensive view of hurricanes from space, allowing forecasters to monitor their development, track their movement, and estimate their intensity. Visible and infrared satellite images help identify the storm’s structure, size, and cloud patterns. Microwave imagery can penetrate through clouds, providing information about the storm’s internal structure and rainfall rates.
2.1.2 Aircraft reconnaissance Specially equipped aircraft, such as the U.S. Air Force Reserve’s Hurricane Hunters, fly directly into hurricanes to collect valuable data. These aircraft measure wind speed, air pressure, temperature, and humidity at various altitudes within and around the storm. They also deploy instruments called dropsondes, which measure atmospheric conditions as they descend to the ocean surface.
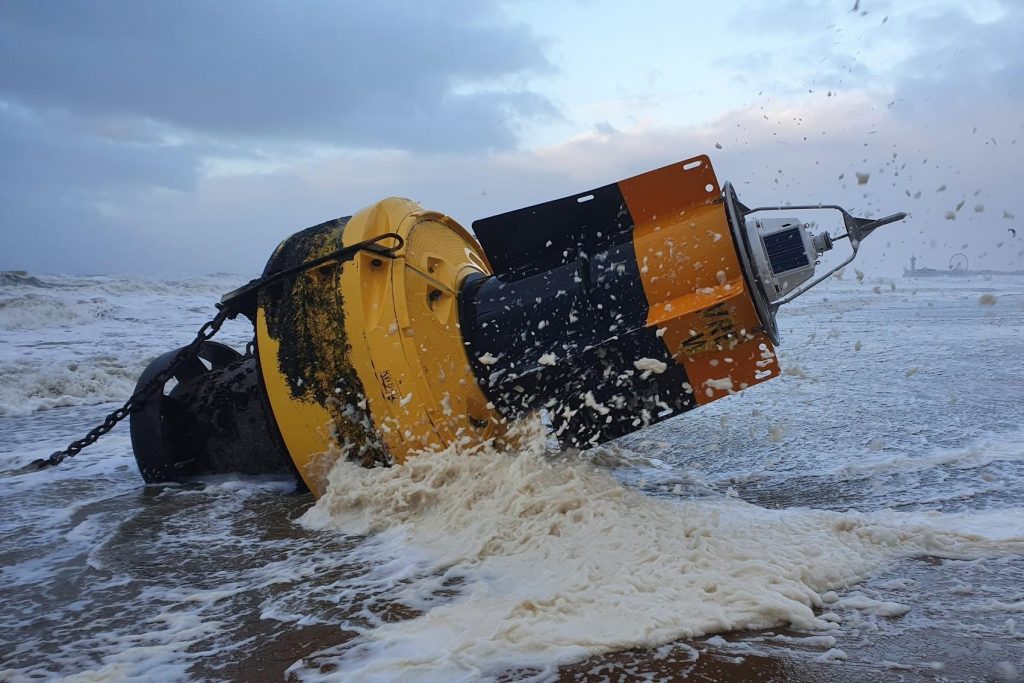
2.1.3 Buoys and weather stations Buoys and weather stations in the ocean and on land provide essential data about surface conditions, such as wind speed, air pressure, and sea surface temperature. These measurements help forecasters understand the storm’s interaction with its environment and assess its potential for intensification.
2.2 Analyzing atmospheric and oceanic conditions In addition to directly observing hurricanes, forecasters analyze various atmospheric and oceanic conditions that influence hurricane development and behavior. Some of the key factors considered are:
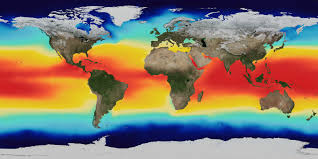
2.2.1 Sea surface temperature Warm ocean water, typically above 26.5°C (79.7°F), is essential for hurricane formation and intensification. Forecasters monitor sea surface temperatures using satellite data and buoy measurements to identify areas that are conducive to hurricane development.
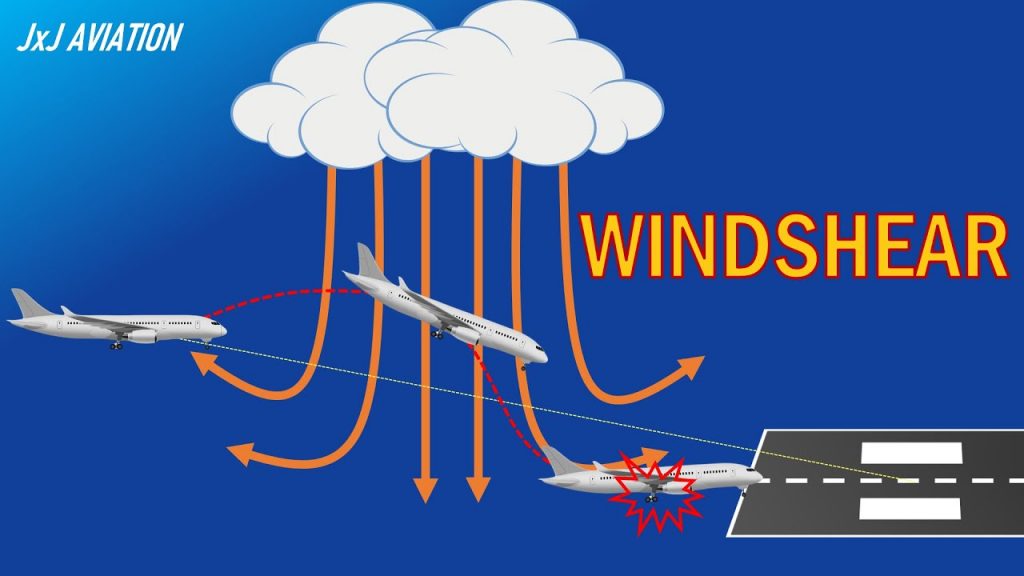
2.2.2 Wind shear Wind shear refers to the change in wind speed or direction with height in the atmosphere. High wind shear can disrupt the vertical structure of a hurricane, causing it to weaken or dissipate. Forecasters assess wind shear using satellite data, weather balloon observations, and numerical weather models.
2.2.3 Atmospheric pressure Hurricanes are characterized by low air pressure at their center. Forecasters monitor changes in atmospheric pressure using barometers on buoys, ships, and land-based weather stations. A rapid drop in pressure often indicates that a storm is intensifying.
2.3 Historical data and trends Analyzing historical hurricane data and trends is crucial for improving our understanding of these storms and refining forecasting techniques. Scientists study past hurricane seasons, landfall locations, intensities, and tracks to identify patterns and relationships with atmospheric and oceanic conditions. This information helps forecasters develop statistical models and analog forecasts based on similar historical situations. Additionally, examining long-term trends in hurricane activity can provide insights into the potential impacts of climate change on hurricane frequency and intensity.
By collecting and analyzing a wide range of data from multiple sources, forecasters can build a comprehensive picture of a hurricane’s current state and its likely future behavior. This information forms the foundation for the development and application of forecasting models and techniques, which will be discussed in the next part of this guide.
Part 3: Forecasting Models and Techniques
Forecasting hurricanes involves using various models and techniques to predict the track, intensity, and potential impacts of these storms. Meteorologists and researchers rely on a combination of statistical and dynamical models to generate forecasts.
3.1 Statistical models Statistical models, also known as statistical-dynamical models, use historical data on past hurricanes and their relationships with environmental variables to predict the behavior of current storms. These models consider factors such as sea surface temperature, atmospheric pressure, and wind shear to estimate the likelihood of hurricane formation, intensification, and movement. Some examples of statistical models include: a. Statistical Hurricane Intensity Prediction Scheme (SHIPS) b. Logistic Growth Equation Model (LGEM) c. Rapid Intensification Index (RII)
Statistical models are generally less computationally intensive than dynamical models and can provide quick guidance on hurricane behavior. However, they may not capture the full complexity of hurricane dynamics and can be limited by the quality and quantity of historical data.
3.2 Dynamical models Dynamical models, also called numerical weather prediction models, use mathematical equations to simulate the physical processes that govern hurricane formation and evolution. These models divide the atmosphere and ocean into grid cells and solve equations that describe the motion of air and water, as well as the transfer of heat and moisture. Dynamical models can be further categorized into two types:
3.2.1 Global models Global models simulate the entire Earth’s atmosphere and oceans, providing a comprehensive view of the large-scale environmental conditions that influence hurricane behavior. Some examples of global models include: a. Global Forecast System (GFS) b. European Centre for Medium-Range Weather Forecasts (ECMWF) c. Navy Global Environmental Model (NAVGEM)
Global models have a relatively coarse spatial resolution, typically ranging from 10 to 50 kilometers between grid points. They are useful for identifying large-scale patterns and long-term trends but may not capture the finer details of hurricane structure and intensity.
3.2.2 Regional models Regional models, also known as limited-area models or mesoscale models, focus on a specific region of interest and provide higher-resolution simulations of hurricane behavior. These models use boundary conditions from global models but can resolve smaller-scale features such as hurricane eye structure and rainbands. Some examples of regional models include: a. Hurricane Weather Research and Forecasting (HWRF) Model b. Hurricanes in a Multi-scale Ocean-coupled Non-hydrostatic (HMON) Model c. Advanced Hurricane WRF (AHW) Model
Regional models typically have a spatial resolution of 1 to 10 kilometers, allowing for more detailed predictions of hurricane track, intensity, and structure. However, they are computationally expensive and may have shorter lead times compared to global models.
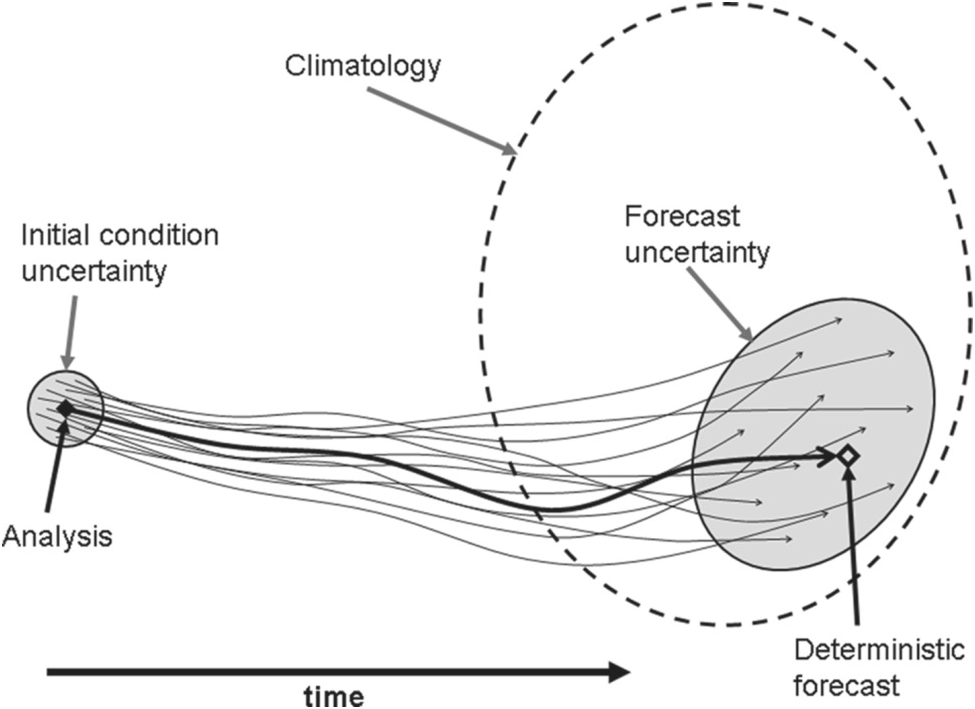
3.3 Ensemble forecasting Ensemble forecasting involves running multiple simulations of a hurricane using slightly different initial conditions, model physics, or model types. By generating a range of possible outcomes, ensemble forecasting helps quantify the uncertainty in hurricane predictions and provides probabilistic guidance on hurricane track, intensity, and impacts. Ensemble forecasting can be applied to both statistical and dynamical models.
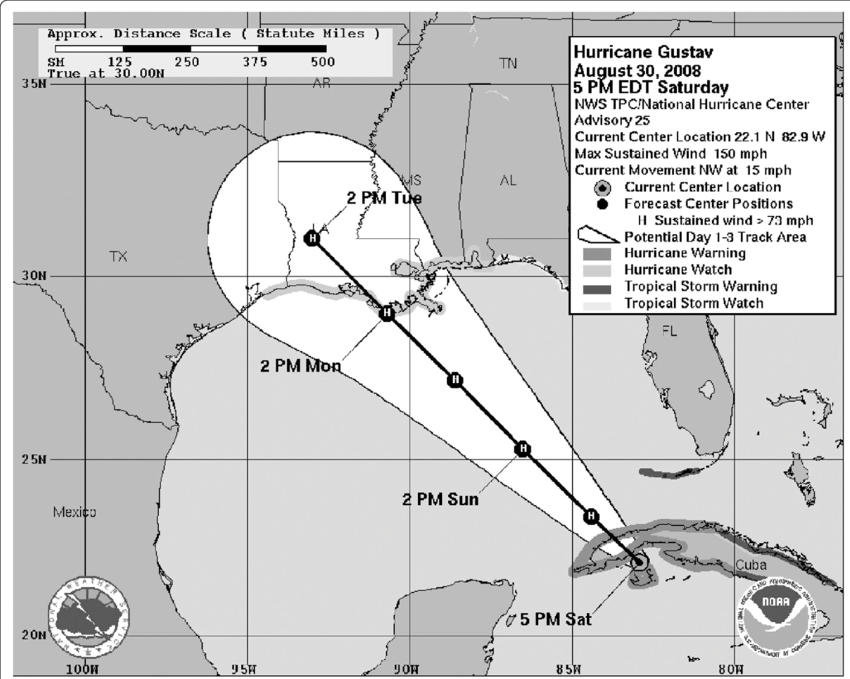
3.4 Interpreting model output Interpreting the output from hurricane forecasting models requires expertise in meteorology and an understanding of the strengths and limitations of each model. Forecasters analyze various model outputs, such as track plots, intensity graphs, and wind field maps, to assess the likely evolution of a hurricane. They also consider the consistency between different models and the overall pattern of model predictions to generate the official forecast.
Hurricane forecasting checklist:
Sea Surface Temperature (SST):
Look for SSTs of at least 26.5°C (79.7°F) extending to a depth of about 50 meters. Higher SSTs provide more energy for the storm to develop and intensify.
Atmospheric Instability:
Check for a moist, unstable atmosphere that allows warm air to rise easily. Look for a deep layer of warm, humid air extending from the surface to the mid-troposphere. Evaluate the presence of convective available potential energy (CAPE) to support thunderstorm development.
Low Wind Shear:
Analyze the vertical wind shear, which is the change in wind speed or direction with height. Ideal conditions for hurricane development have wind shear values less than 10 knots (11.5 mph or 18.5 km/h) between the lower and upper troposphere. High wind shear can disrupt the storm’s circulation and prevent it from intensifying.
Moisture Content:
Assess the presence of a moist environment, particularly in the mid-troposphere (around 5 km or 3 miles altitude). High relative humidity (greater than 70%) in this layer is conducive to hurricane development.
Pre-existing Disturbance:
Identify any pre-existing disturbances, such as tropical waves, low-pressure systems, or remnants of previous storms. These disturbances can act as seed areas for hurricane development if other conditions are favorable.
NOAA National Data Buoy Center: https://www.ndbc.noaa.gov/ NOAA Aircraft Operations Center: https://www.omao.noaa.gov/learn/aircraft-operations NOAA Hurricane Hunters: https://www.aoml.noaa.gov/hrd/about_hrd/HRD-P3_program.html
Forecasting:
NOAA National Hurricane Center: https://www.nhc.noaa.gov/ NOAA Environmental Modeling Center: https://www.emc.ncep.noaa.gov/ NOAA Hurricane Weather Research and Forecasting (HWRF) Model: https://www.emc.ncep.noaa.gov/gc_wmb/vxt/HWRF/
Advisories:
NOAA National Hurricane Center Advisories: https://www.nhc.noaa.gov/cyclones/ NOAA National Weather Service: https://www.weather.gov/ FEMA (Federal Emergency Management Agency): https://www.fema.gov/
Flood Maps:
FEMA Flood Map Service Center: https://msc.fema.gov/portal/home NOAA National Hurricane Center Storm Surge Inundation Maps: https://www.nhc.noaa.gov/surge/inundation/ USGS (United States Geological Survey) Flood Event Viewer: https://stn.wim.usgs.gov/FEV/
Forecast model links:
1. Tropical Tidbits: https://www.tropicaltidbits.com/ – Provides a wide range of model data, satellite imagery, and analysis tools
2. Mike’s Weather Page: https://spaghettimodels.com/ – Offers a collection of spaghetti models, forecast discussions, and other tools
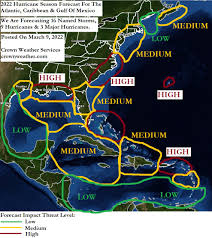
3. Crown Weather Services: https://crownweather.com/ – Includes detailed forecast discussions, model data, and a focus on the Atlantic basin
4. Cyclocane: https://www.cyclocane.com/ – Features an interactive map with various model tracks and satellite imagery
5. Hurricane Track: https://hurricanetrack.com/ – Provides a mix of professional analysis, model data, and user-friendly explanations
6. Severe Weather Europe: https://www.severe-weather.eu/tropical-weather/ – Covers tropical weather worldwide, with a focus on European interests
7. Force Thirteen: https://www.force-13.com/ – Offers live coverage, model analysis, and a community-driven approach to hurricane tracking
8. Instant Weather Maps: https://www.instantweathermaps.com/ – Provides a variety of weather maps, including tropical cyclone data and model outputs
9. Windy: https://www.windy.com/ – An interactive weather visualization platform with various forecast models and hurricane tracking features
10. NOAA’s Atlantic Oceanographic and Meteorological Laboratory (AOML): https://www.aoml.noaa.gov/hrd/graphics_sub_pages/models.html – While part of an official agency, AOML provides a comprehensive collection of model data and graphics
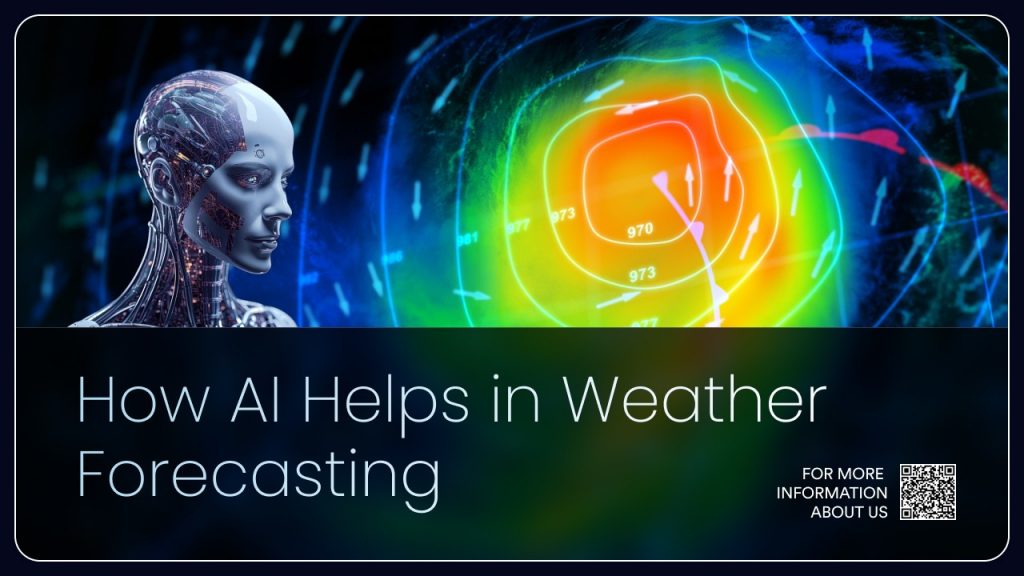
One of the key ways AI is being used in weather forecasting is through machine learning algorithms. These algorithms can analyze vast amounts of historical weather data, including temperature, humidity, wind speed, and precipitation, to identify patterns and make predictions about future weather events. By continuously learning from new data, these algorithms can improve their accuracy over time, leading to more reliable forecasts.
Another area where AI is making a significant impact is in the interpretation of weather satellite imagery. Traditional methods of analyzing satellite data can be time-consuming and prone to human error. However, AI-powered systems can quickly and accurately identify weather patterns and anomalies in satellite images, providing meteorologists with valuable insights into developing weather systems.
AI is also being used to improve the resolution and accuracy of weather models. By incorporating machine learning techniques, researchers can create more detailed and precise models that can simulate weather conditions down to the neighborhood level. This level of granularity can be particularly useful for predicting the impact of severe weather events, such as hurricanes and tornadoes, on specific communities.
In addition to improving the accuracy of weather forecasts, AI is also helping to make them more accessible and user-friendly. Many weather apps and websites now use AI-powered chatbots and virtual assistants to provide personalized weather information and alerts based on a user’s location and preferences. This can help individuals and businesses make more informed decisions about their daily activities and operations.
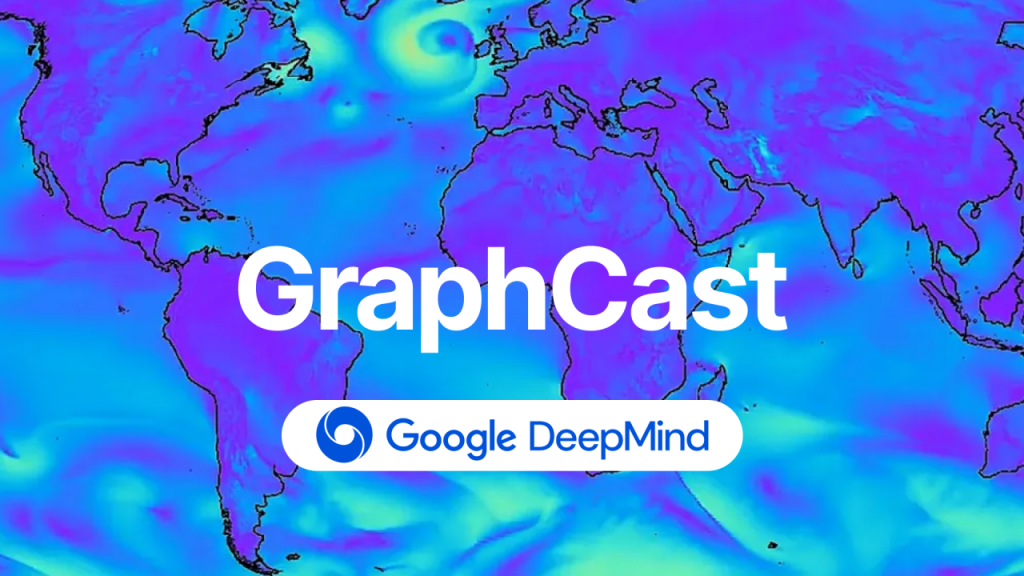
Title: The Future Potential of AI in Weather Forecasting: Building on Google’s GraphCast
Google’s GraphCast represents a significant advancement in the field of weather forecasting, utilizing artificial intelligence (AI) and Graph Neural Networks (GNNs) to deliver highly accurate 10-day weather predictions in a fraction of the time required by traditional methods. This groundbreaking technology not only improves the accuracy and efficiency of weather forecasts but also demonstrates the potential for AI to revolutionize the field of meteorology.
One of the most promising aspects of GraphCast is its ability to identify and predict extreme weather events, such as cyclones, atmospheric rivers, and heat waves, with greater accuracy and lead time than traditional forecasting models. This early warning capability could prove invaluable in saving lives and minimizing the impact of severe weather on communities. As AI continues to advance, it is likely that models like GraphCast will become even more adept at detecting and predicting these extreme events, allowing for better preparedness and response.
Looking to the future, the potential applications of AI in weather forecasting are vast. By building upon the foundation laid by GraphCast, researchers and meteorologists could develop even more sophisticated models that incorporate additional data sources, such as satellite imagery, radar, and weather station observations. These enhanced models could provide even greater accuracy and granularity in weather predictions, allowing for more localized and personalized forecasts. Additionally, AI could be used to develop long-term climate models, helping scientists better understand and predict the impacts of climate change on weather patterns and extreme events. As the world continues to grapple with the challenges posed by a changing climate, the insights provided by AI-powered weather and climate models will become increasingly critical in informing policy decisions and guiding adaptation and mitigation efforts.
Despite the many benefits of AI in weather forecasting, there are also some challenges and limitations to consider. One concern is the potential for AI systems to perpetuate biases or errors in historical weather data, leading to inaccurate predictions. Another challenge is the need for large amounts of high-quality data to train and validate AI models, which can be difficult and expensive to obtain.
Despite these challenges, the future of weather forecasting looks bright thanks to the continued advancement of AI technologies. As more data becomes available and AI algorithms become more sophisticated, we can expect to see even more accurate and detailed weather forecasts in the years to come. This will not only help us better prepare for and respond to severe weather events but also enable us to make more informed decisions about everything from agriculture to transportation to energy production.
Storm Chasing: The Thrilling Pursuit of Nature’s Fury
Since the dawn of human civilization, storms have captivated and terrified us in equal measure. However, it wasn’t until the 20th century that a group of intrepid individuals began actively pursuing these meteorological marvels, giving birth to the exhilarating and often dangerous field of storm chasing.
Before the advent of modern storm chasing, the study of tornadoes and severe weather was a far cry from the sophisticated pursuit we know today. In the 1800s, the scientific understanding of these powerful natural phenomena was still in its infancy, and the concept of actively seeking out storms was virtually unheard of.
During this time, the primary sources of information about tornadoes were the accounts of those who had witnessed them firsthand. These eyewitness reports, often filled with vivid descriptions and harrowing tales of survival, laid the foundation for our early understanding of severe weather. One of the most famous accounts from this era is that of John Park Finley, a sergeant in the U.S. Army Signal Corps who became fascinated with tornadoes after surviving a close encounter in 1882.
Finley’s experience sparked a lifelong passion for studying severe weather, and he went on to become one of the most influential figures in the field. In 1884, he published the first comprehensive study of tornadoes in the United States, titled “Report on the Character of Six Hundred Tornadoes.” This groundbreaking work, which included detailed descriptions and classifications of tornadoes, served as a cornerstone for future research.
Despite the efforts of individuals like Finley, the scientific community of the 1800s was largely skeptical of the idea that tornadoes could be studied in a systematic way. Many believed that these powerful storms were too unpredictable and chaotic to be understood, and the notion of actively pursuing them was considered foolhardy at best.
However, this began to change in the late 1800s, as advances in technology and communication made it easier to track and study severe weather. The invention of the telegraph allowed for the rapid dissemination of weather reports, and the establishment of a national weather service in 1870 marked a significant step forward in the organized study of meteorology.
In the heart of Oklahoma, at Tinker Air Force Base, a groundbreaking event took place on March 25, 1948, that would forever change the course of severe weather forecasting. On this fateful day, a group of Air Force meteorologists, led by the visionary Captain Robert C. Miller and Major Ernest J. Fawbush, issued the world’s first tornado forecast. This remarkable achievement marked a turning point in our understanding of these powerful storms and paved the way for the development of modern storm chasing and severe weather research.
The events leading up to this historic moment were nothing short of extraordinary. Miller and Fawbush, both brilliant meteorologists, had been tasked with investigating the devastating tornado that struck Tinker Air Force Base on March 20, 1948, causing significant damage and injuring several personnel. As they pored over weather data and eyewitness accounts, the two men began to notice patterns and conditions that seemed to precede the formation of tornadoes. With a powerful cold front approaching and similar atmospheric conditions to the March 20th tornado in place, Miller and Fawbush made a bold decision: they would issue a tornado forecast for the following day.
The forecast, which was met with skepticism by some of their colleagues, proved to be remarkably accurate. On March 25, 1948, a tornado touched down just miles from Tinker Air Force Base, causing damage but no fatalities thanks to the advance warning provided by Miller and Fawbush’s forecast. This incredible success story quickly spread throughout the meteorological community, sparking a renewed interest in the study of tornadoes and severe weather. The Tinker Air Force Base breakthrough not only demonstrated the potential for tornado forecasting but also highlighted the critical importance of understanding these powerful storms. As a result, the field of storm chasing began to evolve, with a growing number of researchers and enthusiasts dedicating themselves to unlocking the secrets of nature’s fury.
The roots of storm chasing can be traced back to the 1950s when a handful of weather enthusiasts, armed with little more than their curiosity and a few rudimentary instruments, ventured out to observe storms up close. Among these early pioneers was David Hoadley, widely regarded as the father of storm chasing. Hoadley’s fascination with severe weather led him to found the Storm Track magazine in 1977, which became a bible for aspiring storm chasers.
Another notable figure in the history of storm chasing is Neil Ward, a meteorology professor at the University of Oklahoma. In the early 1970s, Ward began taking his students on field trips to observe severe weather, laying the groundwork for what would eventually become a thriving research community. His work paved the way for future scientists to study storms in their natural environment, leading to significant advancements in our understanding of severe weather.
The 1980s saw a surge in the popularity of storm chasing, thanks in part to the advent of Doppler radar and the increasing availability of portable video cameras. This decade also witnessed the rise of some of the most iconic figures in storm chasing history, including Tim Marshall, Gene Moore, and the late Al Moller. These individuals, along with many others, helped to establish storm chasing as a legitimate field of study and a thrilling pursuit for adventure seekers.
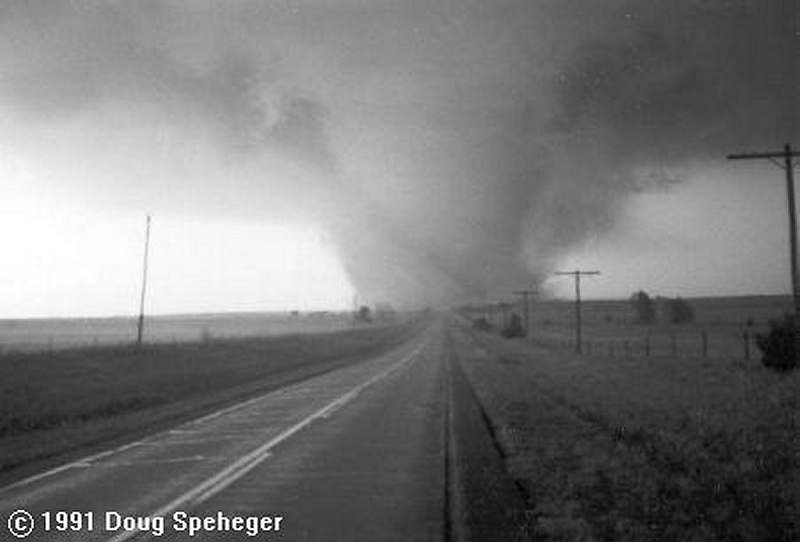
One of the most significant milestones in storm chasing history occurred on April 26, 1991, when a group of chasers, including Tim Marshall and Gene Moore, captured the first-ever footage of a tornado from start to finish. This groundbreaking achievement not only provided scientists with invaluable data but also sparked a renewed interest in storm chasing among the general public.
The 1990s and early 2000s saw storm chasing enter the mainstream, with the release of popular films like “Twister” and the rise of television shows dedicated to severe weather. This increased visibility brought with it a new generation of storm chasers, eager to experience the thrill of the chase and contribute to our understanding of these awe-inspiring natural phenomena.
As we entered the 21st century, storm chasing underwent a dramatic transformation, fueled by rapid advancements in technology, improved forecasting models, and a growing public fascination with severe weather. The period from 2000 to 2024 saw an explosion in the popularity of storm chasing, with a new generation of chasers pushing the boundaries of what was possible in the pursuit of nature’s fury.
One of the most significant developments during this time was the rise of high-resolution weather models and the increasing availability of mobile weather radar applications. These tools allowed storm chasers to track and predict the movement of storms with unprecedented accuracy, revolutionizing the way they approached their craft. No longer were chasers reliant on radio reports or their own intuition to guide them; now, they could access real-time data and detailed forecasts at the touch of a button. This technological leap forward not only made storm chasing safer and more efficient but also opened up the field to a wider range of participants, from seasoned researchers to amateur enthusiasts.
The 2000s also saw the emergence of a new breed of storm chaser, epitomized by the likes of Reed Timmer. Timmer, a meteorologist and extreme storm chaser, gained notoriety for his daring exploits and his custom-built armored vehicle, designed to withstand the forces of even the most violent tornadoes. His adventures, along with those of other extreme chasers, captured the public’s imagination and helped to fuel a growing interest in storm chasing as a recreational pursuit. The launch of the Discovery Channel’s “Storm Chasers” television series in 2007 further cemented the popularity of storm chasing, bringing the thrills and dangers of the chase into living rooms across the country.
Today, storm chasing remains a vital tool for researchers seeking to unravel the mysteries of severe weather. While technology has advanced significantly since the early days of Hoadley and Ward, the spirit of adventure and the desire to witness nature’s raw power continue to drive storm chasers to pursue their passion. As climate change contributes to an increasing frequency and intensity of severe weather events, the work of these dedicated individuals has never been more important.
The birth of a hurricane is a fascinating process, often starting from inconspicuous beginnings that evolve into powerful storms capable of wreaking havoc. Let’s delve into the early stages of hurricane development, where seemingly innocuous atmospheric disturbances transform into organized systems with the potential for destruction.
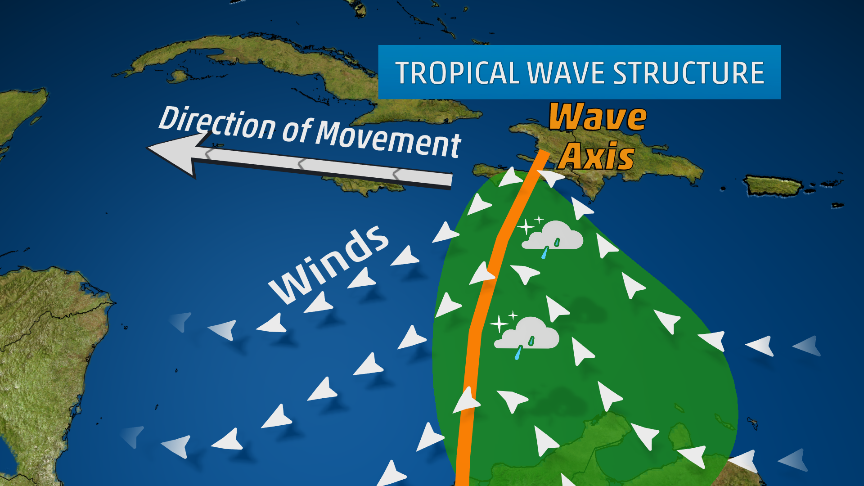
Tropical Wave: The Seed of a Storm
The journey often begins with a tropical wave, an elongated area of low pressure that originates over the warm waters of the tropics, often off the west coast of Africa. These waves, propelled by easterly trade winds, travel westward across the Atlantic Ocean, carrying showers and thunderstorms within their midst. While most tropical waves dissipate harmlessly, some possess the ingredients necessary to evolve into something more ominous.
Warm Ocean Waters: Hurricanes draw their energy from warm ocean waters, typically with surface temperatures of at least 80°F (26.5°C). This heat provides the fuel for the storm’s development and intensification.
Coriolis Effect: The Earth’s rotation creates a force known as the Coriolis effect, which causes winds to deflect to the right in the Northern Hemisphere and to the left in the Southern Hemisphere. This deflection plays a crucial role in the cyclonic rotation of hurricanes.
Low Vertical Wind Shear: Vertical wind shear refers to the change in wind speed and direction with height. Low wind shear allows the storm to develop and maintain its vertical structure, while high wind shear can disrupt the storm’s organization.
Pre-existing Disturbance: A pre-existing weather disturbance, such as a tropical wave or a cluster of thunderstorms, provides the initial seed for hurricane formation.
Evolution from Disturbance to Depression:
If a tropical wave encounters these favorable conditions, it can begin to organize and intensify. As thunderstorms cluster around the area of low pressure, a tropical disturbance forms. If the circulation becomes more defined and wind speeds reach up to 38 mph (62 kph), it is classified as a tropical depression.
The Critical Transition to Tropical Storm:
The transition from a tropical depression to a tropical storm marks a significant step in the storm’s development. As the wind speeds increase to 39-73 mph (63-118 kph), the storm becomes more organized and develops a distinct cyclonic circulation. At this stage, it receives a name and is officially recognized as a tropical storm, posing a potential threat to land areas within its path.
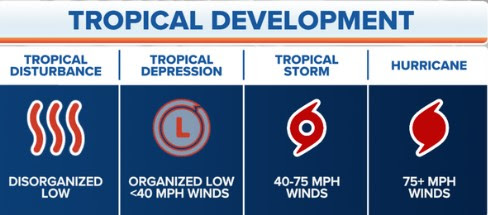
Stages of Hurricane Development:
Tropical Disturbance: A cluster of thunderstorms with a weak circulation forms over warm ocean waters.
Tropical Depression: The circulation becomes more organized, and wind speeds reach up to 38 mph (62 kph).
Tropical Storm: Wind speeds increase to 39-73 mph (63-118 kph), and the storm receives a name.
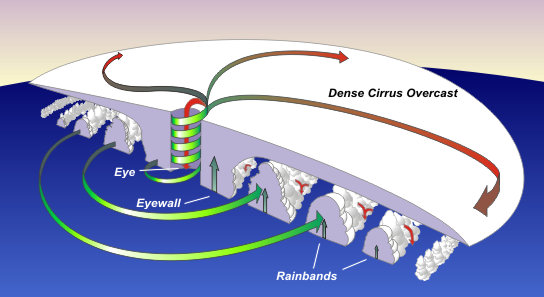
Hurricane: Wind speeds reach 74 mph (119 kph) or higher, and the storm exhibits a well-defined eye surrounded by a ring of intense thunderstorms known as the eyewall.
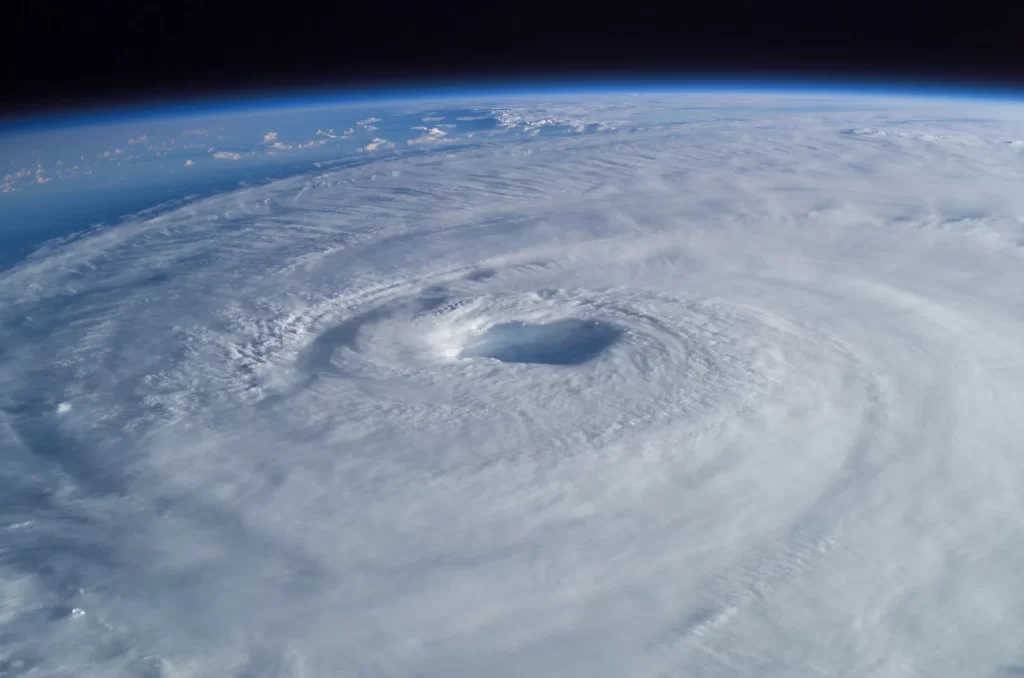
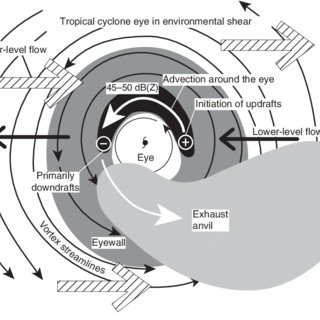
Eye and Eyewall Dynamics:
The eye of the hurricane is a relatively calm area of low pressure surrounded by the eyewall, the region of highest winds and heaviest rainfall. Air rises rapidly in the eyewall, releasing latent heat and fueling the storm’s intensity. The eye forms as a result of the balance between the inward-flowing air and the upward-rising air in the eyewall.
Factors Influencing Intensity:
Several factors influence hurricane intensity, including:
Sea surface temperatures: Warmer waters provide more energy for the storm to intensify.
Ocean heat content: The depth of warm water also plays a role, as deeper warm layers provide more sustained energy for the hurricane.
Atmospheric moisture: Higher moisture content in the atmosphere can fuel stronger thunderstorms and contribute to intensification.
Upper-level atmospheric conditions: Favorable upper-level winds can help vent the storm and promote further intensification.
Understanding Hurricane Categories and Associated Damage
Hurricane categories, based on the Saffir-Simpson Hurricane Wind Scale, classify these storms based on their maximum sustained wind speeds and the potential damage they can inflict. This scale helps communicate the severity of a hurricane and guide preparedness efforts.
Category 1 (74-95 mph):
Damage: Primarily to trees and foliage, with some damage to roofs, siding, and unanchored mobile homes. Power outages are likely.
Damage: Devastating damage to trees and foliage, with major damage to roofs, siding, and mobile homes. Structural damage to small buildings is possible. Power and water outages can last for extended periods.
Damage: Catastrophic damage to trees and foliage, with severe damage to well-built homes. Roofs can be completely torn off, and exterior walls can collapse. Power outages can last for weeks or even months. Extensive coastal flooding and inland flooding are expected.
Historical Examples: Hurricane Harvey (2017), Hurricane Maria (2017)
Category 5 (157 mph or higher):
Damage: The most catastrophic damage, with complete roof failure and wall collapse on many residential and industrial buildings. Most trees will be snapped or uprooted. Power outages can last for months, and areas may be uninhabitable for extended periods.
Historical Examples: Hurricane Andrew (1992), Hurricane Michael (2018)
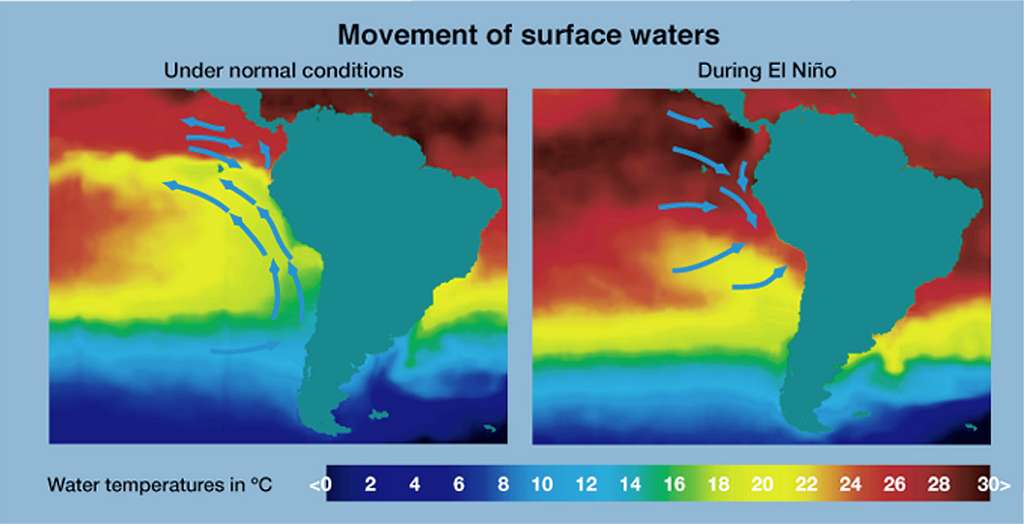
El Niño and La Niña, naturally occurring climate patterns originating in the tropical Pacific Ocean, have far-reaching effects on weather patterns worldwide. These phenomena, collectively known as the El Niño-Southern Oscillation (ENSO), influence temperature, precipitation, and atmospheric circulation, leading to a cascade of impacts on ecosystems, agriculture, and human societies.
The Science Behind ENSO:
Under normal conditions, trade winds blow westward across the tropical Pacific, pushing warm surface waters towards Indonesia and Australia. This allows cooler water to upwell along the coast of South America. However, during El Niño events, these trade winds weaken or even reverse, causing warm water to spread eastward towards the central and eastern Pacific. Conversely, during La Niña, trade winds strengthen, intensifying the upwelling of cool water in the eastern Pacific and pushing warm water westward.
Impacts of El Niño:
Warmer Global Temperatures: El Niño events are typically associated with a rise in global average temperatures, as the release of heat from the tropical Pacific warms the atmosphere.
Altered Precipitation Patterns: El Niño can cause increased rainfall in the southern United States and parts of South America, while leading to drier conditions in Indonesia, Australia, and Southeast Asia.
Increased Hurricane Activity: The warmer waters in the central and eastern Pacific during El Niño can fuel hurricane formation in the eastern Pacific basin and reduce hurricane activity in the Atlantic basin.
Predicting and Monitoring ENSO:
Impacts of La Niña:
Cooler Global Temperatures: La Niña events tend to have a cooling effect on global temperatures, as the upwelling of cool water in the eastern Pacific influences atmospheric circulation.
Droughts and Floods: La Niña can exacerbate drought conditions in the southwestern United States and South America, while leading to increased rainfall and flooding in Australia, Indonesia, and Southeast Asia.
Active Hurricane Seasons: La Niña often corresponds with increased hurricane activity in the Atlantic basin due to reduced wind shear and favorable atmospheric conditions.
Scientists use a variety of tools, including sea surface temperature measurements, satellite observations, and computer models, to monitor and predict El Niño and La Niña events. While ENSO is a natural cycle, understanding and predicting its phases is crucial for preparing for potential impacts on agriculture, water resources, and disaster management.
Impacts on Society and the Environment:
El Niño and La Niña can have significant socioeconomic and environmental consequences. Droughts and floods can impact agricultural yields, leading to food insecurity and economic losses. Changes in ocean temperatures can disrupt marine ecosystems, affecting fish populations and coastal communities.
Specific Examples of El Niño and La Niña Impacts on Countries:
El Niño Impacts:
Peru and Ecuador: El Niño can bring heavy rainfall and flooding to these coastal nations, causing landslides, infrastructure damage, and disruptions to fishing industries due to warmer ocean temperatures. The 1997-98 El Niño event led to devastating floods and economic losses in both countries.
Indonesia and Australia: El Niño often results in drier conditions and increased risk of wildfires in these regions. The 2015-16 El Niño contributed to severe droughts and widespread forest fires in Indonesia, causing significant air pollution and economic damage.
Southern United States: El Niño can lead to wetter winters in California and the southern US, alleviating drought conditions but also increasing the risk of flooding and mudslides.
La Niña Impacts:
East Africa (Kenya, Somalia, Ethiopia): La Niña typically exacerbates drought conditions in East Africa, leading to crop failures, food insecurity, and water scarcity. The 2010-11 La Niña event contributed to a severe famine in Somalia.
Australia: La Niña often brings above-average rainfall and increased flooding to eastern Australia. The 2010-11 La Niña event resulted in widespread flooding in Queensland, causing significant damage to infrastructure and agriculture.
Southeast Asia (Thailand, Vietnam, Philippines): La Niña can lead to increased rainfall and flooding in Southeast Asia, impacting rice production and increasing the risk of landslides and other natural disasters.
El Niño’s Influence:
Hurricanes: El Niño typically suppresses hurricane activity in the Atlantic basin. The increased wind shear in the upper atmosphere during El Niño disrupts the formation and intensification of hurricanes. This means fewer hurricanes make landfall along the US East Coast and Gulf Coast during El Niño years.
Tornadoes: The relationship between El Niño and tornadoes in the US is complex and varies regionally. Some studies suggest El Niño can lead to increased tornado activity in the Gulf Coast states during winter and spring, while potentially reducing tornado occurrences in the Great Plains during spring.
La Niña’s Influence:
Hurricanes: La Niña often creates favorable conditions for hurricane development in the Atlantic basin. The reduced wind shear and warmer sea surface temperatures provide the necessary ingredients for hurricane formation and intensification. This can lead to more frequent and stronger hurricanes impacting the US East Coast and Gulf Coast during La Niña years.
Tornadoes: La Niña can influence tornado activity in the US, particularly in the spring months. The stronger jet stream and increased wind shear associated with La Niña can create a more conducive environment for tornado formation in the Great Plains and Midwest.
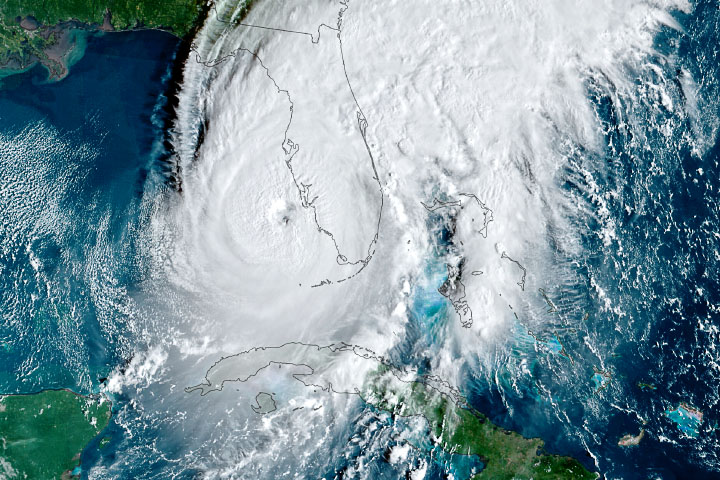
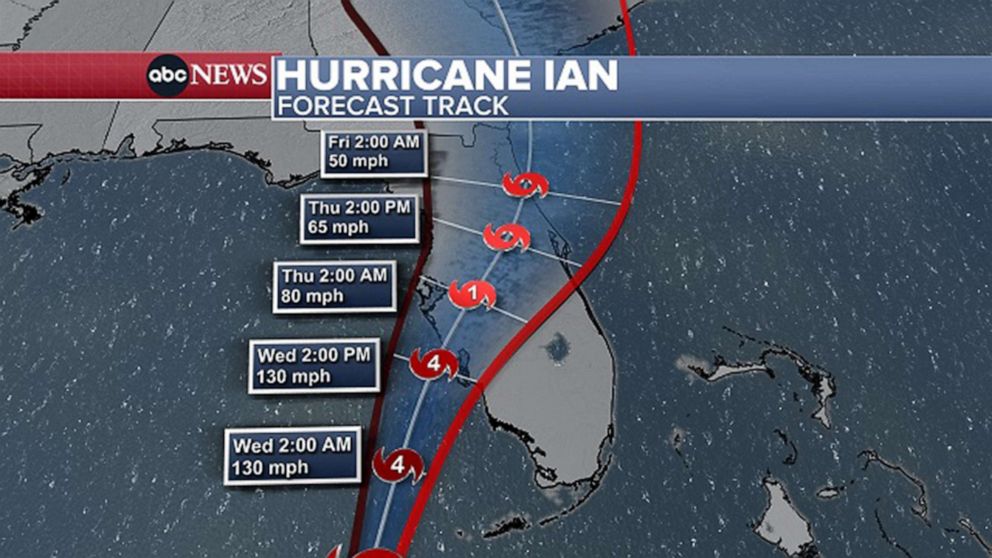
On September 28, 2022, Hurricane Ian, a Category 4 monster with sustained winds of 150 mph, etched its name into the annals of Florida’s hurricane history. The storm, which had undergone rapid intensification in the warm waters of the Gulf of Mexico, made landfall near Cayo Costa, an island off the coast of Fort Myers, bringing with it a catastrophic storm surge, torrential rains, and winds capable of pulverizing structures. Ian’s impact was far-reaching, leaving a trail of destruction across the Florida peninsula and impacting millions of residents.
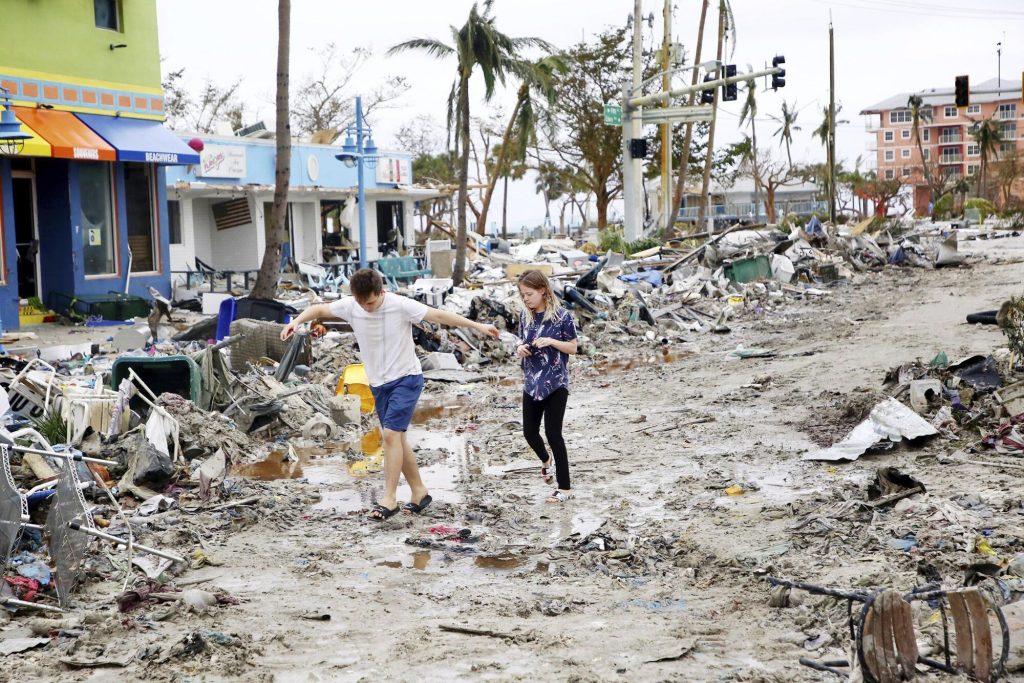
Fort Myers Beach, a popular tourist destination known for its white-sand beaches and vibrant atmosphere, bore the brunt of Ian’s fury. The storm surge, a wall of water reaching heights of 12-18 feet, inundated the island, sweeping away homes, businesses, and landmarks. Videos and images captured the devastation, showing buildings ripped from their foundations and debris floating amidst a sea of churning water. The storm surge’s impact extended inland, flooding communities along the Caloosahatchee River and causing widespread damage.
As Ian moved across the Florida peninsula, it weakened but continued to unleash its destructive power. Heavy rains, exceeding 20 inches in some areas, triggered widespread flooding, transforming streets into rivers and inundating homes. Orlando, a city typically associated with theme parks and sunshine, experienced record rainfall and significant flooding, disrupting daily life and causing extensive damage. The storm’s winds, though diminished, remained strong enough to down trees and power lines, leaving millions without electricity.
The morning of September 27, 2022, dawned with a sense of foreboding for residents along Florida’s Gulf Coast. Hurricane Ian, having churned and intensified in the warm waters of the Gulf of Mexico, was now a Category 3 behemoth, its sights set on the Sunshine State. Mandatory evacuations were ordered for low-lying areas, and a mass exodus began as residents heeded the warnings, fleeing inland in search of safety. Those who remained, either by choice or circumstance, braced for the impending impact, boarding up windows, securing belongings, and seeking shelter in sturdy structures or local shelters.
As the hours ticked by, the storm’s outer bands began to lash the coast, bringing with them squalls of rain and increasingly strong winds. Fort Myers Beach, a vibrant tourist destination known for its white-sand beaches and lively atmosphere, transformed into a ghost town. Palm trees swayed violently, their fronds whipping in the wind, and the normally calm Gulf waters turned into a churning, angry sea. A sense of anxiety and uncertainty hung thick in the air as residents huddled indoors, listening to the howling wind and the relentless pounding of the rain.
By afternoon, Ian’s approach was undeniable. The sky turned an ominous gray, and the wind intensified, carrying with it the roar of the approaching storm. At approximately 3:05 pm, the moment residents had dreaded arrived. Hurricane Ian made landfall near Cayo Costa as a powerful Category 4 storm, its sustained winds of 150 mph capable of ripping buildings apart. The storm surge, a towering wall of water reaching heights of 12-18 feet, roared ashore, engulfing Fort Myers Beach and surrounding areas. Homes were lifted from their foundations and carried away by the raging waters, businesses crumbled into piles of debris, and landmarks that had stood for decades vanished beneath the waves.
The devastation on Fort Myers Beach was catastrophic. The once-idyllic island was transformed into a scene of utter destruction, a tangled mess of debris, destroyed buildings, and flooded streets. Rescue crews, braving the treacherous conditions, began the daunting task of searching for survivors and assessing the damage. Residents who had evacuated returned to find their homes gone, their belongings scattered, and their lives irrevocably changed.
As Ian moved across the Florida peninsula, it weakened but continued to unleash its fury. Heavy rains, exceeding 20 inches in some areas, triggered widespread flooding. In Orlando, a city known for theme parks and sunshine, streets became rivers, cars were submerged, and homes were inundated with water. The storm’s winds, though diminished, downed trees and power lines, leaving millions across the state without electricity and plunging communities into darkness.
The meteorological factors that contributed to Ian’s intensification were a combination of warm waters in the Gulf of Mexico, low wind shear, and a favorable atmospheric pattern. Sea surface temperatures in the Gulf were well above average, providing ample fuel for the storm’s growth. Additionally, wind shear, the change in wind speed and direction with height, which can disrupt hurricane development, was minimal. This allowed Ian to maintain its structure and strengthen rapidly. Finally, a steering pattern in the upper atmosphere guided Ian towards the Florida peninsula, setting the stage for a devastating landfall.
Ian’s impact extended beyond the immediate devastation of wind and water. The storm disrupted supply chains, leading to shortages of gasoline and other essential goods. The tourism industry, a vital part of Florida’s economy, suffered a significant blow, as hotels, attractions, and beaches were damaged or closed. The agricultural sector also experienced losses, with citrus groves and other crops impacted by the storm’s winds and flooding.
Meteorological Genesis and Escalation:
September 23, 2022: A tropical wave emerges off the coast of Africa, embarking on a journey across the Atlantic.
September 24-26, 2022: The tropical wave strengthens into a tropical depression and then Tropical Storm Ian, churning westward through the Caribbean Sea.
September 27, 2022: Ian undergoes rapid intensification, exploding into a major hurricane as it enters the Gulf of Mexico’s warm waters. Florida residents brace for impact as mandatory evacuations are issued for vulnerable coastal areas.
Landfall and the Unleashing of Fury:
September 28, 2022 (Morning): Hurricane Ian, now a monstrous Category 4 storm with sustained winds of 150 mph, takes aim at the Florida Gulf Coast. The atmosphere is thick with anticipation and dread as residents finalize preparations or evacuate inland.
September 28, 2022 (Afternoon): At approximately 3:05 pm, Ian makes landfall near Cayo Costa, an island off the coast of Fort Myers. The storm surge, a towering wall of water reaching heights of 12-18 feet, slams ashore, engulfing coastal communities and causing catastrophic damage. Fort Myers Beach is particularly hard hit, with homes swept away, businesses destroyed, and landmarks obliterated.
Unfolding Devastation and Inland Inundation:
September 28, 2022 (Evening): Ian continues its destructive path across the Florida peninsula, weakening but still packing a powerful punch. Heavy rains, exceeding 20 inches in some areas, trigger widespread flooding. Orlando and other inland cities experience record rainfall, transforming streets into rivers and inundating homes and businesses.
September 29, 2022: The storm weakens further as it moves across central Florida and emerges into the Atlantic Ocean. However, its impact continues to be felt, with widespread power outages, disrupted infrastructure, and ongoing flooding.
The Wake of Destruction and the Road to Recovery:
September 30 – October 2022: The full extent of the devastation becomes clear as floodwaters recede and search and rescue efforts transition to recovery operations. Communities across Florida face the daunting task of rebuilding homes, businesses, and infrastructure. The economic toll of the storm is staggering, with estimates exceeding $100 billion.