Hurricane Ian’s Destructive Path: A Florida Peninsula Battered (September 28, 2022)

On September 28, 2022, Hurricane Ian, a Category 4 monster with sustained winds of 150 mph, etched its name into the annals of Florida’s hurricane history. The storm, which had undergone rapid intensification in the warm waters of the Gulf of Mexico, made landfall near Cayo Costa, an island off the coast of Fort Myers, bringing with it a catastrophic storm surge, torrential rains, and winds capable of pulverizing structures. Ian’s impact was far-reaching, leaving a trail of destruction across the Florida peninsula and impacting millions of residents.

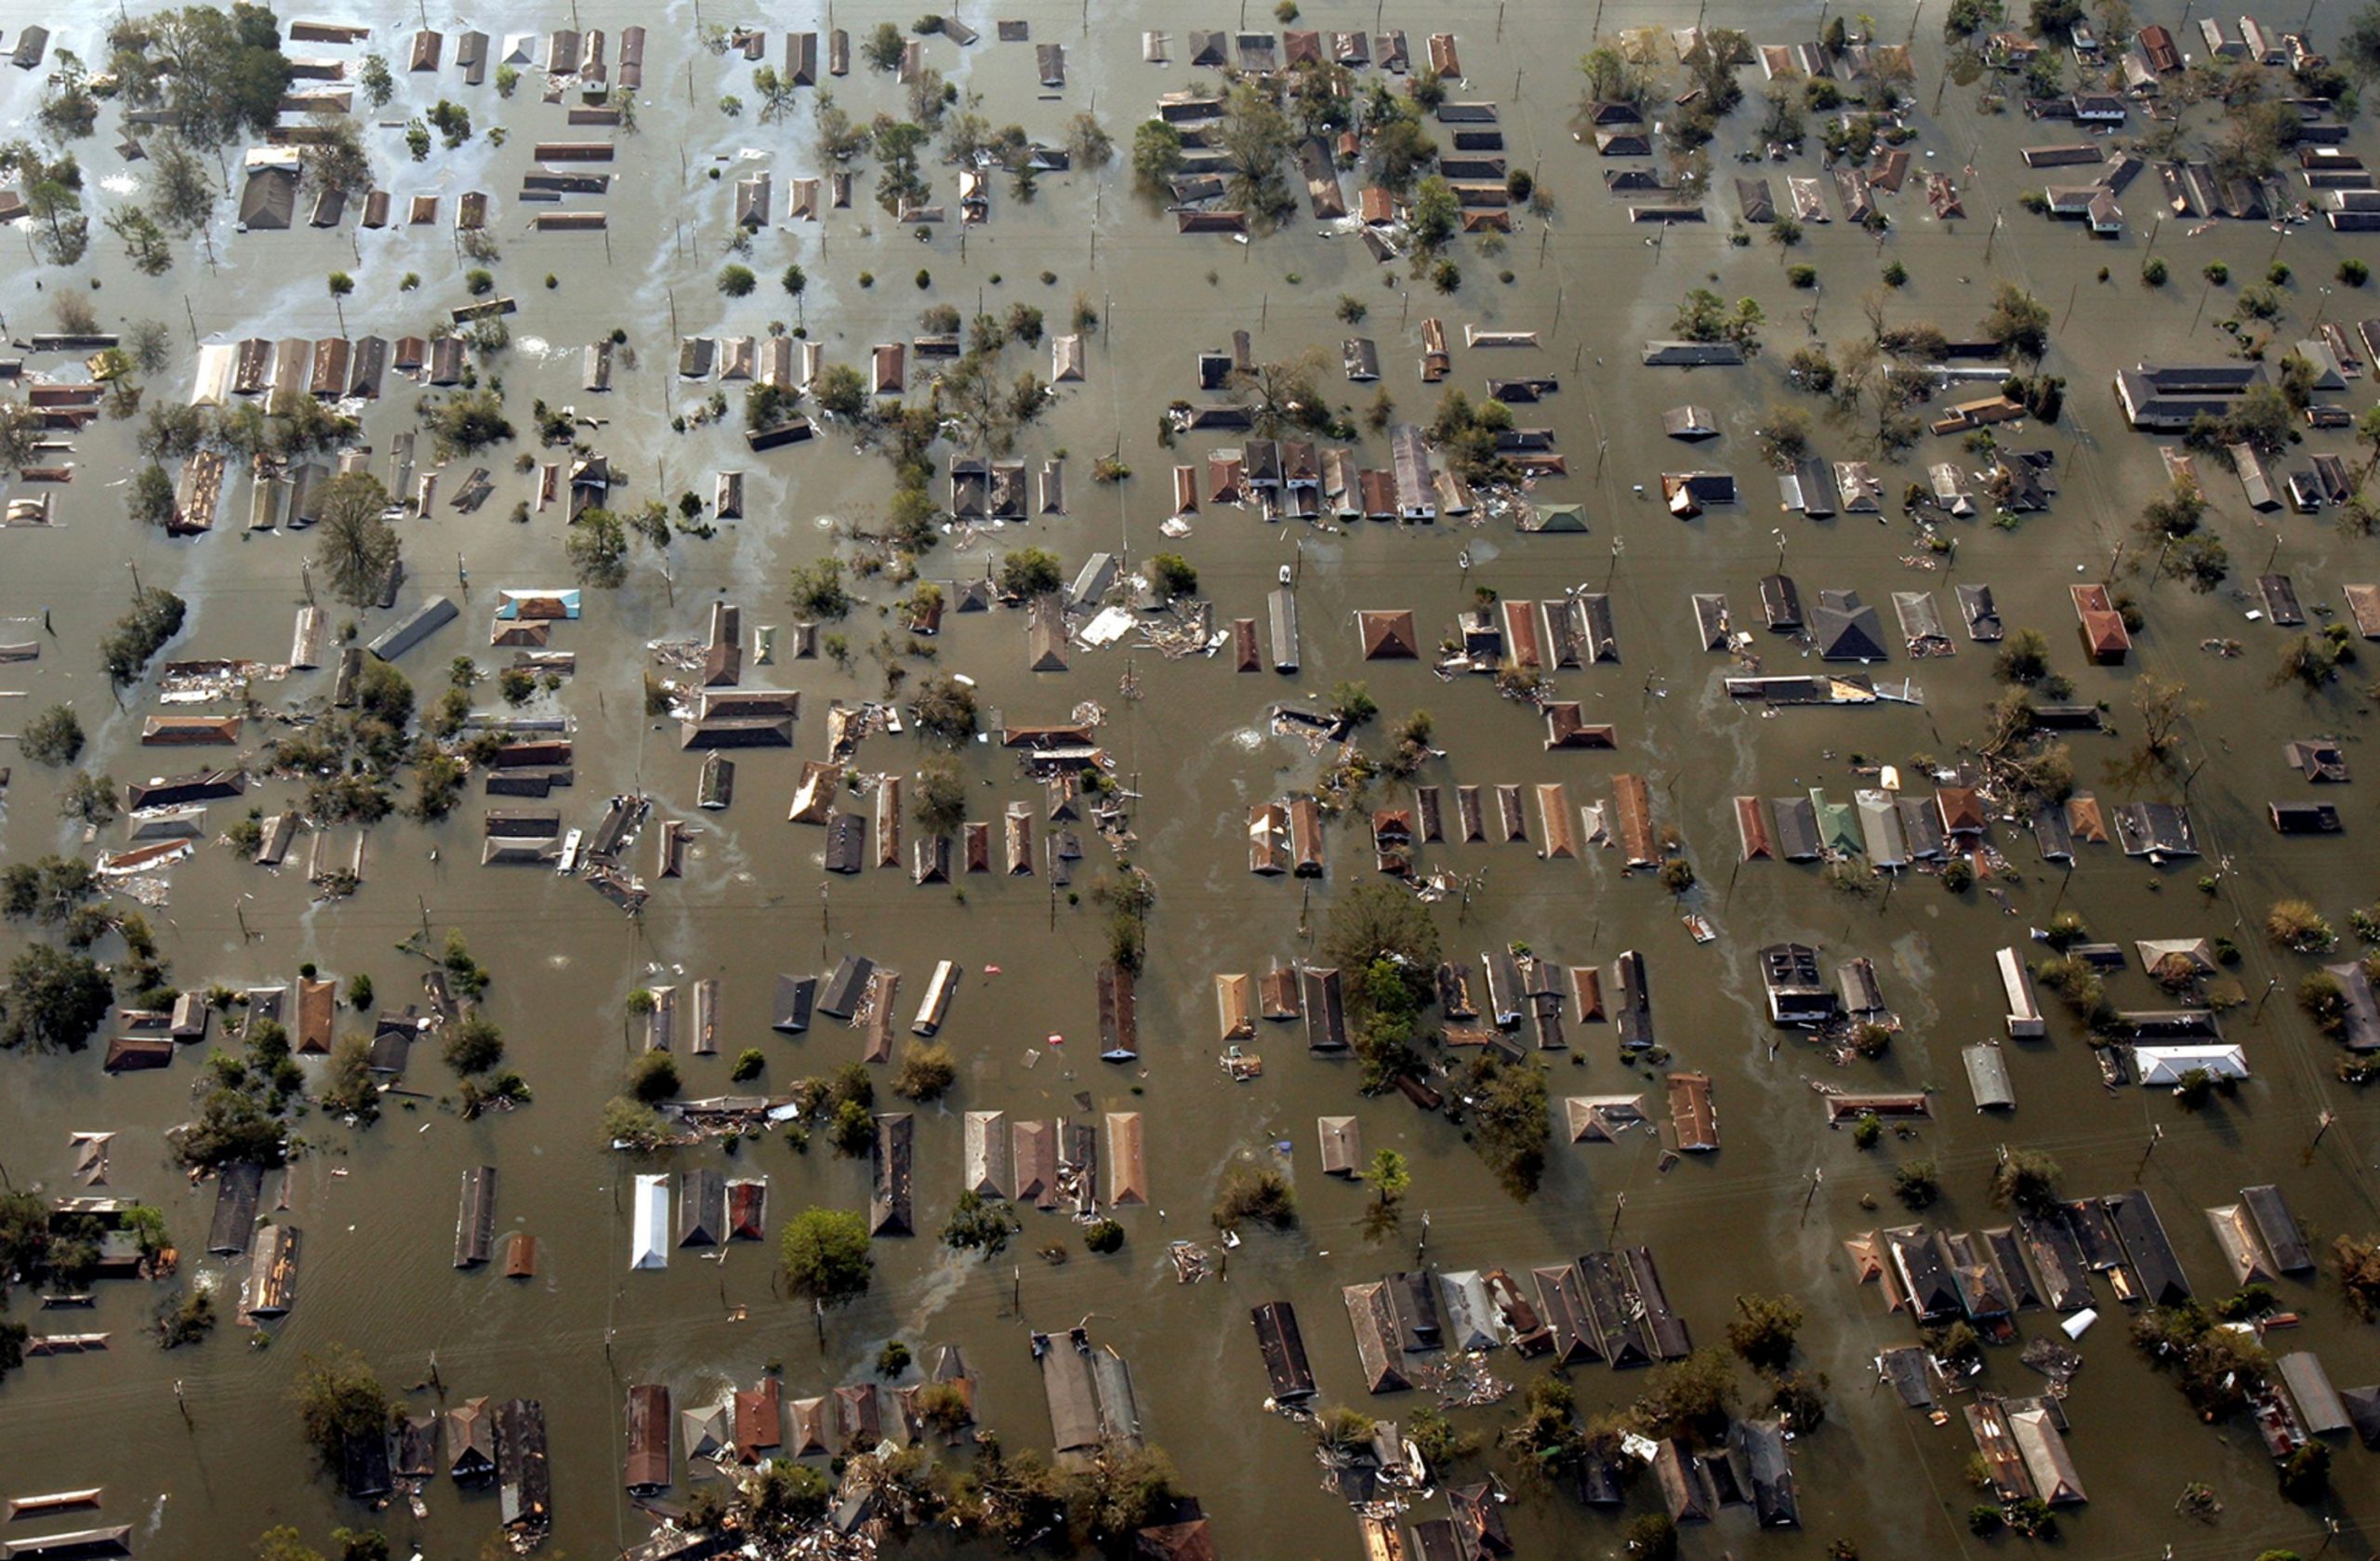
Fort Myers Beach, a popular tourist destination known for its white-sand beaches and vibrant atmosphere, bore the brunt of Ian’s fury. The storm surge, a wall of water reaching heights of 12-18 feet, inundated the island, sweeping away homes, businesses, and landmarks. Videos and images captured the devastation, showing buildings ripped from their foundations and debris floating amidst a sea of churning water. The storm surge’s impact extended inland, flooding communities along the Caloosahatchee River and causing widespread damage.

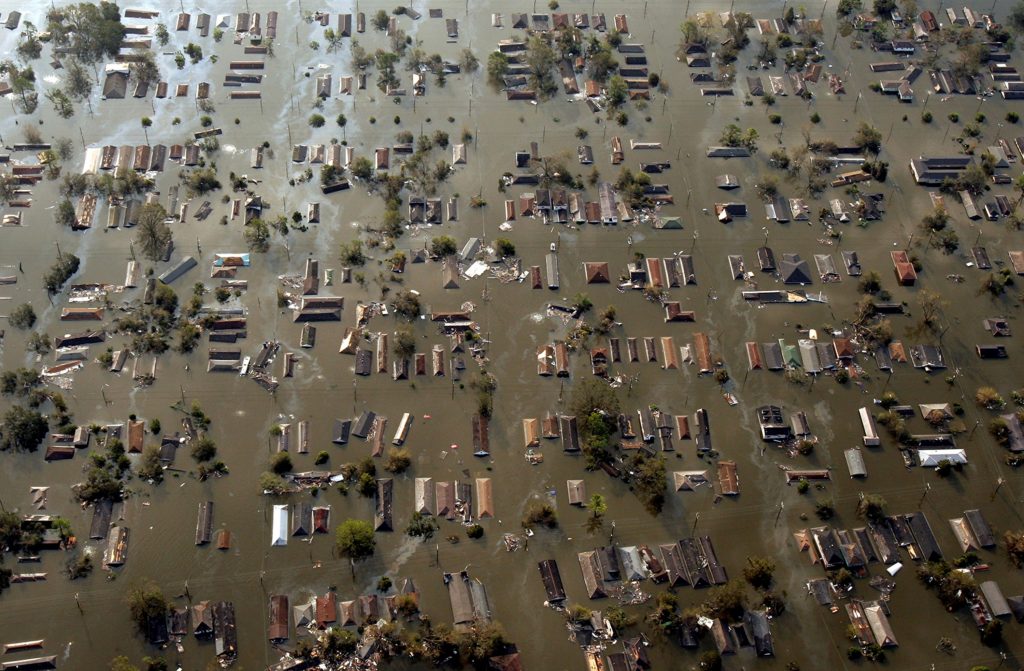
As Ian moved across the Florida peninsula, it weakened but continued to unleash its destructive power. Heavy rains, exceeding 20 inches in some areas, triggered widespread flooding, transforming streets into rivers and inundating homes. Orlando, a city typically associated with theme parks and sunshine, experienced record rainfall and significant flooding, disrupting daily life and causing extensive damage. The storm’s winds, though diminished, remained strong enough to down trees and power lines, leaving millions without electricity.

The morning of September 27, 2022, dawned with a sense of foreboding for residents along Florida’s Gulf Coast. Hurricane Ian, having churned and intensified in the warm waters of the Gulf of Mexico, was now a Category 3 behemoth, its sights set on the Sunshine State. Mandatory evacuations were ordered for low-lying areas, and a mass exodus began as residents heeded the warnings, fleeing inland in search of safety. Those who remained, either by choice or circumstance, braced for the impending impact, boarding up windows, securing belongings, and seeking shelter in sturdy structures or local shelters.

As the hours ticked by, the storm’s outer bands began to lash the coast, bringing with them squalls of rain and increasingly strong winds. Fort Myers Beach, a vibrant tourist destination known for its white-sand beaches and lively atmosphere, transformed into a ghost town. Palm trees swayed violently, their fronds whipping in the wind, and the normally calm Gulf waters turned into a churning, angry sea. A sense of anxiety and uncertainty hung thick in the air as residents huddled indoors, listening to the howling wind and the relentless pounding of the rain.

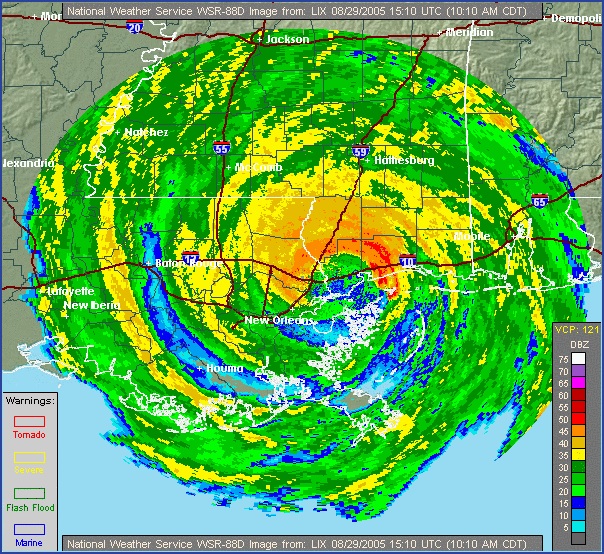
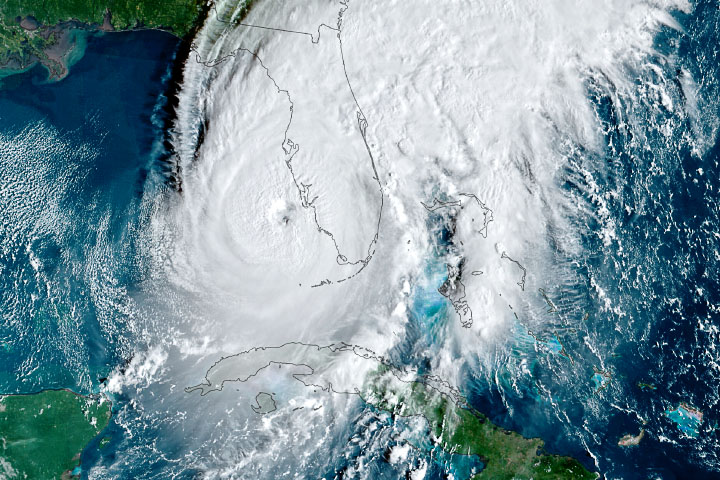
By afternoon, Ian’s approach was undeniable. The sky turned an ominous gray, and the wind intensified, carrying with it the roar of the approaching storm. At approximately 3:05 pm, the moment residents had dreaded arrived. Hurricane Ian made landfall near Cayo Costa as a powerful Category 4 storm, its sustained winds of 150 mph capable of ripping buildings apart. The storm surge, a towering wall of water reaching heights of 12-18 feet, roared ashore, engulfing Fort Myers Beach and surrounding areas. Homes were lifted from their foundations and carried away by the raging waters, businesses crumbled into piles of debris, and landmarks that had stood for decades vanished beneath the waves.

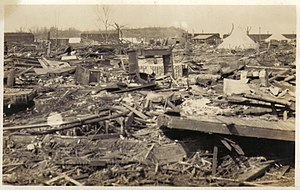
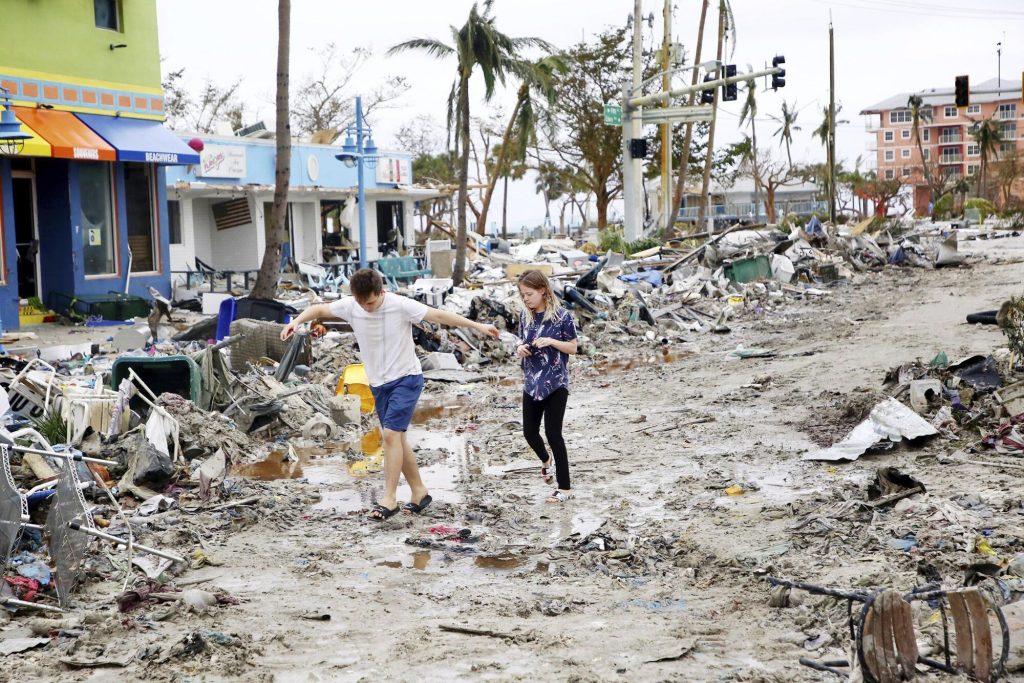
The devastation on Fort Myers Beach was catastrophic. The once-idyllic island was transformed into a scene of utter destruction, a tangled mess of debris, destroyed buildings, and flooded streets. Rescue crews, braving the treacherous conditions, began the daunting task of searching for survivors and assessing the damage. Residents who had evacuated returned to find their homes gone, their belongings scattered, and their lives irrevocably changed.

As Ian moved across the Florida peninsula, it weakened but continued to unleash its fury. Heavy rains, exceeding 20 inches in some areas, triggered widespread flooding. In Orlando, a city known for theme parks and sunshine, streets became rivers, cars were submerged, and homes were inundated with water. The storm’s winds, though diminished, downed trees and power lines, leaving millions across the state without electricity and plunging communities into darkness.

The meteorological factors that contributed to Ian’s intensification were a combination of warm waters in the Gulf of Mexico, low wind shear, and a favorable atmospheric pattern. Sea surface temperatures in the Gulf were well above average, providing ample fuel for the storm’s growth. Additionally, wind shear, the change in wind speed and direction with height, which can disrupt hurricane development, was minimal. This allowed Ian to maintain its structure and strengthen rapidly. Finally, a steering pattern in the upper atmosphere guided Ian towards the Florida peninsula, setting the stage for a devastating landfall.

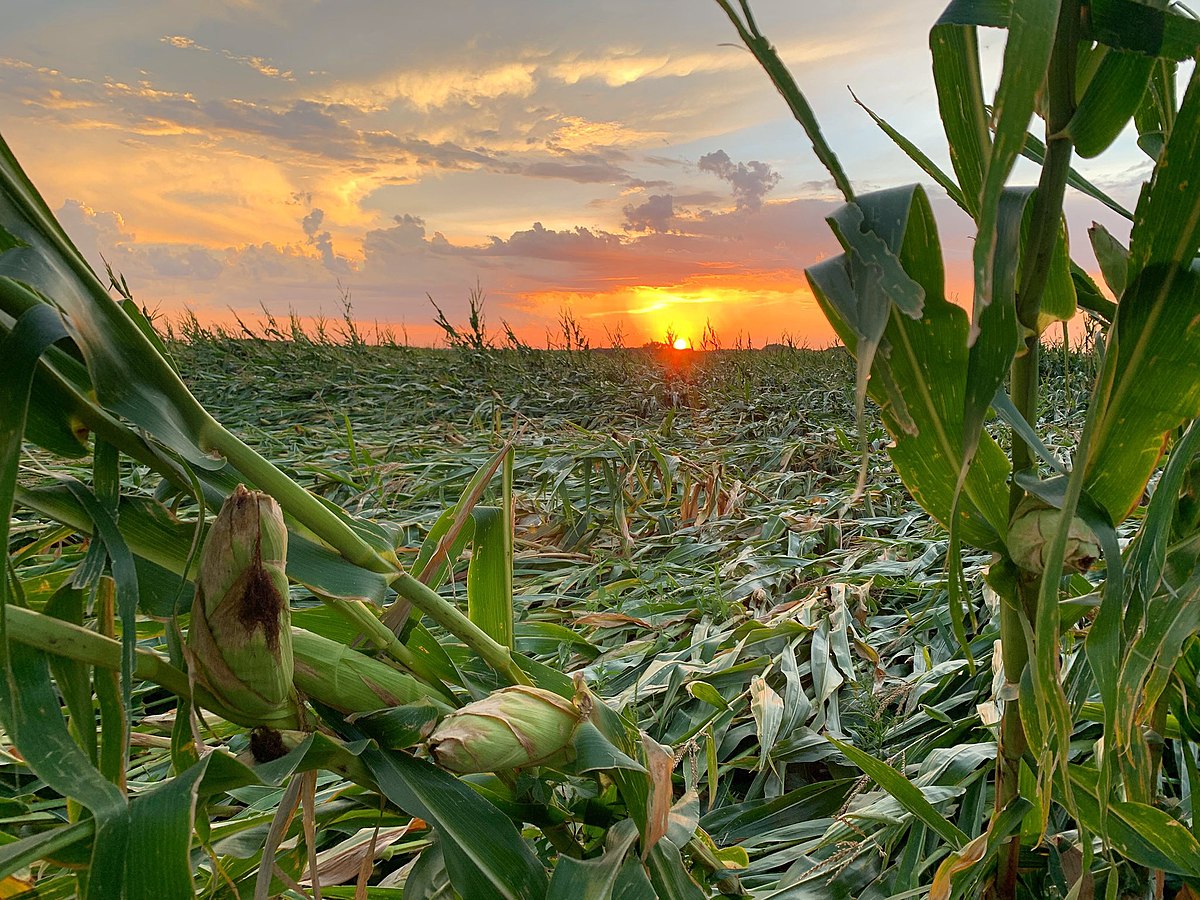
Ian’s impact extended beyond the immediate devastation of wind and water. The storm disrupted supply chains, leading to shortages of gasoline and other essential goods. The tourism industry, a vital part of Florida’s economy, suffered a significant blow, as hotels, attractions, and beaches were damaged or closed. The agricultural sector also experienced losses, with citrus groves and other crops impacted by the storm’s winds and flooding.

Meteorological Genesis and Escalation:

  • September 23, 2022: A tropical wave emerges off the coast of Africa, embarking on a journey across the Atlantic.
  • September 24-26, 2022: The tropical wave strengthens into a tropical depression and then Tropical Storm Ian, churning westward through the Caribbean Sea.
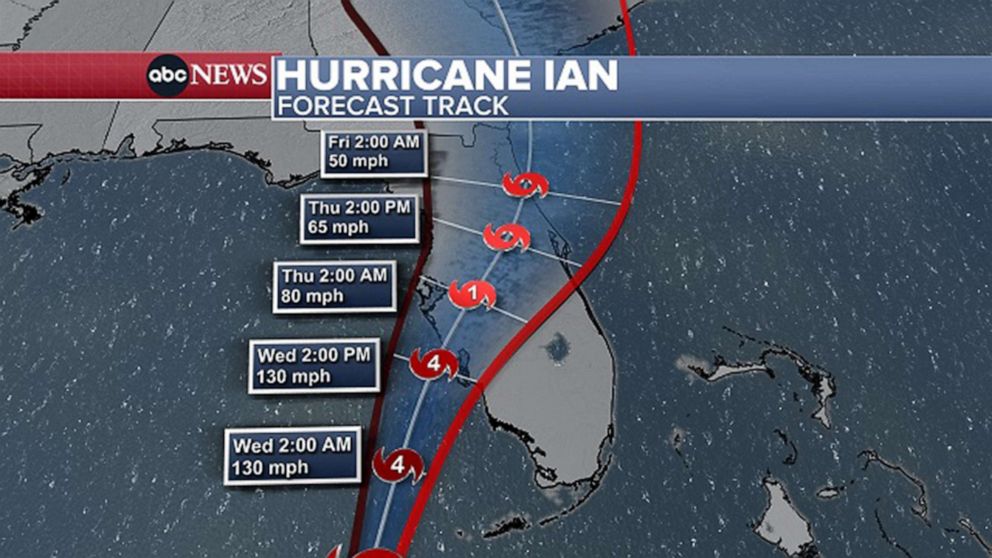
  • September 27, 2022: Ian undergoes rapid intensification, exploding into a major hurricane as it enters the Gulf of Mexico’s warm waters. Florida residents brace for impact as mandatory evacuations are issued for vulnerable coastal areas.

Landfall and the Unleashing of Fury:

  • September 28, 2022 (Morning): Hurricane Ian, now a monstrous Category 4 storm with sustained winds of 150 mph, takes aim at the Florida Gulf Coast. The atmosphere is thick with anticipation and dread as residents finalize preparations or evacuate inland.
  • September 28, 2022 (Afternoon): At approximately 3:05 pm, Ian makes landfall near Cayo Costa, an island off the coast of Fort Myers. The storm surge, a towering wall of water reaching heights of 12-18 feet, slams ashore, engulfing coastal communities and causing catastrophic damage. Fort Myers Beach is particularly hard hit, with homes swept away, businesses destroyed, and landmarks obliterated.

Unfolding Devastation and Inland Inundation:

  • September 28, 2022 (Evening): Ian continues its destructive path across the Florida peninsula, weakening but still packing a powerful punch. Heavy rains, exceeding 20 inches in some areas, trigger widespread flooding. Orlando and other inland cities experience record rainfall, transforming streets into rivers and inundating homes and businesses.
  • September 29, 2022: The storm weakens further as it moves across central Florida and emerges into the Atlantic Ocean. However, its impact continues to be felt, with widespread power outages, disrupted infrastructure, and ongoing flooding.

The Wake of Destruction and the Road to Recovery:

  • September 30 – October 2022: The full extent of the devastation becomes clear as floodwaters recede and search and rescue efforts transition to recovery operations. Communities across Florida face the daunting task of rebuilding homes, businesses, and infrastructure. The economic toll of the storm is staggering, with estimates exceeding $100 billion.

Hurricane Katrina: The Destruction of New Orleans

The date August 29, 2005, remains etched in the annals of American history, a day when Hurricane Katrina, a tempest of unimaginable fury, unleashed its wrath upon the Gulf Coast. New Orleans, a city celebrated for its vibrant culture, rich history, and unique spirit, found itself at the epicenter of the disaster. As Katrina’s winds howled and storm surge swelled, the city’s levee system, a supposed bulwark against the encroaching waters, failed catastrophically.

Meteorological Timeline:

  • August 23, 2005: A tropical depression forms over the Bahamas, later strengthening into Tropical Storm Katrina.
  • August 25, 2005: Katrina intensifies into a Category 1 hurricane and makes landfall in southern Florida, causing flooding and wind damage.
  • August 26-27, 2005: Katrina emerges into the Gulf of Mexico and undergoes rapid intensification, reaching Category 5 strength with sustained winds of 160 mph.
  • August 28, 2005: Katrina weakens slightly to a Category 3 hurricane but remains a formidable storm as it approaches the Gulf Coast.

Landfall and Immediate Aftermath:

  • August 29, 2005: Hurricane Katrina makes landfall near Buras-Triumph, Louisiana, as a Category 3 hurricane with sustained winds of 125 mph. The storm surge, exceeding 20 feet in some areas, breaches levees in New Orleans, leading to catastrophic flooding.
  • August 29-30, 2005: Floodwaters inundate New Orleans, submerging entire neighborhoods and stranding residents. The Superdome, serving as a shelter, becomes overcrowded and conditions deteriorate. Rescue efforts begin, but the scale of the disaster overwhelms response capabilities.

Unfolding Disaster and Response Efforts:

  • August 31 – September 4, 2005: The magnitude of the disaster becomes increasingly apparent as floodwaters remain stagnant and rescue efforts continue. The Lower Ninth Ward and other low-lying areas of New Orleans remain submerged, with residents trapped and desperate for help. Criticism mounts over the slow and inadequate response from federal, state, and local authorities.
  • September 5-10, 2005: Floodwaters begin to recede slowly, revealing the extent of the devastation. Search and rescue efforts transition to recovery operations, as debris removal and damage assessments begin. The death toll rises, and the displacement of hundreds of thousands of residents creates a humanitarian crisis.

The consequences were immediate and devastating. Floodwaters surged through breaches in the levees, transforming streets into raging rivers and submerging entire neighborhoods. The iconic French Quarter, with its historic architecture and lively atmosphere, became an island amidst a sea of brown, polluted water. The Superdome, a massive stadium that had served as a shelter of last resort for thousands of evacuees, became a symbol of the city’s plight, its roof peeled back and its interior conditions deteriorating rapidly.

Across the city, tales of survival and heartbreak unfolded. Residents trapped in attics and on rooftops awaited rescue, desperate for any sign of help. Families were separated, loved ones lost, and homes destroyed. The Lower Ninth Ward, a predominantly African American neighborhood, suffered some of the worst flooding, its residents left stranded and forgotten for days. The stories that emerged from Katrina’s aftermath were a testament to the human spirit’s resilience in the face of unimaginable adversity.

Katrina’s impact extended far beyond New Orleans. Coastal communities across Mississippi, Alabama, and the Florida Panhandle were battered by the storm’s fury. In Biloxi, Mississippi, a once-thriving tourist destination, the storm surge swept away homes, businesses, and casinos, leaving behind a desolate landscape of debris and destruction. Gulfport, Mississippi, another coastal city, faced similar devastation, its harbor and waterfront areas obliterated by the storm’s power.

As Katrina moved inland, it weakened but continued to unleash torrential rains, leading to widespread flooding across the Southeast. Rivers and streams overflowed their banks, inundating homes and businesses and displacing thousands. The storm’s impact on infrastructure was equally devastating, with power outages affecting millions and transportation networks crippled. The economic toll of Katrina was staggering, estimated at over $100 billion, making it one of the costliest natural disasters in U.S. history.

The meteorological factors that contributed to Katrina’s formation and intensification were a perfect storm of conditions. Warm waters in the Gulf of Mexico provided ample fuel for the storm’s growth, while low wind shear allowed it to maintain its structure and strengthen rapidly. A high-pressure system over the southeastern United States steered Katrina on a direct path towards the Gulf Coast, giving residents little time to prepare for the impending disaster.

Katrina’s legacy is complex and multifaceted. The storm exposed deep-seated social and economic inequalities, as marginalized communities disproportionately bore the brunt of the disaster. The failure of the levee system in New Orleans raised questions about infrastructure investment and disaster preparedness, prompting a national conversation about the nation’s vulnerability to extreme weather events. The storm’s aftermath was marked by a slow and often chaotic response, leading to criticism of government agencies at all levels and calls for reform.

Hurricane Katrina serves as a stark reminder of the destructive power of nature and the importance of preparedness, infrastructure investment, and social equity in mitigating the impact of such catastrophic events. The storm’s legacy continues to shape policy and planning, as communities strive to build resilience and ensure that the lessons learned from Katrina are not forgotten. The stories of survival, loss, and community spirit that emerged from the storm’s aftermath continue to inspire and remind us of the indomitable human spirit in the face of adversity.

The Midwest Derecho: An Unforgettable Tempest’s Trail of Wind Destruction (August 10, 2020)

The date August 10, 2020, is etched in the memories of millions across the Midwest, a day when the skies unleashed a tempest of unimaginable fury. A derecho, a powerful and expansive windstorm, ripped through the heartland, leaving a trail of devastation that stretched from South Dakota to Ohio. This wasn’t just a storm; it was a meteorological monster, its ferocity exceeding expectations and its impact leaving communities reeling in its wake.

The storm’s genesis lay in the atmospheric instability brewing over South Dakota and Nebraska. Thunderstorms erupted, fueled by a potent mix of warm, moist air and strong upper-level winds. These storms, initially isolated, began to coalesce into a line, forming a squall line, a telltale sign of a developing derecho. This line of storms, propelled by the jet stream, raced eastward at speeds exceeding 70 mph, evolving into a meteorological juggernaut.

Iowa found itself directly in the derecho’s path, bearing the brunt of its wrath. Wind gusts of up to 140 mph, equivalent to a Category 4 hurricane, tore through cities and towns. Cedar Rapids, a city of over 130,000, was particularly devastated. The winds, relentless and unforgiving, peeled roofs off buildings, tossed vehicles like rag dolls, and uprooted centuries-old trees. The city’s landscape was transformed into a scene of utter chaos, with debris littering the streets and power lines dangling precariously.

The derecho’s impact extended far beyond Cedar Rapids. Across Iowa, an estimated 14 million acres of cropland were damaged or destroyed, representing roughly a third of the state’s corn and soybean crops. The agricultural industry, the backbone of Iowa’s economy, suffered a staggering blow, with losses estimated in the billions of dollars. The storm’s fury also left millions without power, plunging homes and businesses into darkness and disrupting daily life for weeks.

In Cedar Rapids, Iowa, the derecho’s arrival was swift and brutal. At approximately 11:15 am, the sky turned an ominous green as the leading edge of the storm approached. Within minutes, the city was engulfed in a maelstrom of wind and rain. Residents huddled in basements and interior rooms as the deafening roar of the wind filled the air. Trees snapped like twigs, roofs were peeled off buildings, and debris flew through the air like missiles. One resident recounted the terrifying experience of watching a large tree crash through his living room window, narrowly missing him and his family.

The storm’s impact on rural communities was equally devastating. Farmers watched in disbelief as their corn and soybean fields, once lush and green, were flattened in a matter of minutes. Grain bins were crumpled like soda cans, and barns and outbuildings were reduced to piles of debris. One farmer, who had worked the land for over 50 years, described the scene as “total devastation,” his livelihood wiped away in an instant. The derecho’s impact on agriculture reverberated throughout the region, disrupting supply chains and causing food prices to rise.

As the derecho continued its eastward rampage, it maintained its intensity, leaving its mark on Illinois, Indiana, and Ohio. Chicago experienced wind gusts exceeding 90 mph, causing widespread power outages and bringing the city’s bustling transportation system to a standstill. In Indiana, the storm spawned several tornadoes, adding to the destruction. Even as the derecho weakened, it continued to produce damaging winds and heavy rain, extending its reach over 770 miles and impacting millions.

The meteorological intricacies that birthed and sustained this derecho were complex. A key factor was the presence of a strong upper-level jet stream, which provided the necessary wind shear to organize the thunderstorms into a line and propel them forward at breakneck speeds. Additionally, a pre-existing mesoscale convective system (MCS), a large cluster of thunderstorms, served as the derecho’s building block, providing a source of lift and moisture.

As the derecho matured, it developed a bow echo, a characteristic radar signature associated with destructive straight-line winds. The bow echo, shaped like an archer’s bow, indicated the presence of a powerful downdraft, which spread out upon reaching the ground, generating the hurricane-force winds that ravaged the Midwest. The combination of these factors created a perfect storm, a derecho of unprecedented power and scope.

Derechos have a long and destructive history in the United States, with several notable events leaving their mark on the nation’s memory. One of the most infamous derechos occurred on June 29, 2012, sweeping across the Mid-Atlantic region and causing widespread damage from Indiana to the East Coast. This derecho, known as the “Super Derecho” due to its exceptional intensity and scope, produced wind gusts exceeding 100 mph and left millions without power. The 2012 derecho traveled over 700 miles and caused an estimated $2.9 billion in damage, highlighting the destructive potential of these powerful windstorms.

Another significant derecho event occurred on May 8, 1995, impacting a large portion of the Midwest. This derecho, which originated in Kansas, traveled over 1,000 miles and produced wind gusts of up to 120 mph. The storm caused widespread damage to trees, power lines, and structures, leaving over 2 million people without power. The 1995 derecho was particularly notable for its long duration, lasting for over 12 hours, and its extensive path, which stretched from Kansas to the East Coast.

The Midwest derecho of 2020 stands out for several reasons. Its peak wind gusts of 140 mph were among the highest ever recorded for a derecho, rivaling the intensity of a major hurricane. The storm’s impact on agriculture was particularly severe, with millions of acres of crops damaged or destroyed, causing significant economic losses. Additionally, the derecho’s rapid intensification and relatively short warning time caught many off guard, underscoring the challenges of forecasting and preparing for these powerful windstorms. While derechos are not uncommon in the Midwest, the 2020 event served as a stark reminder of their destructive potential and the importance of remaining vigilant during severe weather events.

The Midwest derecho of 2020 stands as a stark reminder of the unpredictable and destructive nature of severe weather. Its impact extended far beyond the immediate damage to infrastructure and agriculture, leaving a lasting mark on the lives of millions. The storm exposed vulnerabilities in infrastructure and emergency response systems, prompting a reevaluation of preparedness measures and a call for increased investment in resilient infrastructure. As communities rebuild and recover, the memory of the derecho serves as a powerful motivator to strengthen defenses against future storms and ensure the safety and well-being of those who call the Midwest home.

The Tri-State Tornado: A Trail of Destruction Across Three States – March 18, 1925

The afternoon of March 18, 1925, etched itself into the annals of American history as the deadliest tornado event the nation has ever witnessed. A single, monstrous tornado tore through portions of Missouri, Illinois, and Indiana, leaving behind a 219-mile path of devastation. In its wake, the Tri-State Tornado, as it came to be known, claimed 695 lives, injured over 2,000 people, and caused catastrophic damage to homes, businesses, and the landscape itself. The roar of the tornado was said to be audible from miles away, described by survivors as sounding like a freight train or the continuous rumble of thunder.

Emerging in southeastern Missouri, the tornado first touched down around 1 p.m. near Ellington. Witnesses reported seeing a dark, swirling funnel cloud descend from the sky, growing in size and intensity as it moved across the countryside. The small community of Annapolis, Missouri was directly in its path, and within minutes, the town was reduced to rubble. Homes were obliterated, trees uprooted, and the local schoolhouse was completely destroyed with over 100 students inside. Miraculously, only one child lost their life due to the quick actions of the teachers who ushered the children into the basement just before the tornado struck. Sadly, 38 people lost their lives in Annapolis alone. Continuing its northeastward track, the tornado crossed the Mississippi River into southern Illinois, striking the towns of Gorham and Murphysboro. Murphysboro suffered the most significant loss of life with 234 fatalities. The business district was completely leveled, and the remains of the Murphysboro High School were scattered for miles.

As the tornado moved into Indiana, its path widened, reaching an astonishing 2.5 miles at its maximum width. The towns of Griffin and Owensville were heavily impacted, with countless homes and businesses leveled. In Griffin, a local church was destroyed while a service was in progress, resulting in the tragic loss of 69 lives. The Tri-State Tornado finally dissipated near Petersburg, Indiana, after a horrifying 3.5-hour rampage. In total, 19 communities were directly affected, with thousands of buildings destroyed and an estimated $17 million in property damage (equivalent to over $250 million today). The aftermath resembled a war zone, with debris strewn across the landscape and survivors left in shock and despair.

The meteorological conditions that spawned the Tri-State Tornado were a potent mix of atmospheric ingredients. A strong low-pressure system tracked across the central plains, dragging a warm front northward. To the south, warm, moist air surged from the Gulf of Mexico, while cold, dry air aloft created an unstable atmosphere. As the warm front collided with the colder air, powerful thunderstorms erupted, providing the energy needed for tornadic development.

The specific dynamics of the storm system, including wind shear (changes in wind speed and direction with height), contributed to the tornado’s longevity and intensity. The wind shear created a horizontal rolling motion in the atmosphere, which helped to concentrate and stretch the storm’s rotation, leading to the formation of a long-lasting and powerful tornado. Additionally, the relatively flat terrain of the region offered little resistance to the twister’s path, allowing it to maintain its strength over a longer distance.

The Tri-State Tornado remains a stark reminder of the destructive power of nature and the importance of severe weather preparedness. Its legacy has contributed to advancements in tornado research, forecasting, and warning systems, ultimately saving countless lives in the decades since this devastating event. The storm’s impact on the field of meteorology is undeniable, as it prompted further study of tornado formation and behavior, leading to improved understanding and prediction of these destructive forces.

One of the closest comparisons in terms of path length is the Great Natchez Tornado of 1840. This devastating tornado, which struck Natchez, Mississippi and surrounding areas, carved a path estimated to be between 150 and 200 miles long. However, due to limitations in record-keeping and population density at the time, the exact number of fatalities remains uncertain, with estimates ranging from 100 to 317 deaths.

Another notable tornado event was the 1974 Super Outbreak, which unleashed 148 tornadoes across 13 states in just 18 hours. This outbreak resulted in 330 fatalities and caused extensive damage. However, the Super Outbreak was characterized by numerous individual tornadoes, rather than a single, long-track event like the Tri-State Tornado.

Forecasting Tornadoes and Severe Storms With Modern Technology

Tornadoes, with their raw power and unpredictable nature, have long captivated and terrified people. While the science of forecasting these violent storms has progressed significantly, predicting their exact location and timing remains a complex challenge. However, thanks to advancements in technology, data analysis, and a deeper understanding of atmospheric dynamics, we can now decipher the skies with greater accuracy, providing crucial information to keep communities safe.

The Building Blocks of Severe Weather:

To understand tornado formation, we must first explore the ingredients that brew severe thunderstorms, their birthplace.

  • Instability: The atmosphere needs to be unstable, meaning the air near the ground is warmer and more humid than the air aloft. This temperature difference creates rising air parcels, the building blocks of thunderstorms.
  • Lift: Something needs to initiate the upward movement of air, such as a frontal boundary, a dryline, or even the heating of the ground on a sunny day.
  • Moisture: Ample moisture is necessary to fuel the development of clouds and precipitation within the thunderstorm.
  • Wind Shear: This refers to the change in wind speed and direction with height. Wind shear is crucial for creating rotation within the storm, a key ingredient for tornado formation.

Identifying the Threats:

Meteorologists rely on a variety of tools to identify and track potential severe weather:

  • Doppler Radar: This technology detects precipitation and wind movement within a storm. By analyzing the radar data, meteorologists can identify areas of rotation, known as mesocyclones, which are often precursors to tornadoes. Apps like Tornado Vision utilize radar data to provide users with a visual representation of storm rotation and the potential for tornado development.
  • Satellite Imagery: Satellites provide a broader perspective of weather systems, allowing meteorologists to track storm development, movement, and intensity.
  • Surface Observations: Data from weather stations on the ground, including temperature, humidity, wind speed, and barometric pressure, provide valuable insights into local atmospheric conditions.
  • Weather Models: Complex computer models simulate atmospheric processes to predict future weather conditions. While not perfect, these models have become increasingly sophisticated and provide valuable guidance to forecasters.

Advanced Tools for Enhanced Awareness:

Innovative apps like Predict Now, Hail No!, and Tornado Vision empower individuals with real-time data and storm tracking capabilities:

  • Predict Now: Provides users with comprehensive weather information, including forecasts, radar imagery, and severe weather alerts, allowing them to stay informed about potential threats in their area.
  • Hail No!: Utilizes a specialized hail detection algorithm to display hail locations and sizes in real-time, offering customizable alerts based on hail size and proximity to a user’s location. This app is particularly valuable for individuals in hail-prone areas or those who work outdoors.
  • Tornado Vision: Leverages the power of augmented reality to visualize potential tornadoes within storms. By pointing their phone at a storm, users can see an overlay of data, including the chance of a tornado, hail size, wind speed, and other critical storm characteristics. This innovative technology helps users make informed decisions about their safety during severe weather events.

The Importance of Preparedness:

While forecasting technology continues to improve, tornadoes can still strike with little warning. Preparedness is key to ensuring safety:

  • Stay Informed: Monitor weather forecasts and warnings from reliable sources.
  • Have a Plan: Develop a family emergency plan that includes a designated shelter location, communication protocols, and emergency supplies.
  • Practice Drills: Regularly practice tornado drills so everyone knows what to do and where to go in case of a tornado warning.

By understanding the science behind tornadoes and severe storms, utilizing advanced technology and tools like weather apps, and taking proactive steps toward preparedness, we can better navigate the unpredictable nature of these powerful events and protect ourselves and our communities.

Tornado Vision: App Review

Tornado Vision is an app that combines three separate features to be the ultimate assistant for those who are interested to keep situational awareness of severe weather.

For one the app uses augmented reality to display the nearest storm to you with the latest data including the chance of hail, tornado and wind as well as information about warnings and storm reports as well as direction and distance. You can click on any of these icons to get a more detailed display.

Here you can see a tutorial of all the individual augmented reality features for a storm when using Tornado Vision.

Tornado Vision also has filters that were tested on hundreds of low contrast tornadoes, usually those hidden in the rain that help you bring out the details.

This tornado WAS NOT visible to the naked eye at this point but with the help of Tornado Vision is 100% visible. The last feature of Tornado Vision is the lightning trigger, at night it’s incredibly hard to see a torando except for a momentary flash of lightning, by switching to night mode you can have it freeze whenever a certain illumination point is reached, this will help you see tornadoes more easily.

Here are videos of Tornado Vision being used around severe storms.

The full features of TornadoVision are:

Augmented Reality displays chance of tornado, hail (and size) and wind when looking at a storm.

Augmented Reality displays if you are in tornado or severe thunderstorm warning.

Augmented reality displays any Tornado or Hail reports.

Four specially designed camera filters help bring out tornadoes hiding in the rain.

Night mode automatically captures hidden night-time tornadoes.

Bring up data on storm characteristics, including rotation, maximum hail size and lightning flash rate.

Bring up environmental data like storm relative helicity, CAPE and bulk wind.

Predict Now – The Ultimate Weather Forecasting App for Enthusiasts

As the creator of Predict Now, I wanted an app that fit the needs of meteorologists, storm chasers, and weather enthusiasts who are passionate about forecasting severe weather. Predict Now is the result of thousands of hours of research, development, and conversations with people who forecast weather.

One of the standout features of Predict Now is its detailed radar maps. I have ensured that the app provides a comprehensive view of radar activity across the entire United States, enabling users to easily track storms and precipitation. Whether you’re monitoring a local thunderstorm or following the path of a hurricane, Predict Now’s radar maps will keep you informed and ahead of the game with updates every 2 minutes.

In addition to radar, I have incorporated a powerful front tracking feature in Predict Now. This allows users to visualize the movement of warm fronts, cold fronts, and other weather systems, providing valuable insights into upcoming changes in the weather pattern. By staying informed about frontal movements, users can make more accurate predictions and better prepare for potential severe weather events.

I am particularly proud of the integration of the Storm Prediction Center’s mesoanalysis tool in Predict Now. This feature grants users access to a wealth of data and visualizations, offering insights into current weather conditions and severe weather potential. Users can explore various indices like CAPE, wind shear, and more, empowering them to make well-informed forecasts and assess the likelihood of severe weather outbreaks.

Predict Now also includes a comprehensive surface observations feature, displaying detailed METARs from numerous locations across different regions, including the infamous Tornado Alley. This allows users to access real-time weather updates and monitor conditions on the ground, which is crucial for storm chasers and those in areas prone to severe weather. There are thousands of surface observations available in Predict Now.

To provide users with the most advanced satellite imagery available, I have integrated data from the cutting-edge GOES-16 satellite into Predict Now. This offers high-resolution visuals of water vapor, infrared, and visible satellite data, giving users a comprehensive understanding of atmospheric conditions. The GOES-16 imagery is a game-changer for weather enthusiasts, enabling them to analyze and predict weather patterns with unprecedented accuracy.

Predict Now also leverages the power of the High-Resolution Rapid Refresh (HRRR) model, which is particularly useful for tracking rapidly changing weather events. The HRRR provides short-term, high-resolution forecasts, allowing users to stay on top of evolving weather situations. Additionally, the app includes other weather models like the NAM and NSSL WRF, offering users a variety of forecasting perspectives to enhance their understanding and prediction capabilities.

I have designed Predict Now with the specific goal of aiding individuals interested in monitoring and preparing for severe weather events like tornadoes, hailstorms, hurricanes and flash floods. The app’s high-resolution data, sourced from advanced models and satellite imagery, ensures accurate and detailed weather visualization. Moreover, Predict Now is optimized for iPhone, providing a smooth and efficient user experience while minimizing data usage.

With its wide coverage spanning the United States and Southern Canada, Predict Now caters to a large user base, making it the go-to app for weather enthusiasts across the region.

I am confident that Predict Now will revolutionize the way you track, analyze, and forecast severe weather. Whether you’re a seasoned meteorologist, a passionate storm chaser, or simply someone who wants to stay informed about the weather, Predict Now is the ultimate tool to elevate your forecasting skills.

Download Predict Now today and join the community of weather enthusiasts who rely on this powerful app to stay one step ahead of the storm. I am committed to continuously improving and updating Predict Now based on user feedback, ensuring that it remains the leading choice for severe weather forecasting.